Zip Codes with the Highest Percentage of Households with Income Above $200,000 in Leawood, KS
RELATED REPORTS & OPTIONS
Household Income | $200k+
Leawood
Compare Zip Codes
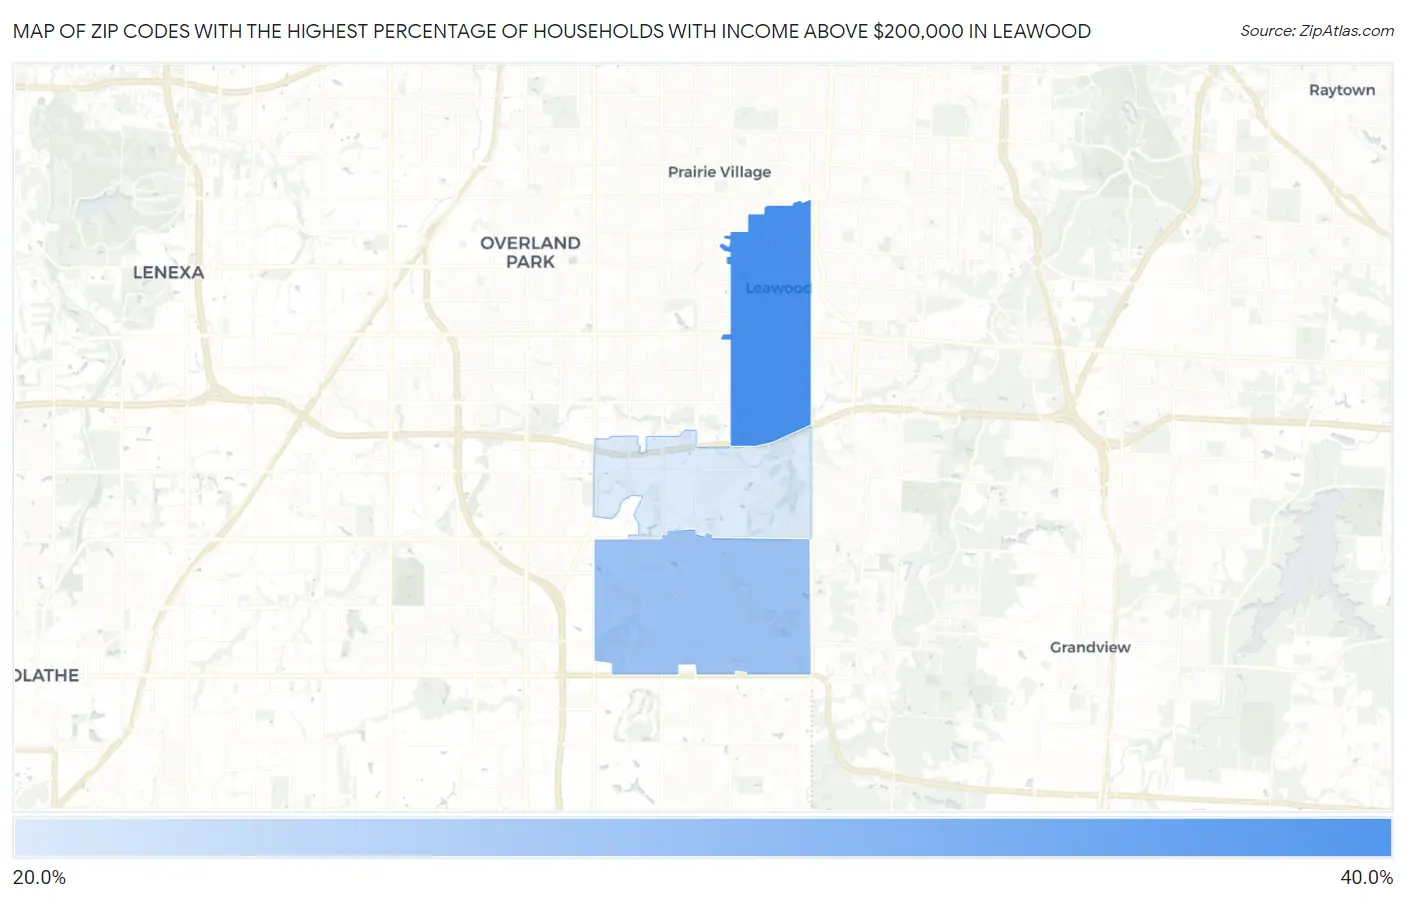
Map of Zip Codes with the Highest Percentage of Households with Income Above $200,000 in Leawood
29.8%
38.9%
Zip Codes with the Highest Percentage of Households with Income Above $200,000 in Leawood, KS
| Zip Code | Households with Income > $200k | vs State | vs National | |
| 1. | 66206 | 38.9% | 8.0%(+30.9)#5 | 11.4%(+27.5)#716 |
| 2. | 66209 | 33.6% | 8.0%(+25.6)#7 | 11.4%(+22.2)#1,103 |
| 3. | 66211 | 29.8% | 8.0%(+21.8)#12 | 11.4%(+18.4)#1,489 |
1
Common Questions
What are the Top Zip Codes with the Highest Percentage of Households with Income Above $200,000 in Leawood, KS?
Top Zip Codes with the Highest Percentage of Households with Income Above $200,000 in Leawood, KS are:
What zip code has the Highest Percentage of Households with Income Above $200,000 in Leawood, KS?
66206 has the Highest Percentage of Households with Income Above $200,000 in Leawood, KS with 38.9%.
What is the Percentage of Households with Income Above $200,000 in Leawood, KS?
Percentage of Households with Income Above $200,000 in Leawood is 44.7%.
What is the Percentage of Households with Income Above $200,000 in Kansas?
Percentage of Households with Income Above $200,000 in Kansas is 8.0%.
What is the Percentage of Households with Income Above $200,000 in the United States?
Percentage of Households with Income Above $200,000 in the United States is 11.4%.