Derby, KS Map & Demographics
Derby Map
Derby Overview
$38,246
PER CAPITA INCOME
$93,991
AVG FAMILY INCOME
$79,581
AVG HOUSEHOLD INCOME
41.8%
WAGE / INCOME GAP [ % ]
58.2¢/ $1
WAGE / INCOME GAP [ $ ]
$9,840
FAMILY INCOME DEFICIT
0.38
INEQUALITY / GINI INDEX
25,551
TOTAL POPULATION
12,761
MALE POPULATION
12,790
FEMALE POPULATION
99.77
MALES / 100 FEMALES
100.23
FEMALES / 100 MALES
35.4
MEDIAN AGE
3.2
AVG FAMILY SIZE
2.5
AVG HOUSEHOLD SIZE
12,962
LABOR FORCE [ PEOPLE ]
67.1%
PERCENT IN LABOR FORCE
4.0%
UNEMPLOYMENT RATE
Derby Zip Codes
Derby Area Codes
Income in Derby
Income Overview in Derby
Per Capita Income in Derby is $38,246, while median incomes of families and households are $93,991 and $79,581 respectively.
| Characteristic | Number | Measure |
| Per Capita Income | 25,551 | $38,246 |
| Median Family Income | 6,699 | $93,991 |
| Mean Family Income | 6,699 | $110,213 |
| Median Household Income | 10,029 | $79,581 |
| Mean Household Income | 10,029 | $95,847 |
| Income Deficit | 6,699 | $9,840 |
| Wage / Income Gap (%) | 25,551 | 41.77% |
| Wage / Income Gap ($) | 25,551 | 58.23¢ per $1 |
| Gini / Inequality Index | 25,551 | 0.38 |
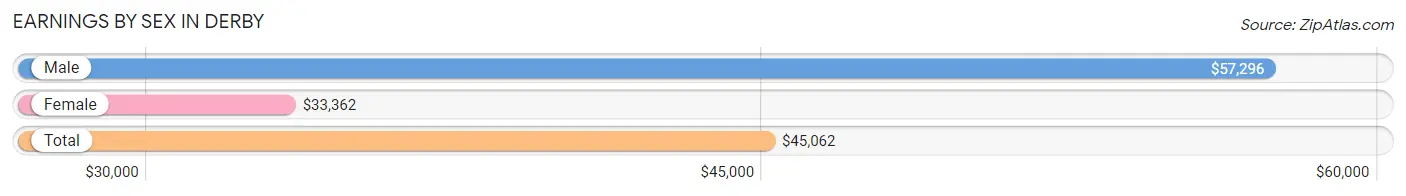
Earnings by Sex in Derby
Average Earnings in Derby are $45,062, $57,296 for men and $33,362 for women, a difference of 41.8%.
| Sex | Number | Average Earnings |
| Male | 7,442 (54.9%) | $57,296 |
| Female | 6,108 (45.1%) | $33,362 |
| Total | 13,550 (100.0%) | $45,062 |
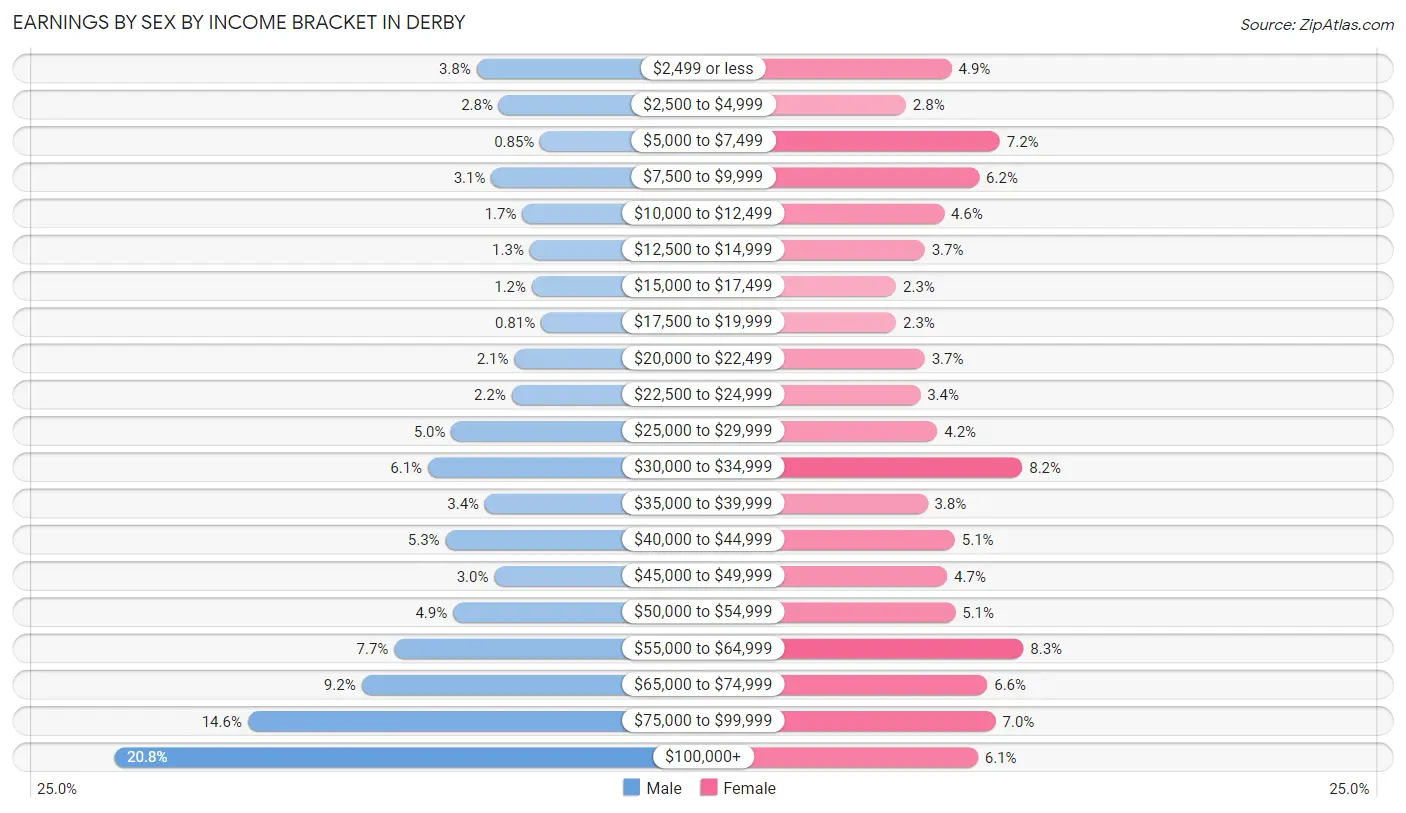
Earnings by Sex by Income Bracket in Derby
The most common earnings brackets in Derby are $100,000+ for men (1,549 | 20.8%) and $55,000 to $64,999 for women (505 | 8.3%).
| Income | Male | Female |
| $2,499 or less | 285 (3.8%) | 300 (4.9%) |
| $2,500 to $4,999 | 208 (2.8%) | 169 (2.8%) |
| $5,000 to $7,499 | 63 (0.9%) | 438 (7.2%) |
| $7,500 to $9,999 | 234 (3.1%) | 379 (6.2%) |
| $10,000 to $12,499 | 126 (1.7%) | 278 (4.5%) |
| $12,500 to $14,999 | 100 (1.3%) | 223 (3.6%) |
| $15,000 to $17,499 | 92 (1.2%) | 141 (2.3%) |
| $17,500 to $19,999 | 60 (0.8%) | 141 (2.3%) |
| $20,000 to $22,499 | 153 (2.1%) | 223 (3.6%) |
| $22,500 to $24,999 | 163 (2.2%) | 210 (3.4%) |
| $25,000 to $29,999 | 373 (5.0%) | 259 (4.2%) |
| $30,000 to $34,999 | 455 (6.1%) | 502 (8.2%) |
| $35,000 to $39,999 | 256 (3.4%) | 231 (3.8%) |
| $40,000 to $44,999 | 394 (5.3%) | 309 (5.1%) |
| $45,000 to $49,999 | 223 (3.0%) | 287 (4.7%) |
| $50,000 to $54,999 | 367 (4.9%) | 310 (5.1%) |
| $55,000 to $64,999 | 572 (7.7%) | 505 (8.3%) |
| $65,000 to $74,999 | 686 (9.2%) | 402 (6.6%) |
| $75,000 to $99,999 | 1,083 (14.5%) | 426 (7.0%) |
| $100,000+ | 1,549 (20.8%) | 375 (6.1%) |
| Total | 7,442 (100.0%) | 6,108 (100.0%) |
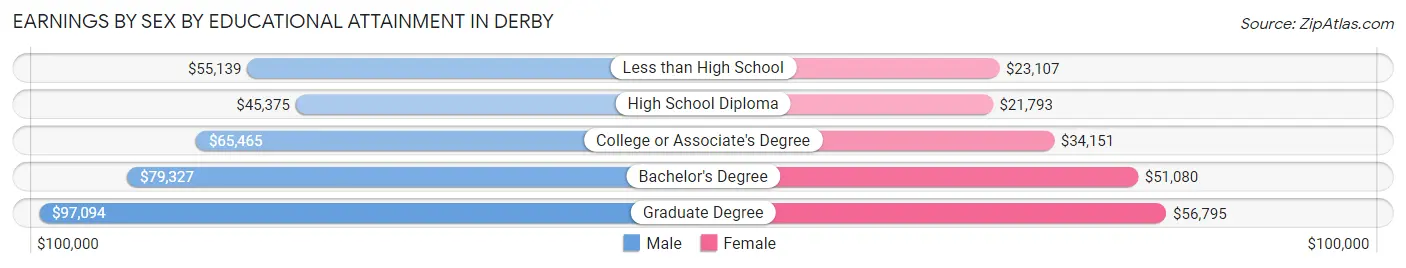
Earnings by Sex by Educational Attainment in Derby
Average earnings in Derby are $67,573 for men and $37,300 for women, a difference of 44.8%. Men with an educational attainment of graduate degree enjoy the highest average annual earnings of $97,094, while those with high school diploma education earn the least with $45,375. Women with an educational attainment of graduate degree earn the most with the average annual earnings of $56,795, while those with high school diploma education have the smallest earnings of $21,793.
| Educational Attainment | Male Income | Female Income |
| Less than High School | $55,139 | $23,107 |
| High School Diploma | $45,375 | $21,793 |
| College or Associate's Degree | $65,465 | $34,151 |
| Bachelor's Degree | $79,327 | $51,080 |
| Graduate Degree | $97,094 | $56,795 |
| Total | $67,573 | $37,300 |
Family Income in Derby
Family Income Brackets in Derby
According to the Derby family income data, there are 1,648 families falling into the $100,000 to $149,999 income range, which is the most common income bracket and makes up 24.6% of all families. Conversely, the $10,000 to $14,999 income bracket is the least frequent group with only 87 families (1.3%) belonging to this category.
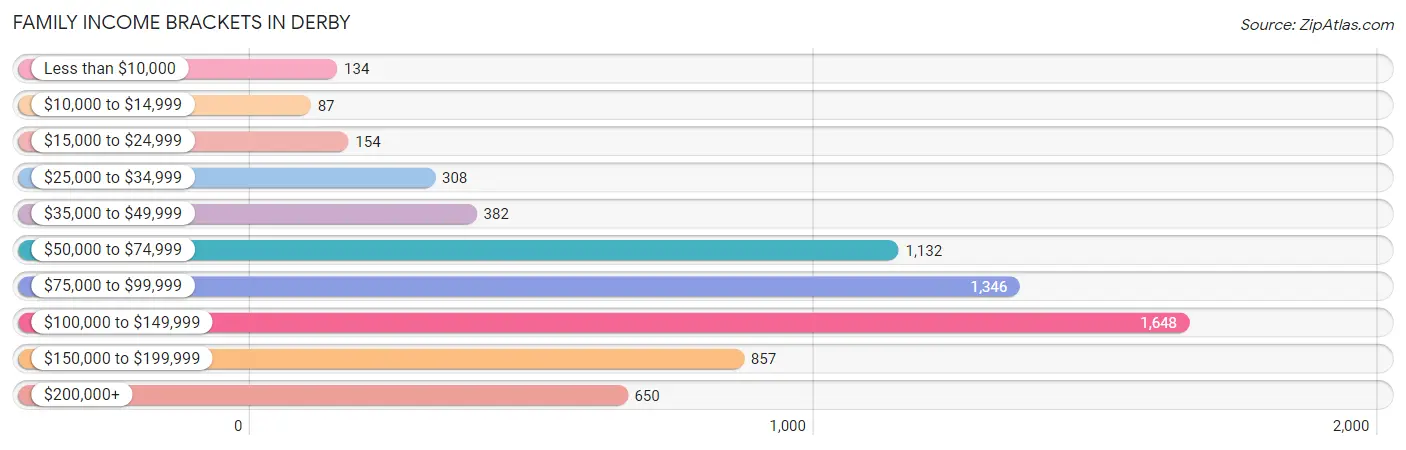
| Income Bracket | # Families | % Families |
| Less than $10,000 | 134 | 2.0% |
| $10,000 to $14,999 | 87 | 1.3% |
| $15,000 to $24,999 | 154 | 2.3% |
| $25,000 to $34,999 | 308 | 4.6% |
| $35,000 to $49,999 | 382 | 5.7% |
| $50,000 to $74,999 | 1,132 | 16.9% |
| $75,000 to $99,999 | 1,346 | 20.1% |
| $100,000 to $149,999 | 1,648 | 24.6% |
| $150,000 to $199,999 | 857 | 12.8% |
| $200,000+ | 650 | 9.7% |
Family Income by Famaliy Size in Derby
7+ person families (116 | 1.7%) account for the highest median family income in Derby with $163,203 per family, while 2-person families (3,320 | 49.6%) have the highest median income of $41,058 per family member.
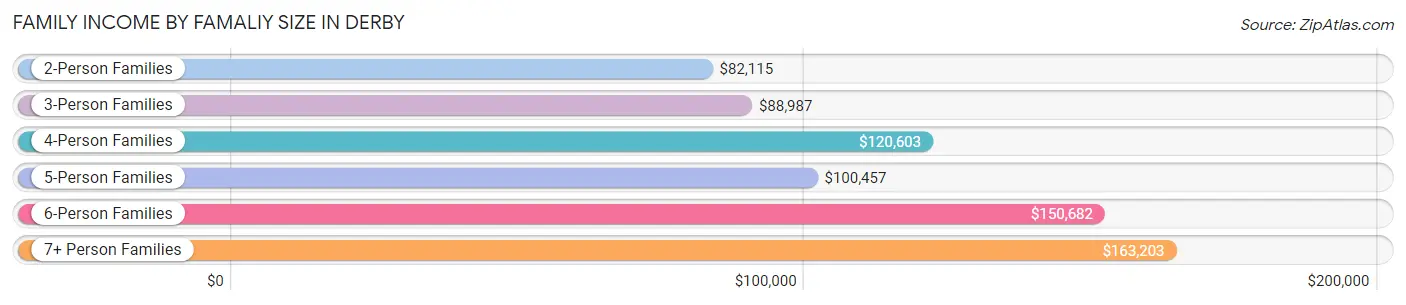
| Income Bracket | # Families | Median Income |
| 2-Person Families | 3,320 (49.6%) | $82,115 |
| 3-Person Families | 1,095 (16.4%) | $88,987 |
| 4-Person Families | 1,259 (18.8%) | $120,603 |
| 5-Person Families | 597 (8.9%) | $100,457 |
| 6-Person Families | 312 (4.7%) | $150,682 |
| 7+ Person Families | 116 (1.7%) | $163,203 |
| Total | 6,699 (100.0%) | $93,991 |
Family Income by Number of Earners in Derby
The median family income in Derby is $93,991, with families comprising 3+ earners (779) having the highest median family income of $144,264, while families with no earners (1,124) have the lowest median family income of $72,700, accounting for 11.6% and 16.8% of families, respectively.
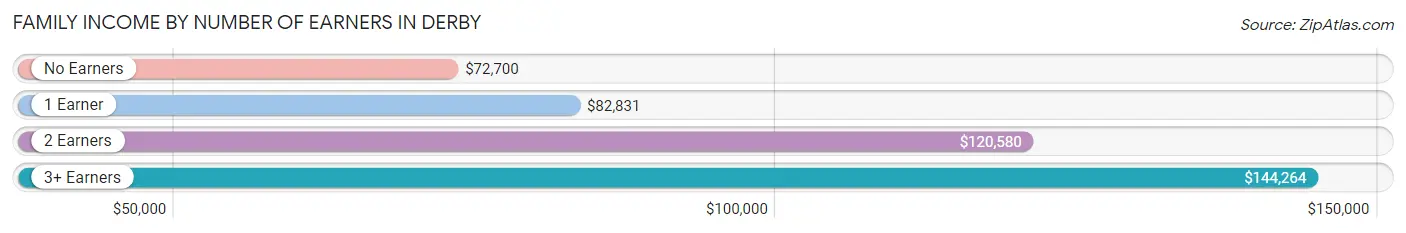
| Number of Earners | # Families | Median Income |
| No Earners | 1,124 (16.8%) | $72,700 |
| 1 Earner | 1,769 (26.4%) | $82,831 |
| 2 Earners | 3,027 (45.2%) | $120,580 |
| 3+ Earners | 779 (11.6%) | $144,264 |
| Total | 6,699 (100.0%) | $93,991 |
Household Income in Derby
Household Income Brackets in Derby
With 2,046 households falling in the category, the $100,000 to $149,999 income range is the most frequent in Derby, accounting for 20.4% of all households. In contrast, only 160 households (1.6%) fall into the $10,000 to $14,999 income bracket, making it the least populous group.
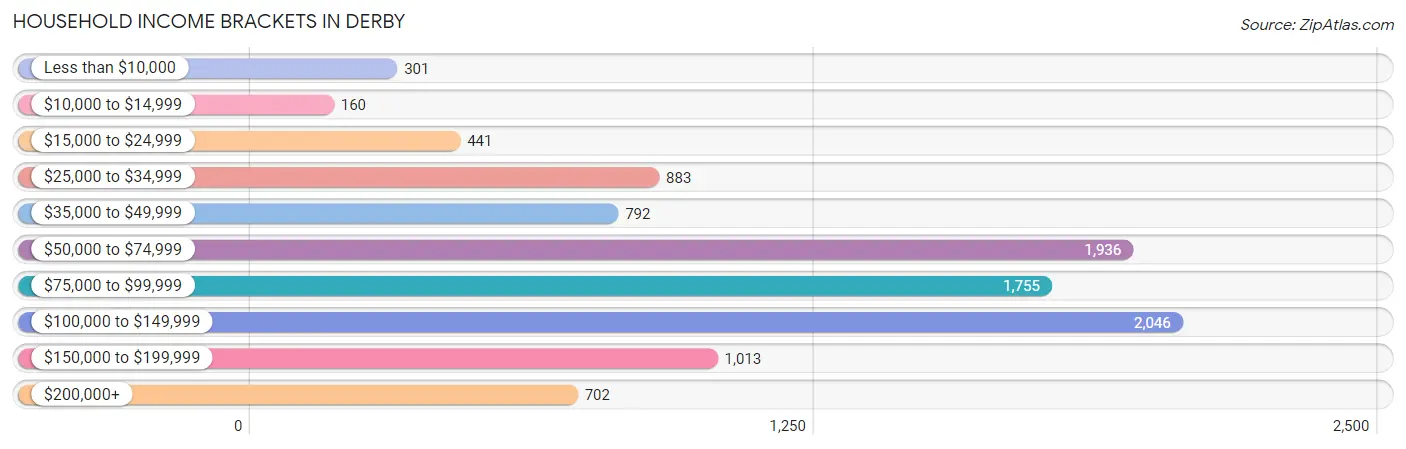
| Income Bracket | # Households | % Households |
| Less than $10,000 | 301 | 3.0% |
| $10,000 to $14,999 | 160 | 1.6% |
| $15,000 to $24,999 | 441 | 4.4% |
| $25,000 to $34,999 | 883 | 8.8% |
| $35,000 to $49,999 | 792 | 7.9% |
| $50,000 to $74,999 | 1,936 | 19.3% |
| $75,000 to $99,999 | 1,755 | 17.5% |
| $100,000 to $149,999 | 2,046 | 20.4% |
| $150,000 to $199,999 | 1,013 | 10.1% |
| $200,000+ | 702 | 7.0% |
Household Income by Householder Age in Derby
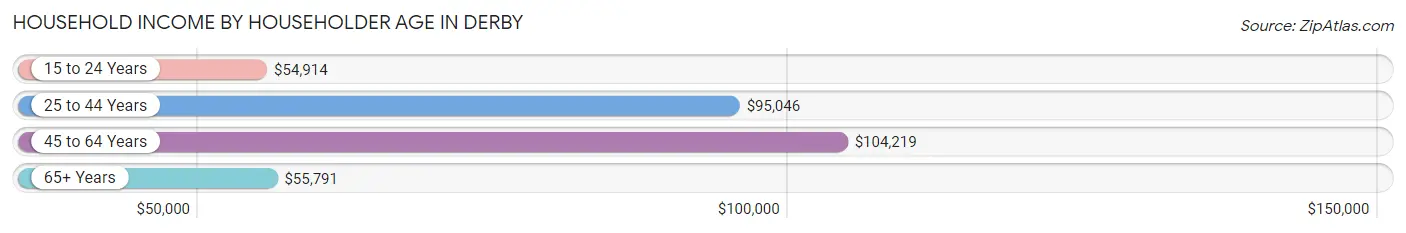
The median household income in Derby is $79,581, with the highest median household income of $104,219 found in the 45 to 64 years age bracket for the primary householder. A total of 3,287 households (32.8%) fall into this category. Meanwhile, the 15 to 24 years age bracket for the primary householder has the lowest median household income of $54,914, with 698 households (7.0%) in this group.
| Income Bracket | # Households | Median Income |
| 15 to 24 Years | 698 (7.0%) | $54,914 |
| 25 to 44 Years | 3,420 (34.1%) | $95,046 |
| 45 to 64 Years | 3,287 (32.8%) | $104,219 |
| 65+ Years | 2,624 (26.2%) | $55,791 |
| Total | 10,029 (100.0%) | $79,581 |
Poverty in Derby
Income Below Poverty by Sex and Age in Derby
With 5.9% poverty level for males and 7.6% for females among the residents of Derby, 15 year old males and under 5 year old females are the most vulnerable to poverty, with 43 males (24.4%) and 100 females (16.0%) in their respective age groups living below the poverty level.
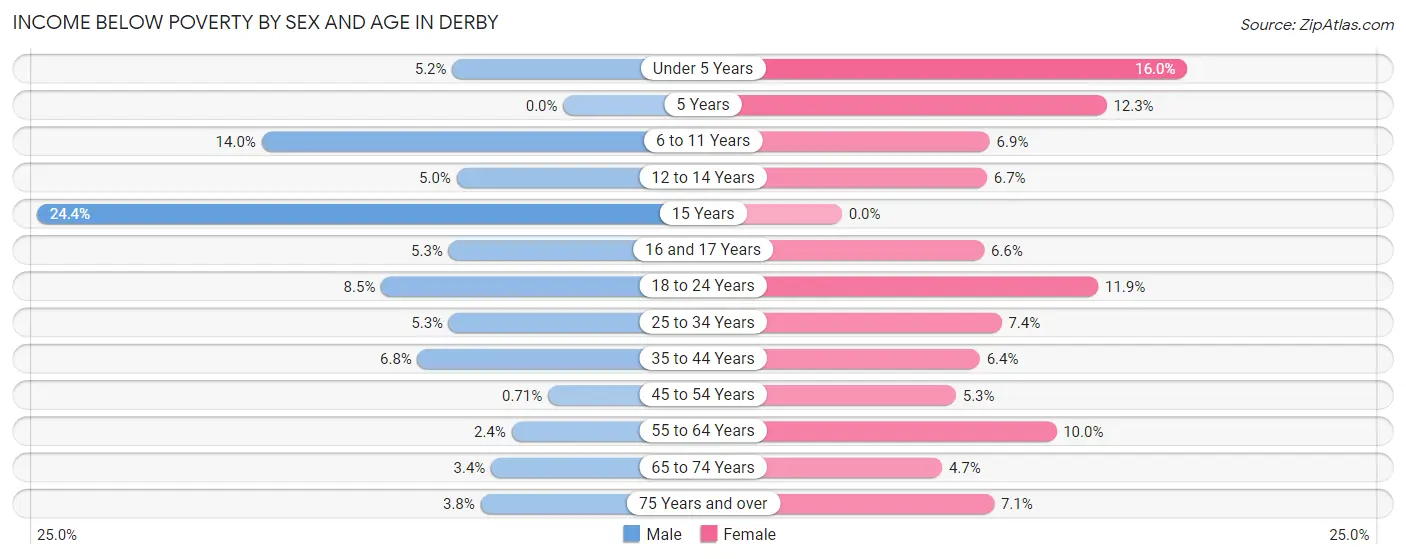
| Age Bracket | Male | Female |
| Under 5 Years | 44 (5.1%) | 100 (16.0%) |
| 5 Years | 0 (0.0%) | 7 (12.3%) |
| 6 to 11 Years | 195 (14.0%) | 98 (6.9%) |
| 12 to 14 Years | 27 (5.0%) | 46 (6.7%) |
| 15 Years | 43 (24.4%) | 0 (0.0%) |
| 16 and 17 Years | 25 (5.3%) | 25 (6.6%) |
| 18 to 24 Years | 118 (8.5%) | 104 (11.9%) |
| 25 to 34 Years | 82 (5.3%) | 120 (7.4%) |
| 35 to 44 Years | 115 (6.8%) | 123 (6.4%) |
| 45 to 54 Years | 11 (0.7%) | 56 (5.3%) |
| 55 to 64 Years | 31 (2.4%) | 155 (10.0%) |
| 65 to 74 Years | 28 (3.4%) | 49 (4.6%) |
| 75 Years and over | 29 (3.8%) | 86 (7.1%) |
| Total | 748 (5.9%) | 969 (7.6%) |
Income Above Poverty by Sex and Age in Derby
According to the poverty statistics in Derby, males aged 5 years and females aged 15 years are the age groups that are most secure financially, with 100.0% of males and 100.0% of females in these age groups living above the poverty line.
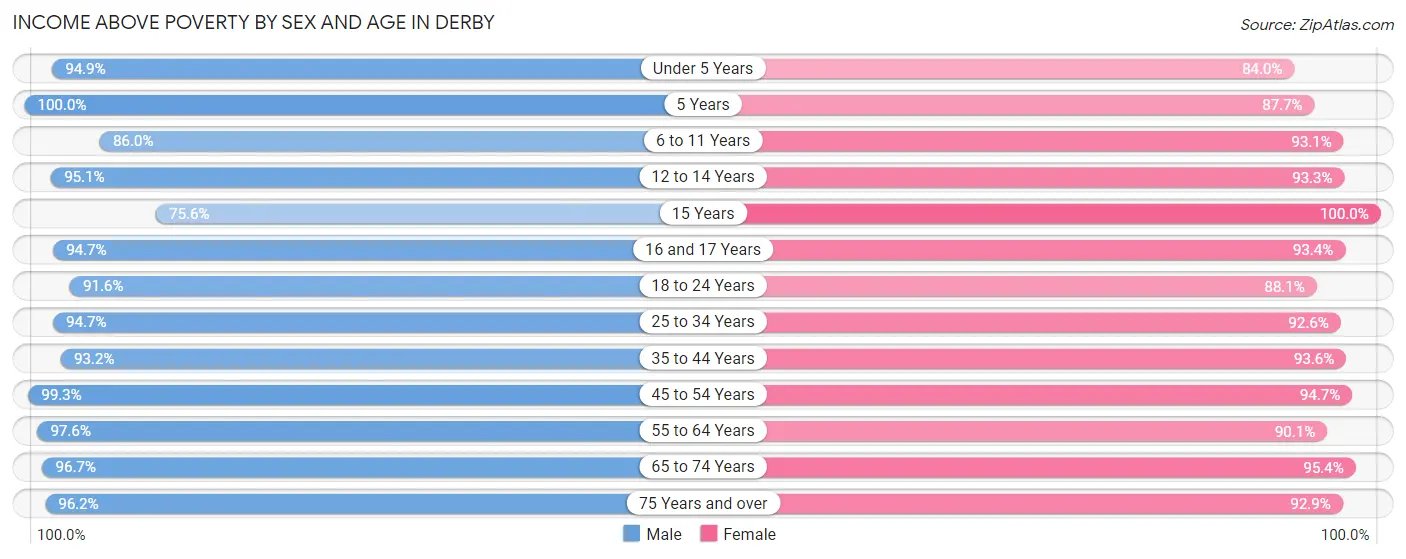
| Age Bracket | Male | Female |
| Under 5 Years | 810 (94.9%) | 524 (84.0%) |
| 5 Years | 185 (100.0%) | 50 (87.7%) |
| 6 to 11 Years | 1,198 (86.0%) | 1,330 (93.1%) |
| 12 to 14 Years | 519 (95.1%) | 638 (93.3%) |
| 15 Years | 133 (75.6%) | 228 (100.0%) |
| 16 and 17 Years | 445 (94.7%) | 354 (93.4%) |
| 18 to 24 Years | 1,278 (91.5%) | 771 (88.1%) |
| 25 to 34 Years | 1,461 (94.7%) | 1,500 (92.6%) |
| 35 to 44 Years | 1,585 (93.2%) | 1,798 (93.6%) |
| 45 to 54 Years | 1,540 (99.3%) | 1,002 (94.7%) |
| 55 to 64 Years | 1,262 (97.6%) | 1,403 (90.0%) |
| 65 to 74 Years | 808 (96.7%) | 1,005 (95.4%) |
| 75 Years and over | 727 (96.2%) | 1,132 (92.9%) |
| Total | 11,951 (94.1%) | 11,735 (92.4%) |
Income Below Poverty Among Married-Couple Families in Derby
The poverty statistics for married-couple families in Derby show that 3.1% or 172 of the total 5,469 families live below the poverty line. Families with 3 or 4 children have the highest poverty rate of 10.8%, comprising of 73 families. On the other hand, families with 5 or more children have the lowest poverty rate of 0.0%, which includes 0 families.
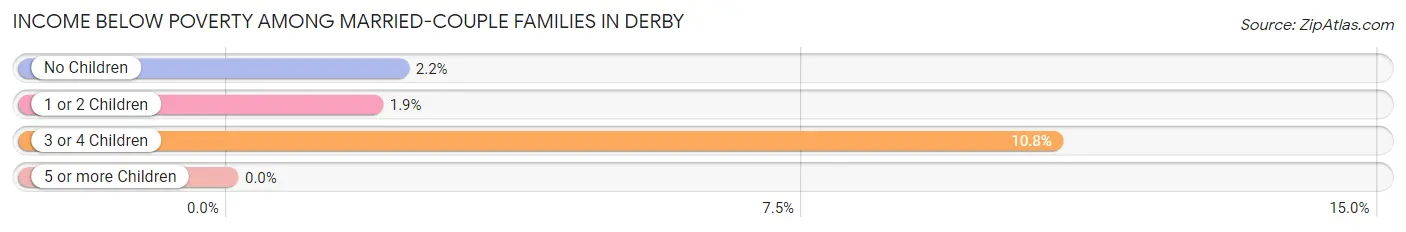
| Children | Above Poverty | Below Poverty |
| No Children | 2,933 (97.8%) | 67 (2.2%) |
| 1 or 2 Children | 1,662 (98.1%) | 32 (1.9%) |
| 3 or 4 Children | 604 (89.2%) | 73 (10.8%) |
| 5 or more Children | 98 (100.0%) | 0 (0.0%) |
| Total | 5,297 (96.9%) | 172 (3.1%) |
Income Below Poverty Among Single-Parent Households in Derby
According to the poverty data in Derby, 8.2% or 27 single-father households and 24.6% or 221 single-mother households are living below the poverty line. Among single-father households, those with 3 or 4 children have the highest poverty rate, with 16 households (23.2%) experiencing poverty. Likewise, among single-mother households, those with 3 or 4 children have the highest poverty rate, with 10 households (37.0%) falling below the poverty line.
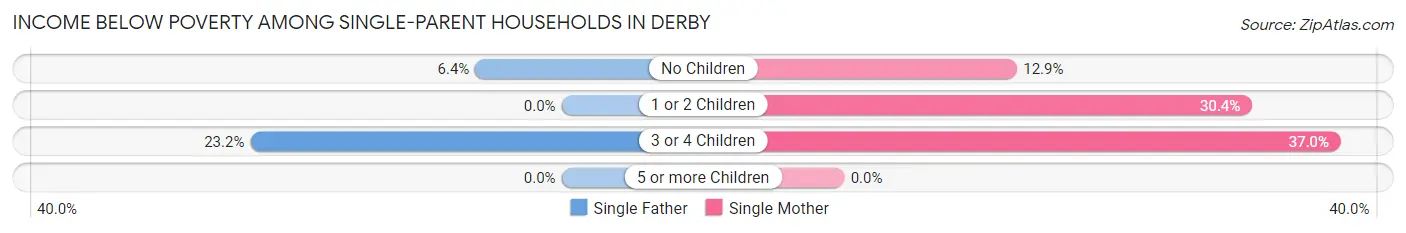
| Children | Single Father | Single Mother |
| No Children | 11 (6.4%) | 40 (12.9%) |
| 1 or 2 Children | 0 (0.0%) | 171 (30.4%) |
| 3 or 4 Children | 16 (23.2%) | 10 (37.0%) |
| 5 or more Children | 0 (0.0%) | 0 (0.0%) |
| Total | 27 (8.2%) | 221 (24.6%) |
Income Below Poverty Among Married-Couple vs Single-Parent Households in Derby
The poverty data for Derby shows that 172 of the married-couple family households (3.1%) and 248 of the single-parent households (20.2%) are living below the poverty level. Within the married-couple family households, those with 3 or 4 children have the highest poverty rate, with 73 households (10.8%) falling below the poverty line. Among the single-parent households, those with 3 or 4 children have the highest poverty rate, with 26 household (27.1%) living below poverty.
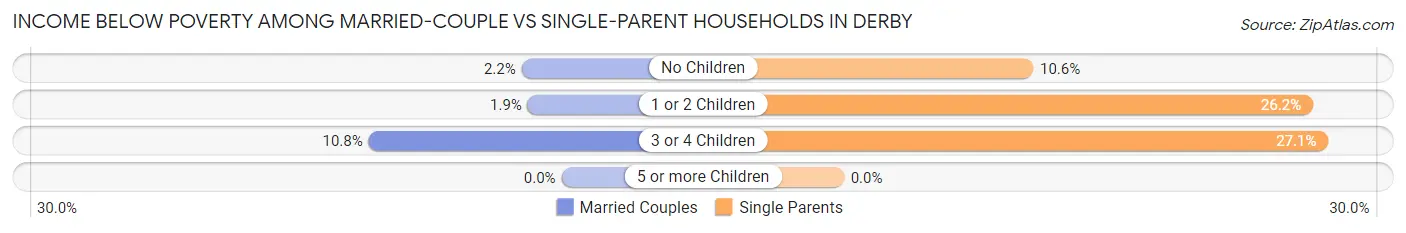
| Children | Married-Couple Families | Single-Parent Households |
| No Children | 67 (2.2%) | 51 (10.6%) |
| 1 or 2 Children | 32 (1.9%) | 171 (26.2%) |
| 3 or 4 Children | 73 (10.8%) | 26 (27.1%) |
| 5 or more Children | 0 (0.0%) | 0 (0.0%) |
| Total | 172 (3.1%) | 248 (20.2%) |
Race in Derby
The most populous races in Derby are White / Caucasian (21,128 | 82.7%), Hispanic or Latino (2,777 | 10.9%), and Two or more Races (2,387 | 9.3%).
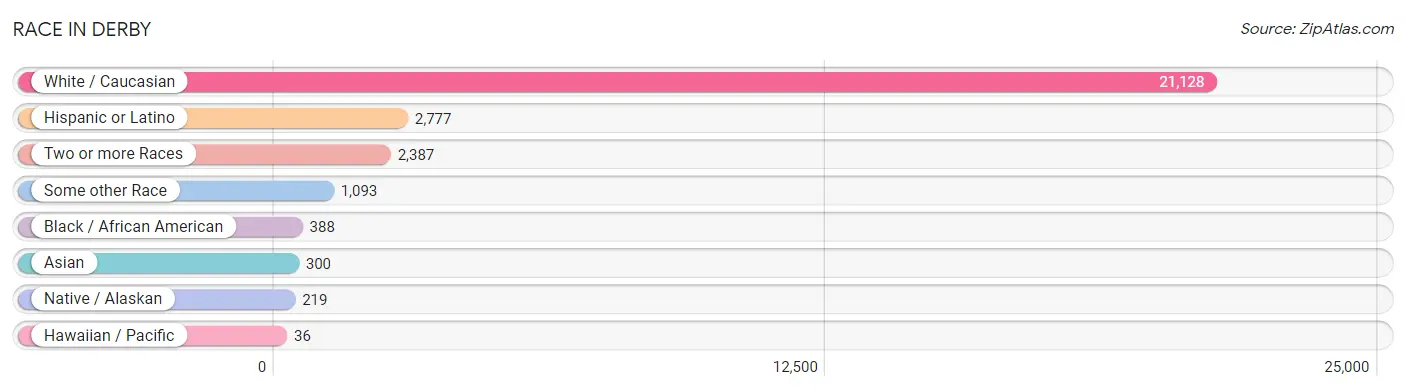
| Race | # Population | % Population |
| Asian | 300 | 1.2% |
| Black / African American | 388 | 1.5% |
| Hawaiian / Pacific | 36 | 0.1% |
| Hispanic or Latino | 2,777 | 10.9% |
| Native / Alaskan | 219 | 0.9% |
| White / Caucasian | 21,128 | 82.7% |
| Two or more Races | 2,387 | 9.3% |
| Some other Race | 1,093 | 4.3% |
| Total | 25,551 | 100.0% |
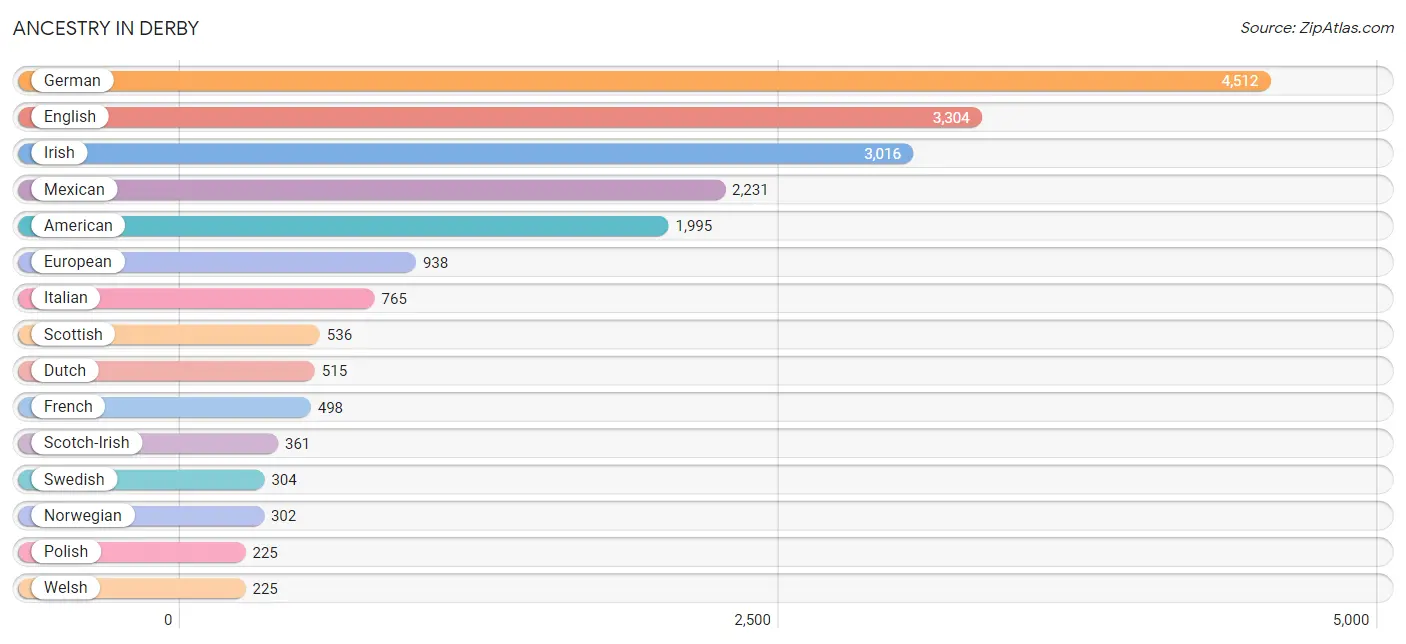
Ancestry in Derby
The most populous ancestries reported in Derby are German (4,512 | 17.7%), English (3,304 | 12.9%), Irish (3,016 | 11.8%), Mexican (2,231 | 8.7%), and American (1,995 | 7.8%), together accounting for 58.9% of all Derby residents.
| Ancestry | # Population | % Population |
| African | 76 | 0.3% |
| American | 1,995 | 7.8% |
| Arab | 28 | 0.1% |
| Arapaho | 43 | 0.2% |
| Australian | 77 | 0.3% |
| Austrian | 137 | 0.5% |
| Belizean | 16 | 0.1% |
| Bhutanese | 206 | 0.8% |
| Blackfeet | 1 | 0.0% |
| British | 186 | 0.7% |
| Burmese | 109 | 0.4% |
| Canadian | 58 | 0.2% |
| Central American | 42 | 0.2% |
| Central American Indian | 22 | 0.1% |
| Cherokee | 172 | 0.7% |
| Costa Rican | 42 | 0.2% |
| Creek | 133 | 0.5% |
| Cuban | 8 | 0.0% |
| Czech | 115 | 0.4% |
| Czechoslovakian | 24 | 0.1% |
| Danish | 71 | 0.3% |
| Delaware | 32 | 0.1% |
| Dutch | 515 | 2.0% |
| Eastern European | 18 | 0.1% |
| Egyptian | 19 | 0.1% |
| English | 3,304 | 12.9% |
| European | 938 | 3.7% |
| Finnish | 9 | 0.0% |
| French | 498 | 1.9% |
| French Canadian | 6 | 0.0% |
| German | 4,512 | 17.7% |
| Greek | 16 | 0.1% |
| Hungarian | 58 | 0.2% |
| Indian (Asian) | 46 | 0.2% |
| Iranian | 45 | 0.2% |
| Irish | 3,016 | 11.8% |
| Italian | 765 | 3.0% |
| Japanese | 71 | 0.3% |
| Korean | 119 | 0.5% |
| Lebanese | 9 | 0.0% |
| Malaysian | 80 | 0.3% |
| Mexican | 2,231 | 8.7% |
| Mexican American Indian | 1 | 0.0% |
| Native Hawaiian | 18 | 0.1% |
| Nigerian | 1 | 0.0% |
| Northern European | 31 | 0.1% |
| Norwegian | 302 | 1.2% |
| Okinawan | 15 | 0.1% |
| Osage | 15 | 0.1% |
| Pakistani | 17 | 0.1% |
| Paraguayan | 6 | 0.0% |
| Polish | 225 | 0.9% |
| Portuguese | 9 | 0.0% |
| Potawatomi | 10 | 0.0% |
| Puerto Rican | 212 | 0.8% |
| Russian | 83 | 0.3% |
| Samoan | 46 | 0.2% |
| Scandinavian | 99 | 0.4% |
| Scotch-Irish | 361 | 1.4% |
| Scottish | 536 | 2.1% |
| Seminole | 18 | 0.1% |
| South American | 6 | 0.0% |
| Spaniard | 22 | 0.1% |
| Spanish | 141 | 0.5% |
| Spanish American | 78 | 0.3% |
| Sri Lankan | 179 | 0.7% |
| Subsaharan African | 77 | 0.3% |
| Swedish | 304 | 1.2% |
| Swiss | 102 | 0.4% |
| Thai | 141 | 0.5% |
| Ukrainian | 6 | 0.0% |
| Welsh | 225 | 0.9% | View All 72 Rows |
Immigrants in Derby
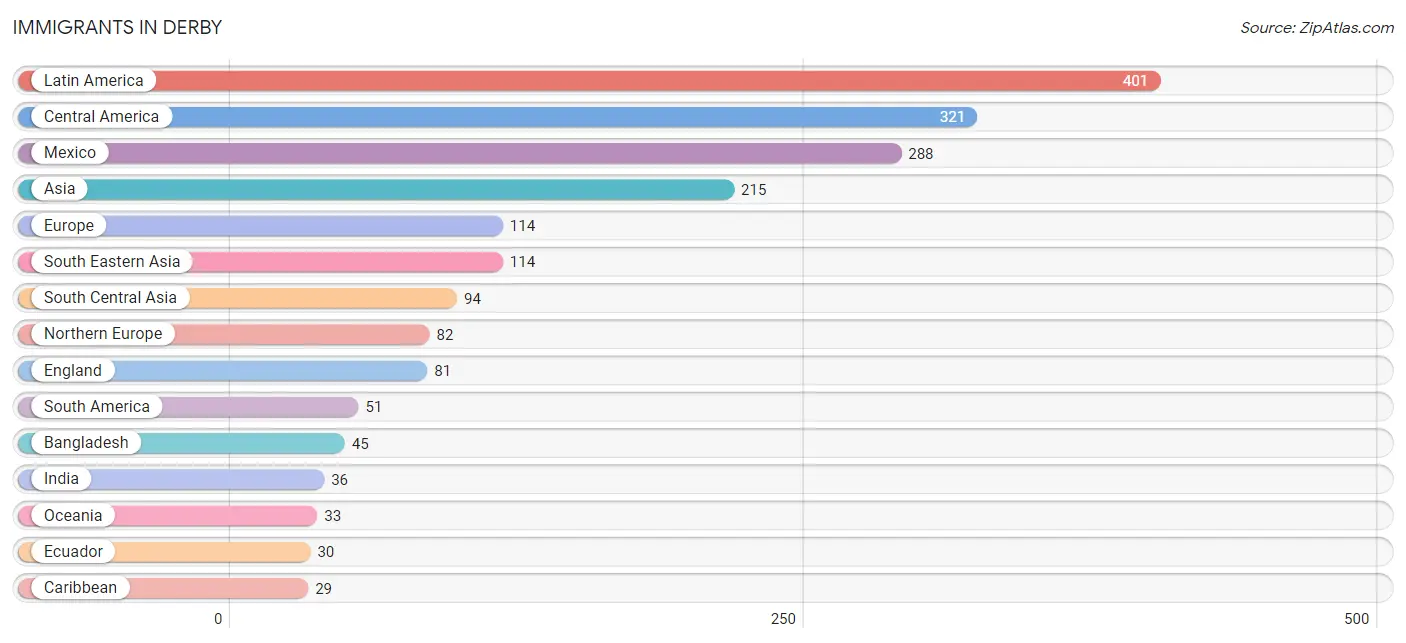
The most numerous immigrant groups reported in Derby came from Latin America (401 | 1.6%), Central America (321 | 1.3%), Mexico (288 | 1.1%), Asia (215 | 0.8%), and Europe (114 | 0.4%), together accounting for 5.2% of all Derby residents.
| Immigration Origin | # Population | % Population |
| Africa | 19 | 0.1% |
| Asia | 215 | 0.8% |
| Bangladesh | 45 | 0.2% |
| Belize | 11 | 0.0% |
| Brazil | 15 | 0.1% |
| Cambodia | 10 | 0.0% |
| Canada | 6 | 0.0% |
| Caribbean | 29 | 0.1% |
| Central America | 321 | 1.3% |
| China | 7 | 0.0% |
| Costa Rica | 22 | 0.1% |
| Cuba | 29 | 0.1% |
| Eastern Asia | 7 | 0.0% |
| Eastern Europe | 6 | 0.0% |
| Ecuador | 30 | 0.1% |
| Egypt | 19 | 0.1% |
| England | 81 | 0.3% |
| Europe | 114 | 0.4% |
| Germany | 12 | 0.1% |
| India | 36 | 0.1% |
| Kazakhstan | 4 | 0.0% |
| Laos | 25 | 0.1% |
| Latin America | 401 | 1.6% |
| Mexico | 288 | 1.1% |
| Micronesia | 15 | 0.1% |
| Netherlands | 14 | 0.1% |
| Northern Africa | 19 | 0.1% |
| Northern Europe | 82 | 0.3% |
| Oceania | 33 | 0.1% |
| Pakistan | 9 | 0.0% |
| Philippines | 20 | 0.1% |
| Singapore | 15 | 0.1% |
| South America | 51 | 0.2% |
| South Central Asia | 94 | 0.4% |
| South Eastern Asia | 114 | 0.4% |
| Thailand | 24 | 0.1% |
| Ukraine | 6 | 0.0% |
| Vietnam | 20 | 0.1% |
| Western Europe | 26 | 0.1% | View All 39 Rows |
Sex and Age in Derby
Sex and Age in Derby
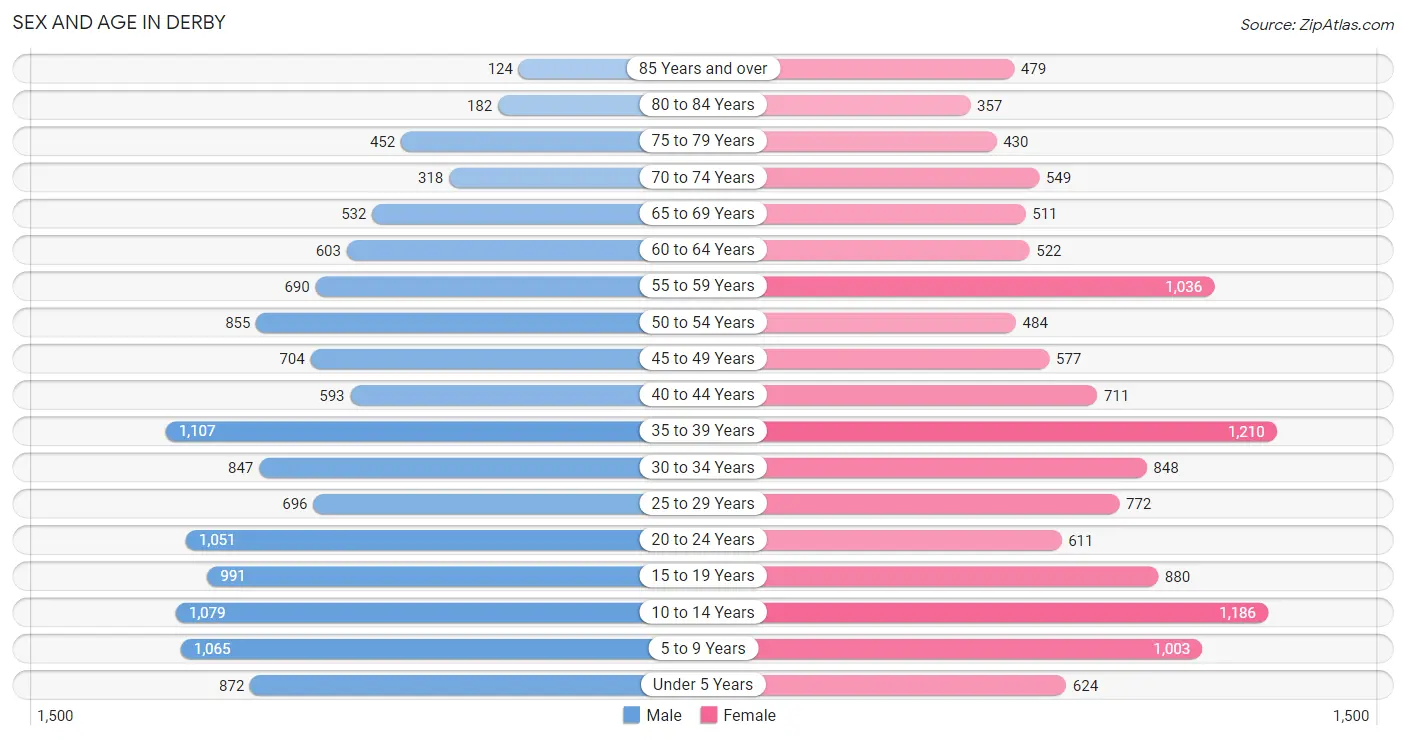
The most populous age groups in Derby are 35 to 39 Years (1,107 | 8.7%) for men and 35 to 39 Years (1,210 | 9.5%) for women.
| Age Bracket | Male | Female |
| Under 5 Years | 872 (6.8%) | 624 (4.9%) |
| 5 to 9 Years | 1,065 (8.4%) | 1,003 (7.8%) |
| 10 to 14 Years | 1,079 (8.5%) | 1,186 (9.3%) |
| 15 to 19 Years | 991 (7.8%) | 880 (6.9%) |
| 20 to 24 Years | 1,051 (8.2%) | 611 (4.8%) |
| 25 to 29 Years | 696 (5.4%) | 772 (6.0%) |
| 30 to 34 Years | 847 (6.6%) | 848 (6.6%) |
| 35 to 39 Years | 1,107 (8.7%) | 1,210 (9.5%) |
| 40 to 44 Years | 593 (4.6%) | 711 (5.6%) |
| 45 to 49 Years | 704 (5.5%) | 577 (4.5%) |
| 50 to 54 Years | 855 (6.7%) | 484 (3.8%) |
| 55 to 59 Years | 690 (5.4%) | 1,036 (8.1%) |
| 60 to 64 Years | 603 (4.7%) | 522 (4.1%) |
| 65 to 69 Years | 532 (4.2%) | 511 (4.0%) |
| 70 to 74 Years | 318 (2.5%) | 549 (4.3%) |
| 75 to 79 Years | 452 (3.5%) | 430 (3.4%) |
| 80 to 84 Years | 182 (1.4%) | 357 (2.8%) |
| 85 Years and over | 124 (1.0%) | 479 (3.7%) |
| Total | 12,761 (100.0%) | 12,790 (100.0%) |
Families and Households in Derby
Median Family Size in Derby
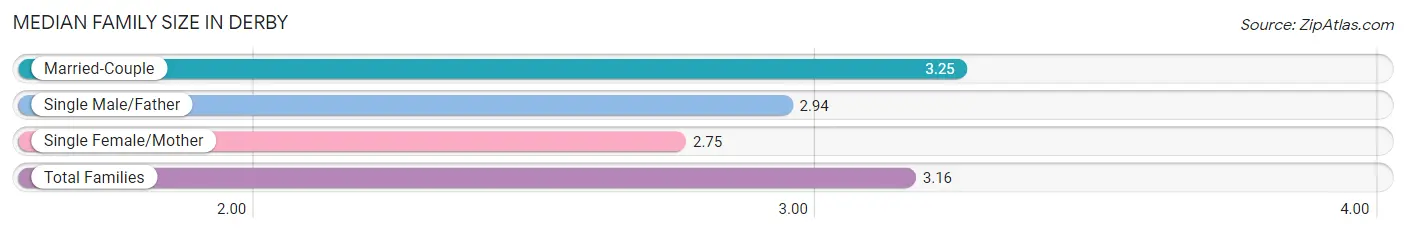
The median family size in Derby is 3.16 persons per family, with married-couple families (5,469 | 81.6%) accounting for the largest median family size of 3.25 persons per family. On the other hand, single female/mother families (900 | 13.4%) represent the smallest median family size with 2.75 persons per family.
| Family Type | # Families | Family Size |
| Married-Couple | 5,469 (81.6%) | 3.25 |
| Single Male/Father | 330 (4.9%) | 2.94 |
| Single Female/Mother | 900 (13.4%) | 2.75 |
| Total Families | 6,699 (100.0%) | 3.16 |
Median Household Size in Derby
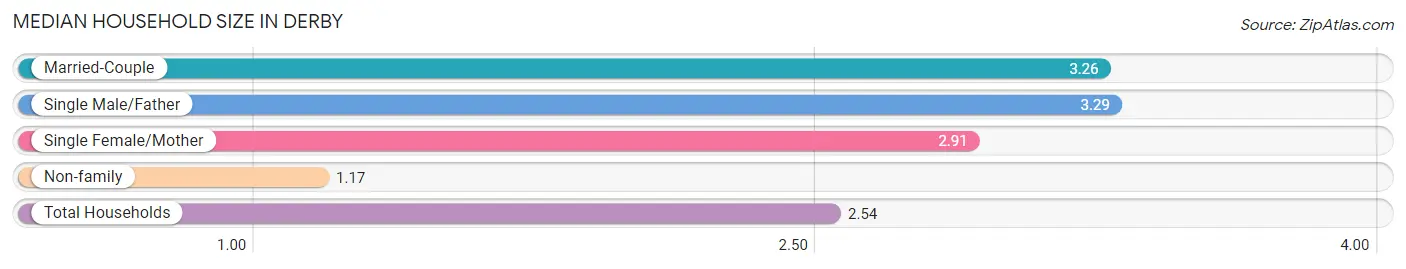
The median household size in Derby is 2.54 persons per household, with single male/father households (330 | 3.3%) accounting for the largest median household size of 3.29 persons per household. non-family households (3,330 | 33.2%) represent the smallest median household size with 1.17 persons per household.
| Household Type | # Households | Household Size |
| Married-Couple | 5,469 (54.5%) | 3.26 |
| Single Male/Father | 330 (3.3%) | 3.29 |
| Single Female/Mother | 900 (9.0%) | 2.91 |
| Non-family | 3,330 (33.2%) | 1.17 |
| Total Households | 10,029 (100.0%) | 2.54 |
Household Size by Marriage Status in Derby
Out of a total of 10,029 households in Derby, 6,699 (66.8%) are family households, while 3,330 (33.2%) are nonfamily households. The most numerous type of family households are 2-person households, comprising 3,162, and the most common type of nonfamily households are 1-person households, comprising 2,875.
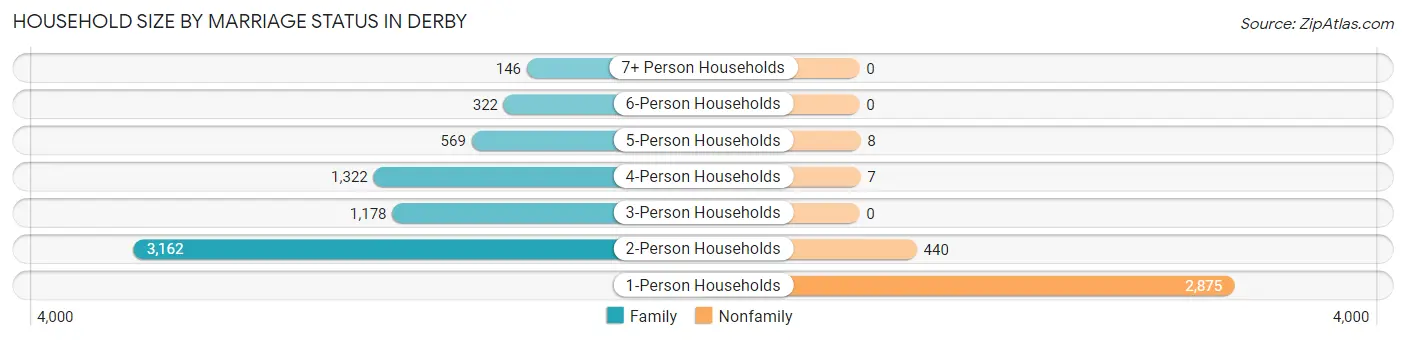
| Household Size | Family Households | Nonfamily Households |
| 1-Person Households | - | 2,875 (28.7%) |
| 2-Person Households | 3,162 (31.5%) | 440 (4.4%) |
| 3-Person Households | 1,178 (11.7%) | 0 (0.0%) |
| 4-Person Households | 1,322 (13.2%) | 7 (0.1%) |
| 5-Person Households | 569 (5.7%) | 8 (0.1%) |
| 6-Person Households | 322 (3.2%) | 0 (0.0%) |
| 7+ Person Households | 146 (1.5%) | 0 (0.0%) |
| Total | 6,699 (66.8%) | 3,330 (33.2%) |
Female Fertility in Derby
Fertility by Age in Derby
Average fertility rate in Derby is 45.0 births per 1,000 women. Women in the age bracket of 20 to 34 years have the highest fertility rate with 81.0 births per 1,000 women. Women in the age bracket of 20 to 34 years acount for 70.6% of all women with births.
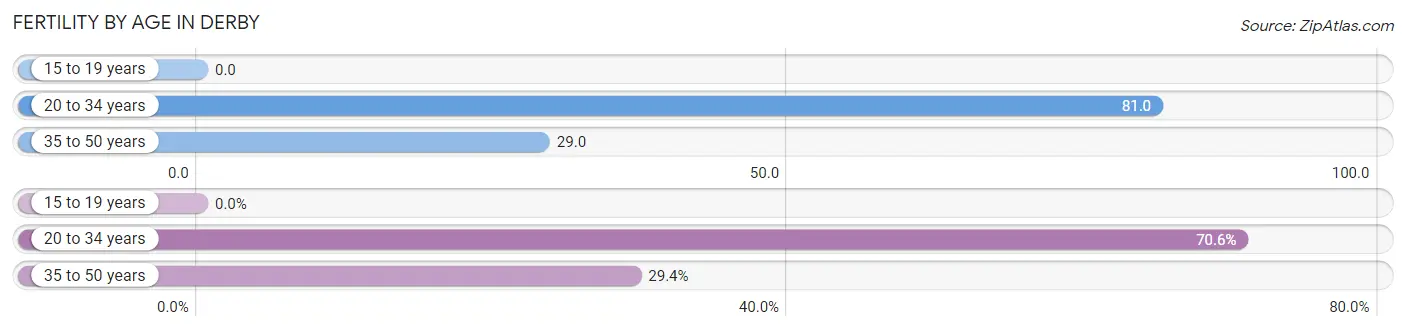
| Age Bracket | Women with Births | Births / 1,000 Women |
| 15 to 19 years | 0 (0.0%) | 0.0 |
| 20 to 34 years | 180 (70.6%) | 81.0 |
| 35 to 50 years | 75 (29.4%) | 29.0 |
| Total | 255 (100.0%) | 45.0 |
Fertility by Age by Marriage Status in Derby
86.3% of women with births (255) in Derby are married. The highest percentage of unmarried women with births falls into 20 to 34 years age bracket with 13.9% of them unmarried at the time of birth, while the lowest percentage of unmarried women with births belong to 35 to 50 years age bracket with 13.3% of them unmarried.
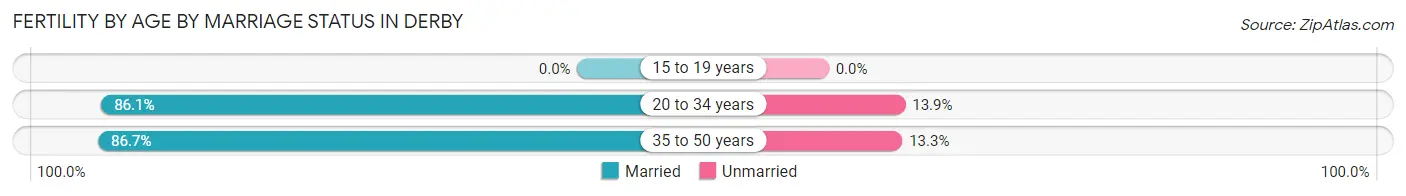
| Age Bracket | Married | Unmarried |
| 15 to 19 years | 0 (0.0%) | 0 (0.0%) |
| 20 to 34 years | 155 (86.1%) | 25 (13.9%) |
| 35 to 50 years | 65 (86.7%) | 10 (13.3%) |
| Total | 220 (86.3%) | 35 (13.7%) |
Fertility by Education in Derby
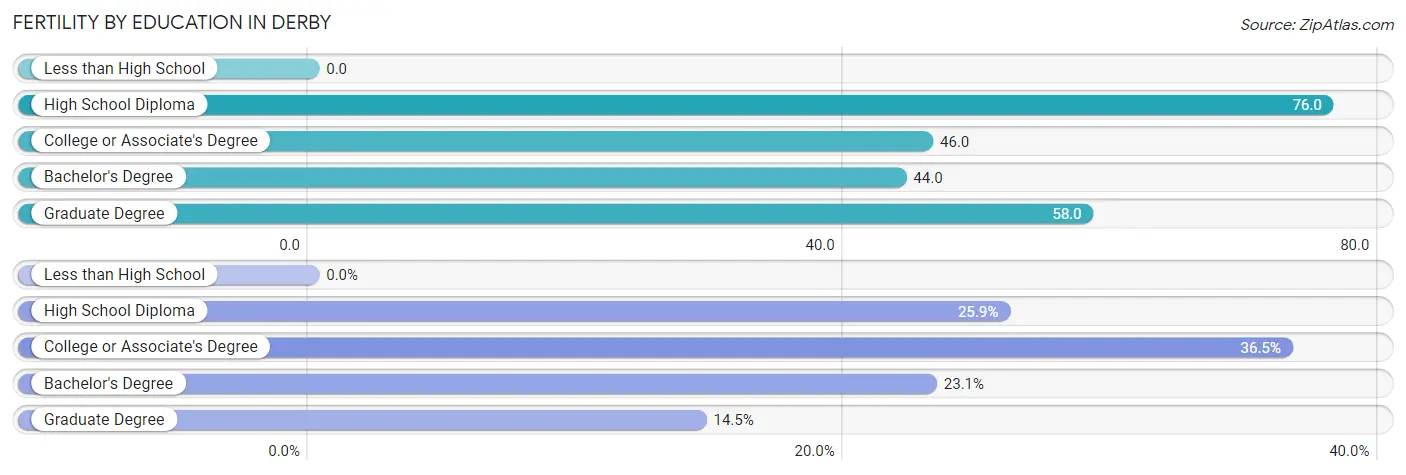
| Educational Attainment | Women with Births | Births / 1,000 Women |
| Less than High School | 0 (0.0%) | 0.0 |
| High School Diploma | 66 (25.9%) | 76.0 |
| College or Associate's Degree | 93 (36.5%) | 46.0 |
| Bachelor's Degree | 59 (23.1%) | 44.0 |
| Graduate Degree | 37 (14.5%) | 58.0 |
| Total | 255 (100.0%) | 45.0 |
Fertility by Education by Marriage Status in Derby
13.7% of women with births in Derby are unmarried. Women with the educational attainment of graduate degree are most likely to be married with 100.0% of them married at childbirth, while women with the educational attainment of high school diploma are least likely to be married with 22.7% of them unmarried at childbirth.
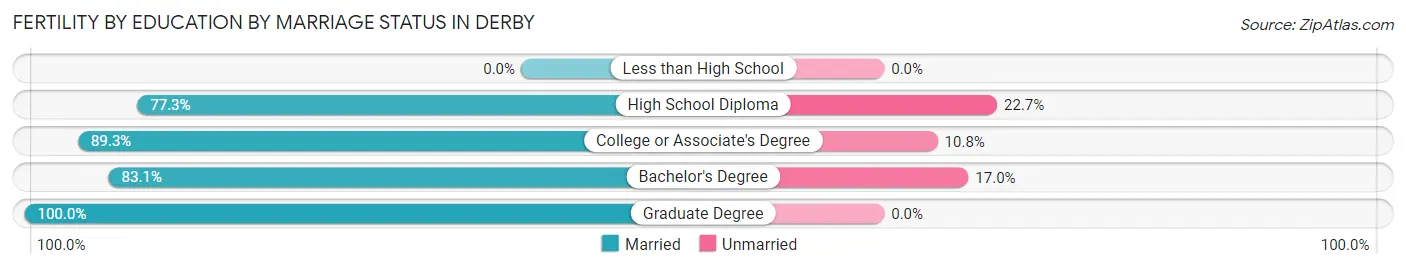
| Educational Attainment | Married | Unmarried |
| Less than High School | 0 (0.0%) | 0 (0.0%) |
| High School Diploma | 51 (77.3%) | 15 (22.7%) |
| College or Associate's Degree | 83 (89.2%) | 10 (10.7%) |
| Bachelor's Degree | 49 (83.1%) | 10 (17.0%) |
| Graduate Degree | 37 (100.0%) | 0 (0.0%) |
| Total | 220 (86.3%) | 35 (13.7%) |
Employment Characteristics in Derby
Employment by Class of Employer in Derby
Among the 12,311 employed individuals in Derby, private company employees (8,059 | 65.5%), federal government employees (1,216 | 9.9%), and local government employees (951 | 7.7%) make up the most common classes of employment.
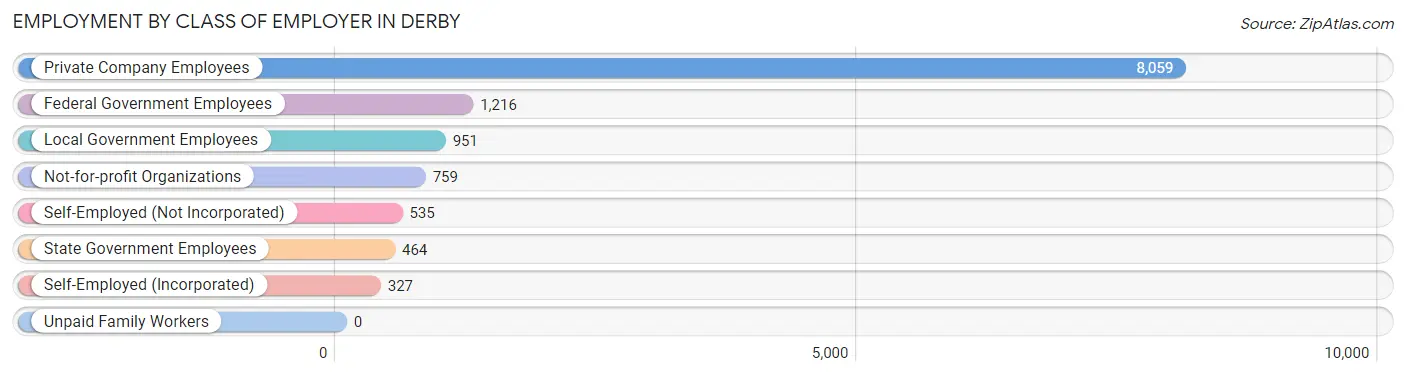
| Employer Class | # Employees | % Employees |
| Private Company Employees | 8,059 | 65.5% |
| Self-Employed (Incorporated) | 327 | 2.7% |
| Self-Employed (Not Incorporated) | 535 | 4.3% |
| Not-for-profit Organizations | 759 | 6.2% |
| Local Government Employees | 951 | 7.7% |
| State Government Employees | 464 | 3.8% |
| Federal Government Employees | 1,216 | 9.9% |
| Unpaid Family Workers | 0 | 0.0% |
| Total | 12,311 | 100.0% |
Employment Status by Age in Derby
According to the labor force statistics for Derby, out of the total population over 16 years of age (19,318), 67.1% or 12,962 individuals are in the labor force, with 4.0% or 518 of them unemployed. The age group with the highest labor force participation rate is 45 to 54 years, with 94.4% or 2,473 individuals in the labor force. Within the labor force, the 16 to 19 years age range has the highest percentage of unemployed individuals, with 8.9% or 80 of them being unemployed.
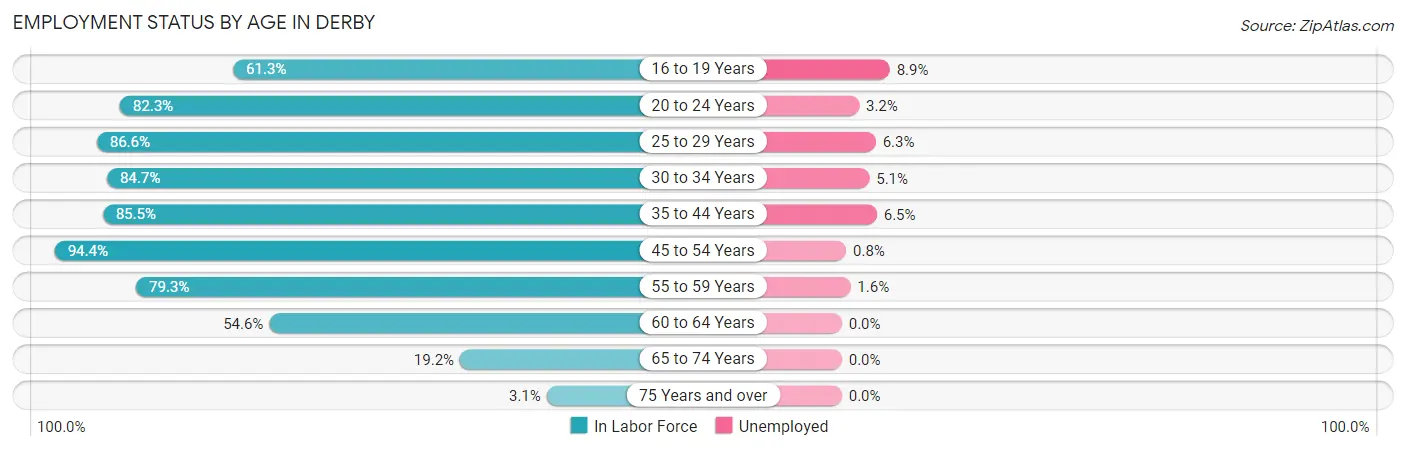
| Age Bracket | In Labor Force | Unemployed |
| 16 to 19 Years | 899 (61.3%) | 80 (8.9%) |
| 20 to 24 Years | 1,368 (82.3%) | 44 (3.2%) |
| 25 to 29 Years | 1,271 (86.6%) | 80 (6.3%) |
| 30 to 34 Years | 1,436 (84.7%) | 73 (5.1%) |
| 35 to 44 Years | 3,096 (85.5%) | 201 (6.5%) |
| 45 to 54 Years | 2,473 (94.4%) | 20 (0.8%) |
| 55 to 59 Years | 1,369 (79.3%) | 22 (1.6%) |
| 60 to 64 Years | 614 (54.6%) | 0 (0.0%) |
| 65 to 74 Years | 367 (19.2%) | 0 (0.0%) |
| 75 Years and over | 63 (3.1%) | 0 (0.0%) |
| Total | 12,962 (67.1%) | 518 (4.0%) |
Employment Status by Educational Attainment in Derby
According to labor force statistics for Derby, 83.7% of individuals (10,257) out of the total population between 25 and 64 years of age (12,255) are in the labor force, with 3.8% or 390 of them being unemployed. The group with the highest labor force participation rate are those with the educational attainment of bachelor's degree or higher, with 88.8% or 4,456 individuals in the labor force. Within the labor force, individuals with less than high school education have the highest percentage of unemployment, with 17.7% or 80 of them being unemployed.
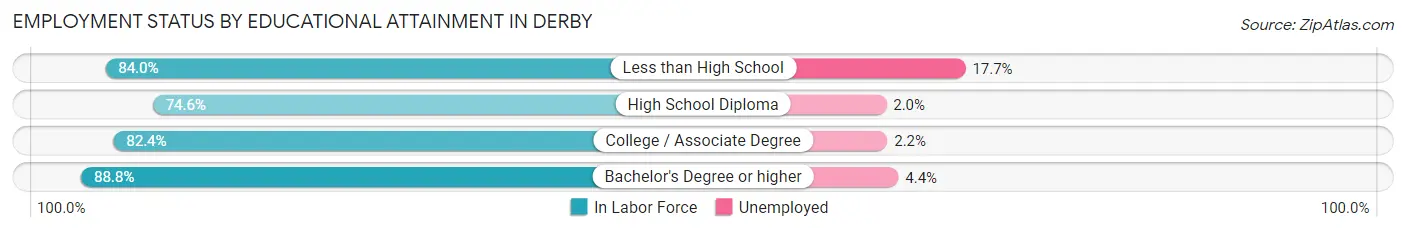
| Educational Attainment | In Labor Force | Unemployed |
| Less than High School | 452 (84.0%) | 95 (17.7%) |
| High School Diploma | 1,596 (74.6%) | 43 (2.0%) |
| College / Associate Degree | 3,757 (82.4%) | 100 (2.2%) |
| Bachelor's Degree or higher | 4,456 (88.8%) | 221 (4.4%) |
| Total | 10,257 (83.7%) | 466 (3.8%) |
Employment Occupations by Sex in Derby
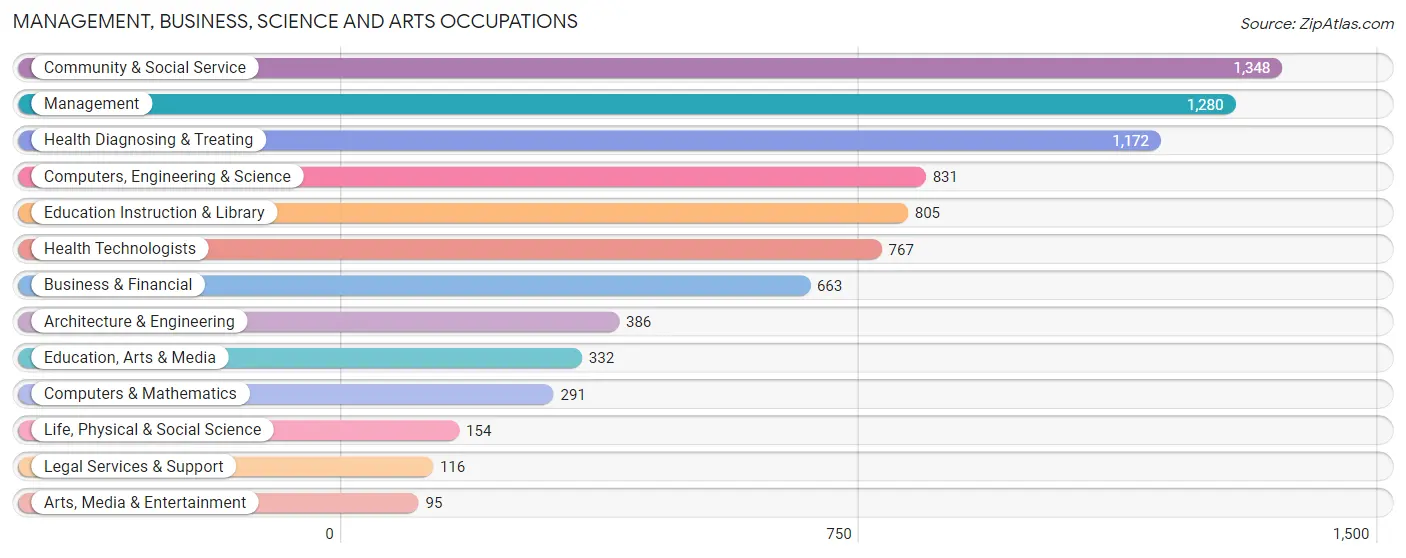
Management, Business, Science and Arts Occupations
The most common Management, Business, Science and Arts occupations in Derby are Community & Social Service (1,348 | 11.3%), Management (1,280 | 10.8%), Health Diagnosing & Treating (1,172 | 9.9%), Computers, Engineering & Science (831 | 7.0%), and Education Instruction & Library (805 | 6.8%).
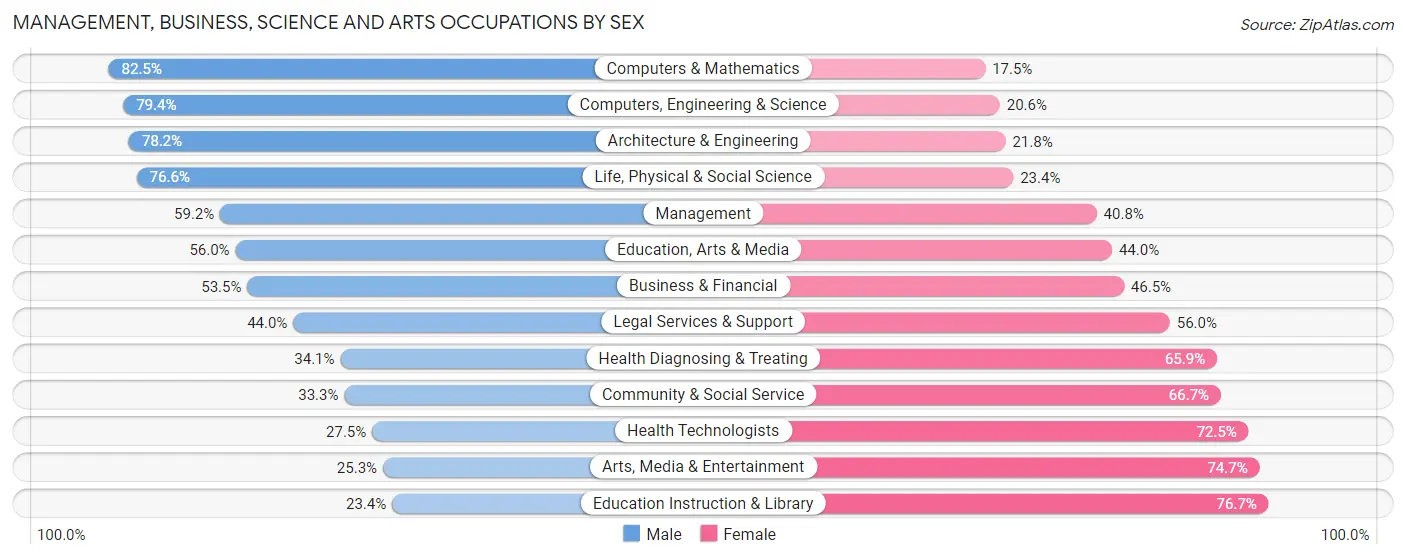
Management, Business, Science and Arts Occupations by Sex
Within the Management, Business, Science and Arts occupations in Derby, the most male-oriented occupations are Computers & Mathematics (82.5%), Computers, Engineering & Science (79.4%), and Architecture & Engineering (78.2%), while the most female-oriented occupations are Education Instruction & Library (76.6%), Arts, Media & Entertainment (74.7%), and Health Technologists (72.5%).
| Occupation | Male | Female |
| Management | 758 (59.2%) | 522 (40.8%) |
| Business & Financial | 355 (53.5%) | 308 (46.5%) |
| Computers, Engineering & Science | 660 (79.4%) | 171 (20.6%) |
| Computers & Mathematics | 240 (82.5%) | 51 (17.5%) |
| Architecture & Engineering | 302 (78.2%) | 84 (21.8%) |
| Life, Physical & Social Science | 118 (76.6%) | 36 (23.4%) |
| Community & Social Service | 449 (33.3%) | 899 (66.7%) |
| Education, Arts & Media | 186 (56.0%) | 146 (44.0%) |
| Legal Services & Support | 51 (44.0%) | 65 (56.0%) |
| Education Instruction & Library | 188 (23.4%) | 617 (76.6%) |
| Arts, Media & Entertainment | 24 (25.3%) | 71 (74.7%) |
| Health Diagnosing & Treating | 400 (34.1%) | 772 (65.9%) |
| Health Technologists | 211 (27.5%) | 556 (72.5%) |
| Total (Category) | 2,622 (49.5%) | 2,672 (50.5%) |
| Total (Overall) | 6,341 (53.3%) | 5,547 (46.7%) |
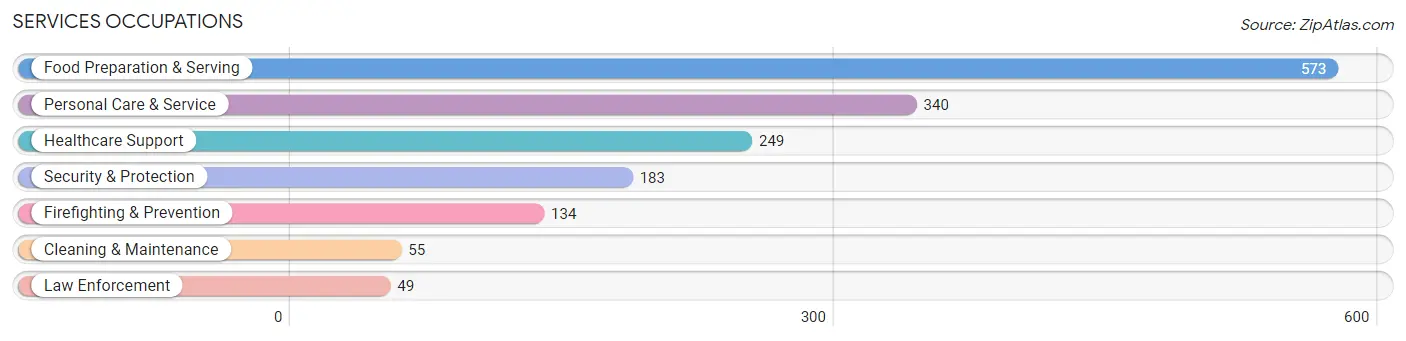
Services Occupations
The most common Services occupations in Derby are Food Preparation & Serving (573 | 4.8%), Personal Care & Service (340 | 2.9%), Healthcare Support (249 | 2.1%), Security & Protection (183 | 1.5%), and Firefighting & Prevention (134 | 1.1%).
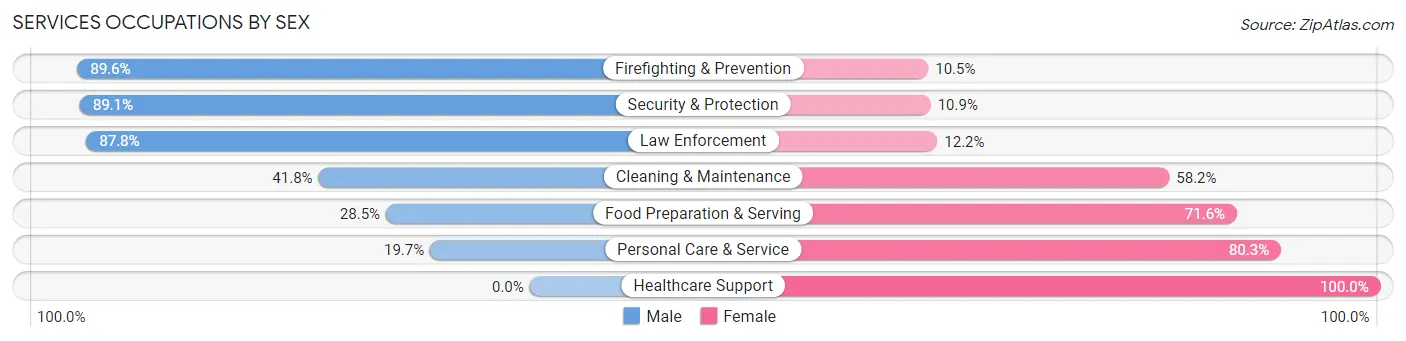
Services Occupations by Sex
Within the Services occupations in Derby, the most male-oriented occupations are Firefighting & Prevention (89.5%), Security & Protection (89.1%), and Law Enforcement (87.8%), while the most female-oriented occupations are Healthcare Support (100.0%), Personal Care & Service (80.3%), and Food Preparation & Serving (71.6%).
| Occupation | Male | Female |
| Healthcare Support | 0 (0.0%) | 249 (100.0%) |
| Security & Protection | 163 (89.1%) | 20 (10.9%) |
| Firefighting & Prevention | 120 (89.5%) | 14 (10.4%) |
| Law Enforcement | 43 (87.8%) | 6 (12.2%) |
| Food Preparation & Serving | 163 (28.4%) | 410 (71.6%) |
| Cleaning & Maintenance | 23 (41.8%) | 32 (58.2%) |
| Personal Care & Service | 67 (19.7%) | 273 (80.3%) |
| Total (Category) | 416 (29.7%) | 984 (70.3%) |
| Total (Overall) | 6,341 (53.3%) | 5,547 (46.7%) |
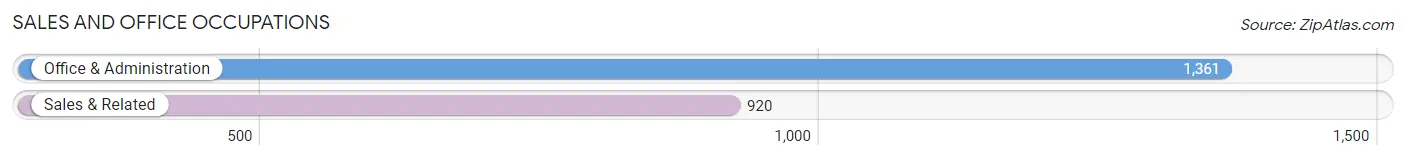
Sales and Office Occupations
The most common Sales and Office occupations in Derby are Office & Administration (1,361 | 11.5%), and Sales & Related (920 | 7.7%).
Sales and Office Occupations by Sex
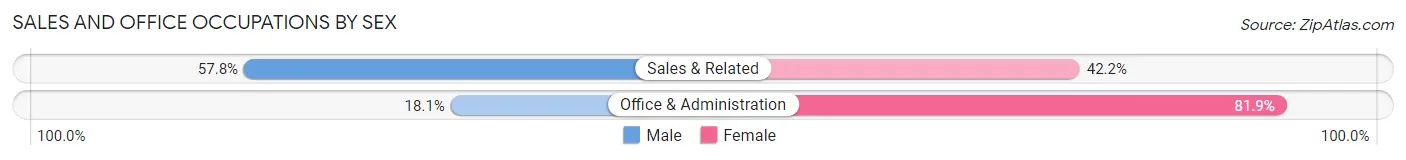
| Occupation | Male | Female |
| Sales & Related | 532 (57.8%) | 388 (42.2%) |
| Office & Administration | 246 (18.1%) | 1,115 (81.9%) |
| Total (Category) | 778 (34.1%) | 1,503 (65.9%) |
| Total (Overall) | 6,341 (53.3%) | 5,547 (46.7%) |
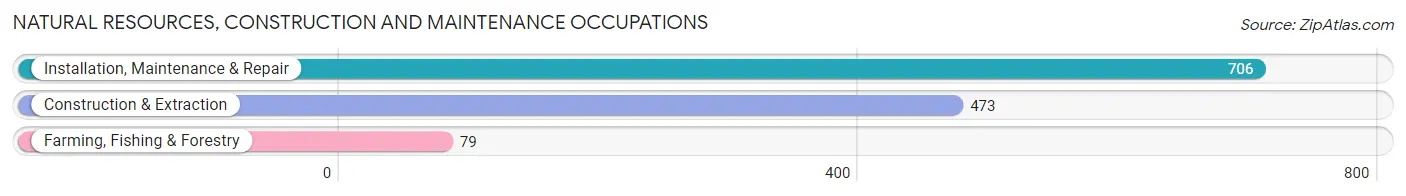
Natural Resources, Construction and Maintenance Occupations
The most common Natural Resources, Construction and Maintenance occupations in Derby are Installation, Maintenance & Repair (706 | 5.9%), Construction & Extraction (473 | 4.0%), and Farming, Fishing & Forestry (79 | 0.7%).
Natural Resources, Construction and Maintenance Occupations by Sex
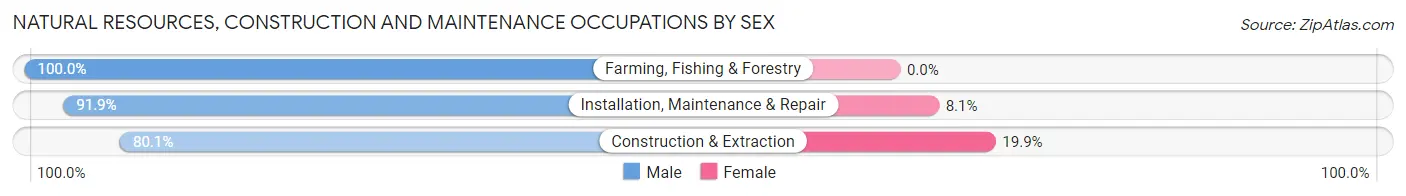
| Occupation | Male | Female |
| Farming, Fishing & Forestry | 79 (100.0%) | 0 (0.0%) |
| Construction & Extraction | 379 (80.1%) | 94 (19.9%) |
| Installation, Maintenance & Repair | 649 (91.9%) | 57 (8.1%) |
| Total (Category) | 1,107 (88.0%) | 151 (12.0%) |
| Total (Overall) | 6,341 (53.3%) | 5,547 (46.7%) |
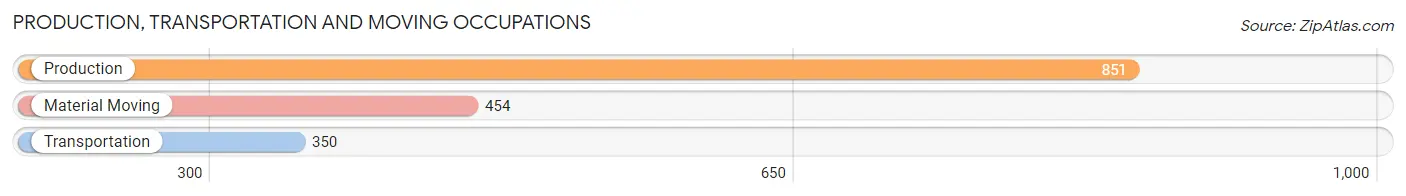
Production, Transportation and Moving Occupations
The most common Production, Transportation and Moving occupations in Derby are Production (851 | 7.2%), Material Moving (454 | 3.8%), and Transportation (350 | 2.9%).
Production, Transportation and Moving Occupations by Sex
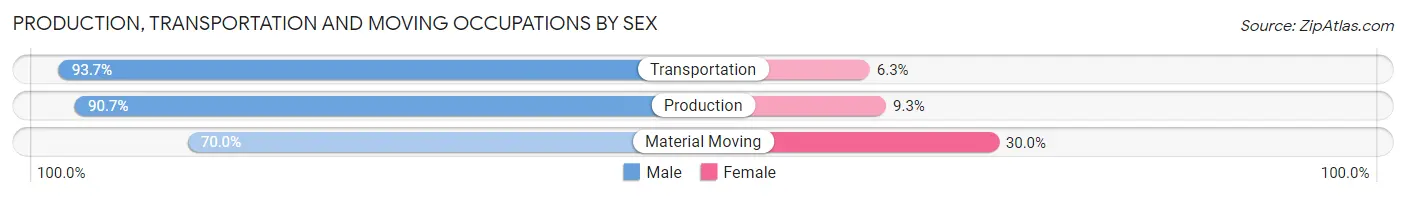
| Occupation | Male | Female |
| Production | 772 (90.7%) | 79 (9.3%) |
| Transportation | 328 (93.7%) | 22 (6.3%) |
| Material Moving | 318 (70.0%) | 136 (30.0%) |
| Total (Category) | 1,418 (85.7%) | 237 (14.3%) |
| Total (Overall) | 6,341 (53.3%) | 5,547 (46.7%) |
Employment Industries by Sex in Derby
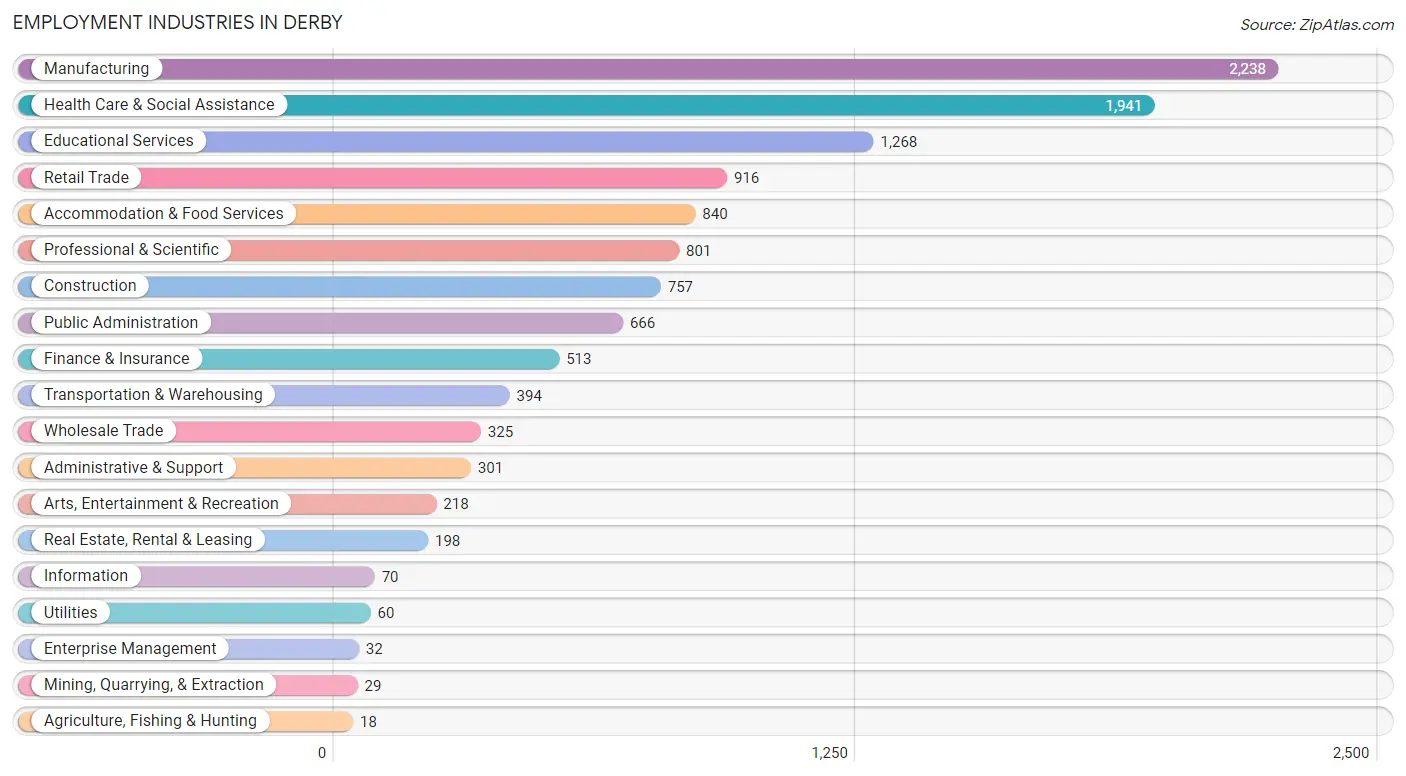
Employment Industries in Derby
The major employment industries in Derby include Manufacturing (2,238 | 18.8%), Health Care & Social Assistance (1,941 | 16.3%), Educational Services (1,268 | 10.7%), Retail Trade (916 | 7.7%), and Accommodation & Food Services (840 | 7.1%).
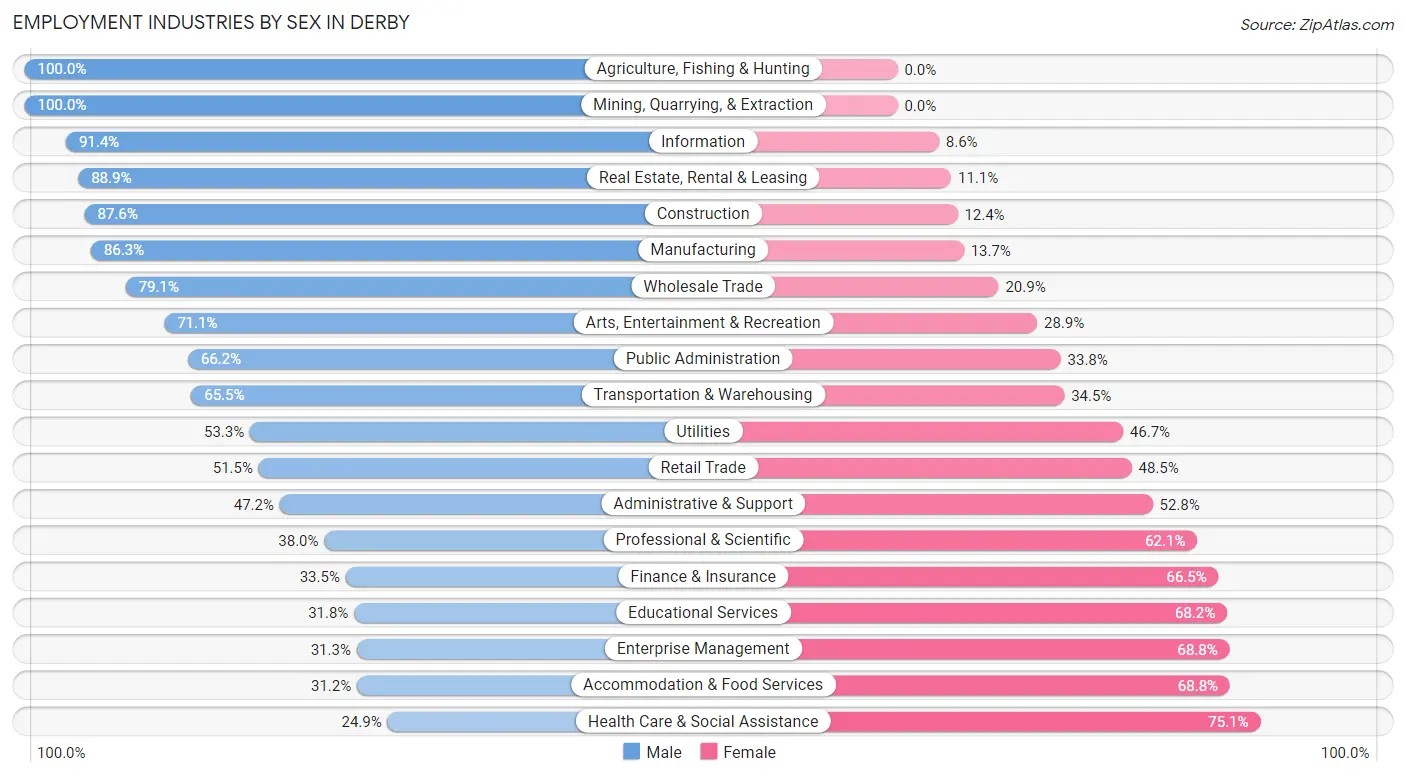
Employment Industries by Sex in Derby
The Derby industries that see more men than women are Agriculture, Fishing & Hunting (100.0%), Mining, Quarrying, & Extraction (100.0%), and Information (91.4%), whereas the industries that tend to have a higher number of women are Health Care & Social Assistance (75.1%), Accommodation & Food Services (68.8%), and Enterprise Management (68.8%).
| Industry | Male | Female |
| Agriculture, Fishing & Hunting | 18 (100.0%) | 0 (0.0%) |
| Mining, Quarrying, & Extraction | 29 (100.0%) | 0 (0.0%) |
| Construction | 663 (87.6%) | 94 (12.4%) |
| Manufacturing | 1,931 (86.3%) | 307 (13.7%) |
| Wholesale Trade | 257 (79.1%) | 68 (20.9%) |
| Retail Trade | 472 (51.5%) | 444 (48.5%) |
| Transportation & Warehousing | 258 (65.5%) | 136 (34.5%) |
| Utilities | 32 (53.3%) | 28 (46.7%) |
| Information | 64 (91.4%) | 6 (8.6%) |
| Finance & Insurance | 172 (33.5%) | 341 (66.5%) |
| Real Estate, Rental & Leasing | 176 (88.9%) | 22 (11.1%) |
| Professional & Scientific | 304 (38.0%) | 497 (62.1%) |
| Enterprise Management | 10 (31.2%) | 22 (68.8%) |
| Administrative & Support | 142 (47.2%) | 159 (52.8%) |
| Educational Services | 403 (31.8%) | 865 (68.2%) |
| Health Care & Social Assistance | 483 (24.9%) | 1,458 (75.1%) |
| Arts, Entertainment & Recreation | 155 (71.1%) | 63 (28.9%) |
| Accommodation & Food Services | 262 (31.2%) | 578 (68.8%) |
| Public Administration | 441 (66.2%) | 225 (33.8%) |
| Total | 6,341 (53.3%) | 5,547 (46.7%) |
Education in Derby
School Enrollment in Derby
The most common levels of schooling among the 7,367 students in Derby are middle school (1,837 | 24.9%), elementary school (1,619 | 22.0%), and high school (1,535 | 20.8%).
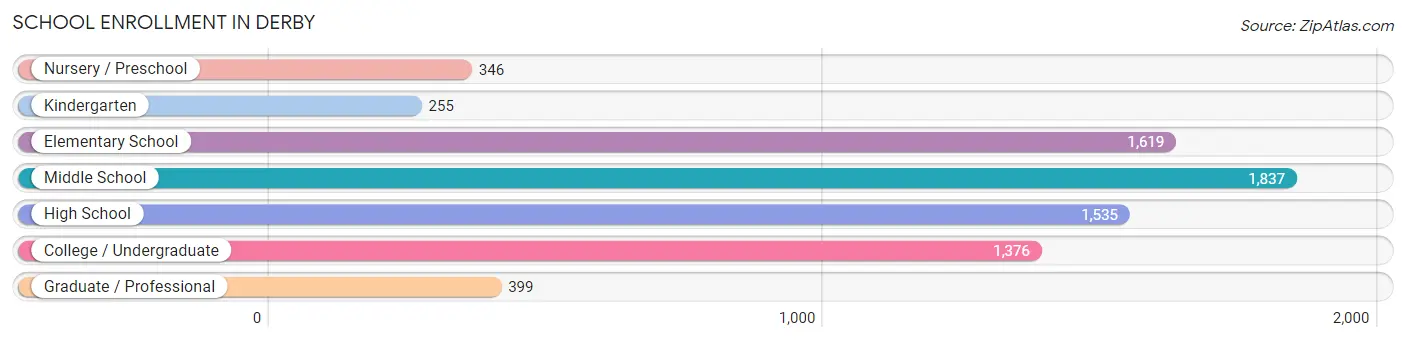
| School Level | # Students | % Students |
| Nursery / Preschool | 346 | 4.7% |
| Kindergarten | 255 | 3.5% |
| Elementary School | 1,619 | 22.0% |
| Middle School | 1,837 | 24.9% |
| High School | 1,535 | 20.8% |
| College / Undergraduate | 1,376 | 18.7% |
| Graduate / Professional | 399 | 5.4% |
| Total | 7,367 | 100.0% |
School Enrollment by Age by Funding Source in Derby
Out of a total of 7,367 students who are enrolled in schools in Derby, 972 (13.2%) attend a private institution, while the remaining 6,395 (86.8%) are enrolled in public schools. The age group of 3 to 4 year olds has the highest likelihood of being enrolled in private schools, with 117 (49.6% in the age bracket) enrolled. Conversely, the age group of 35 years and over has the lowest likelihood of being enrolled in a private school, with 661 (96.4% in the age bracket) attending a public institution.
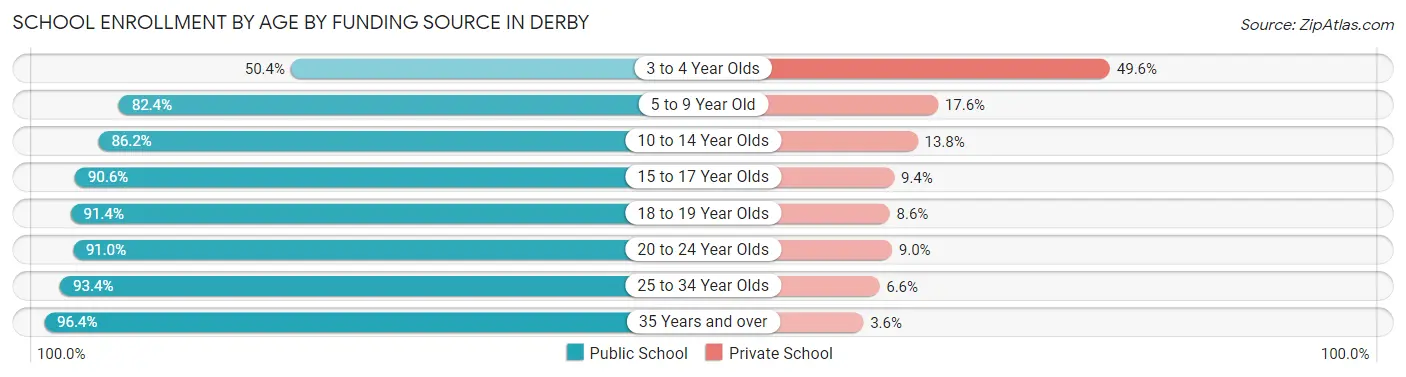
| Age Bracket | Public School | Private School |
| 3 to 4 Year Olds | 119 (50.4%) | 117 (49.6%) |
| 5 to 9 Year Old | 1,460 (82.4%) | 311 (17.6%) |
| 10 to 14 Year Olds | 1,911 (86.2%) | 305 (13.8%) |
| 15 to 17 Year Olds | 1,121 (90.6%) | 116 (9.4%) |
| 18 to 19 Year Olds | 374 (91.4%) | 35 (8.6%) |
| 20 to 24 Year Olds | 396 (91.0%) | 39 (9.0%) |
| 25 to 34 Year Olds | 352 (93.4%) | 25 (6.6%) |
| 35 Years and over | 661 (96.4%) | 25 (3.6%) |
| Total | 6,395 (86.8%) | 972 (13.2%) |
Educational Attainment by Field of Study in Derby
Business (1,618 | 24.5%), education (910 | 13.8%), science & technology (829 | 12.5%), liberal arts & history (502 | 7.6%), and arts & humanities (500 | 7.6%) are the most common fields of study among 6,616 individuals in Derby who have obtained a bachelor's degree or higher.
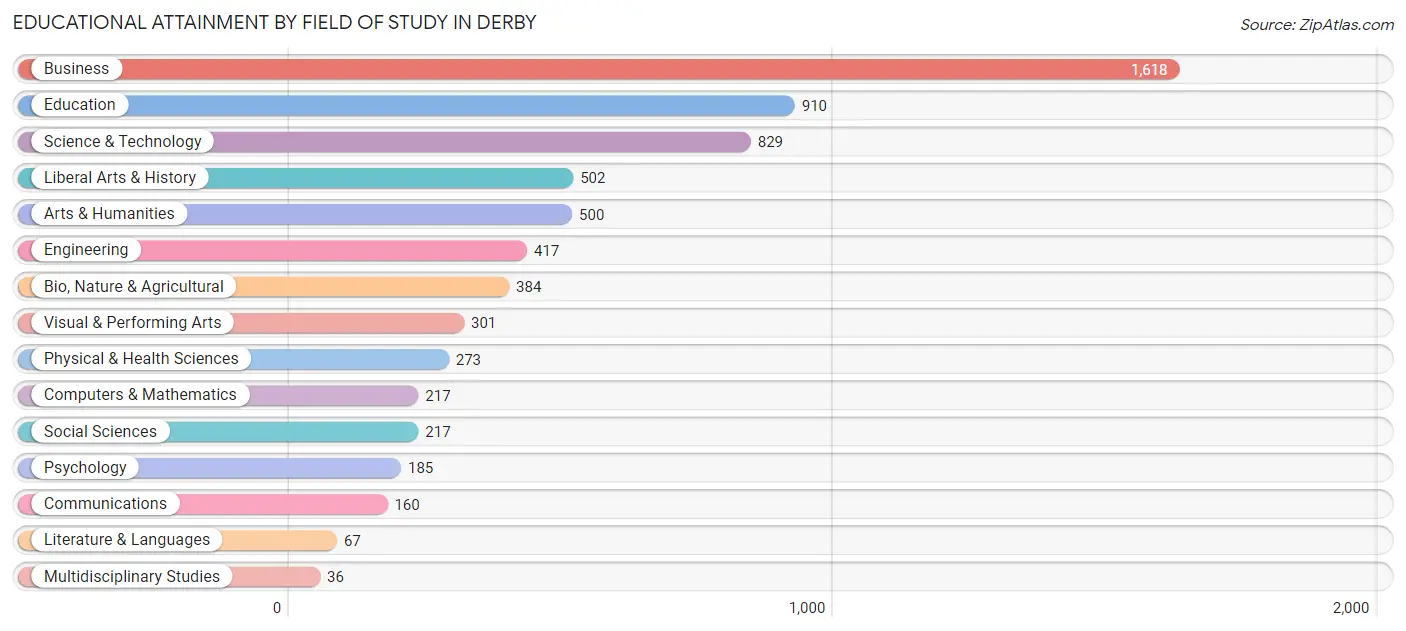
| Field of Study | # Graduates | % Graduates |
| Computers & Mathematics | 217 | 3.3% |
| Bio, Nature & Agricultural | 384 | 5.8% |
| Physical & Health Sciences | 273 | 4.1% |
| Psychology | 185 | 2.8% |
| Social Sciences | 217 | 3.3% |
| Engineering | 417 | 6.3% |
| Multidisciplinary Studies | 36 | 0.5% |
| Science & Technology | 829 | 12.5% |
| Business | 1,618 | 24.5% |
| Education | 910 | 13.8% |
| Literature & Languages | 67 | 1.0% |
| Liberal Arts & History | 502 | 7.6% |
| Visual & Performing Arts | 301 | 4.5% |
| Communications | 160 | 2.4% |
| Arts & Humanities | 500 | 7.6% |
| Total | 6,616 | 100.0% |
Transportation & Commute in Derby
Vehicle Availability by Sex in Derby
The most prevalent vehicle ownership categories in Derby are males with 2 vehicles (2,801, accounting for 41.1%) and females with 2 vehicles (2,520, making up 51.1%).
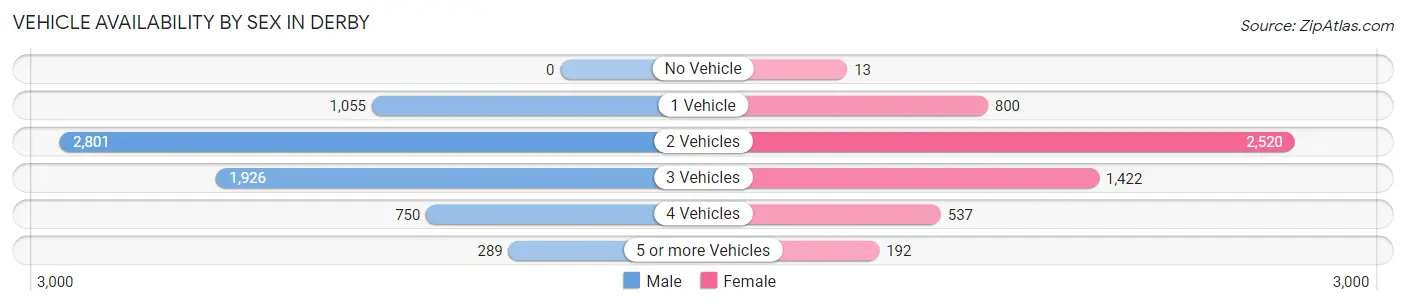
| Vehicles Available | Male | Female |
| No Vehicle | 0 (0.0%) | 13 (0.2%) |
| 1 Vehicle | 1,055 (15.5%) | 800 (14.6%) |
| 2 Vehicles | 2,801 (41.1%) | 2,520 (46.0%) |
| 3 Vehicles | 1,926 (28.2%) | 1,422 (25.9%) |
| 4 Vehicles | 750 (11.0%) | 537 (9.8%) |
| 5 or more Vehicles | 289 (4.2%) | 192 (3.5%) |
| Total | 6,821 (100.0%) | 5,484 (100.0%) |
Commute Time in Derby
The most frequently occuring commute durations in Derby are 30 to 34 minutes (2,196 commuters, 19.0%), 20 to 24 minutes (2,019 commuters, 17.4%), and 15 to 19 minutes (1,738 commuters, 15.0%).
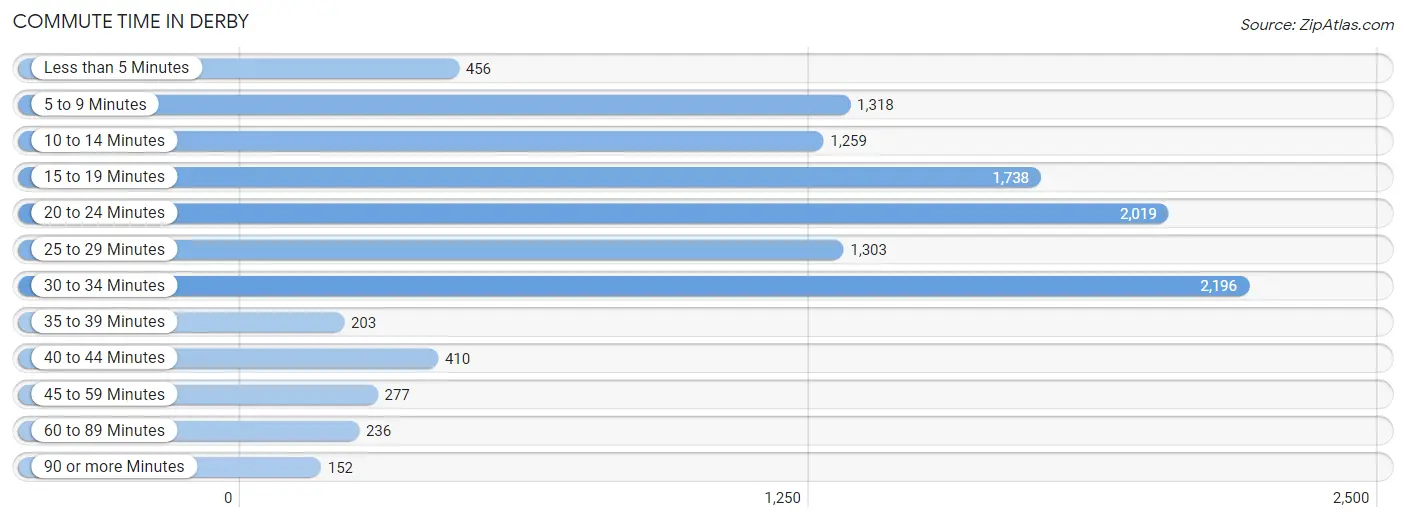
| Commute Time | # Commuters | % Commuters |
| Less than 5 Minutes | 456 | 3.9% |
| 5 to 9 Minutes | 1,318 | 11.4% |
| 10 to 14 Minutes | 1,259 | 10.9% |
| 15 to 19 Minutes | 1,738 | 15.0% |
| 20 to 24 Minutes | 2,019 | 17.4% |
| 25 to 29 Minutes | 1,303 | 11.3% |
| 30 to 34 Minutes | 2,196 | 19.0% |
| 35 to 39 Minutes | 203 | 1.8% |
| 40 to 44 Minutes | 410 | 3.5% |
| 45 to 59 Minutes | 277 | 2.4% |
| 60 to 89 Minutes | 236 | 2.0% |
| 90 or more Minutes | 152 | 1.3% |
Commute Time by Sex in Derby
The most common commute times in Derby are 30 to 34 minutes (1,297 commuters, 20.2%) for males and 30 to 34 minutes (899 commuters, 17.5%) for females.
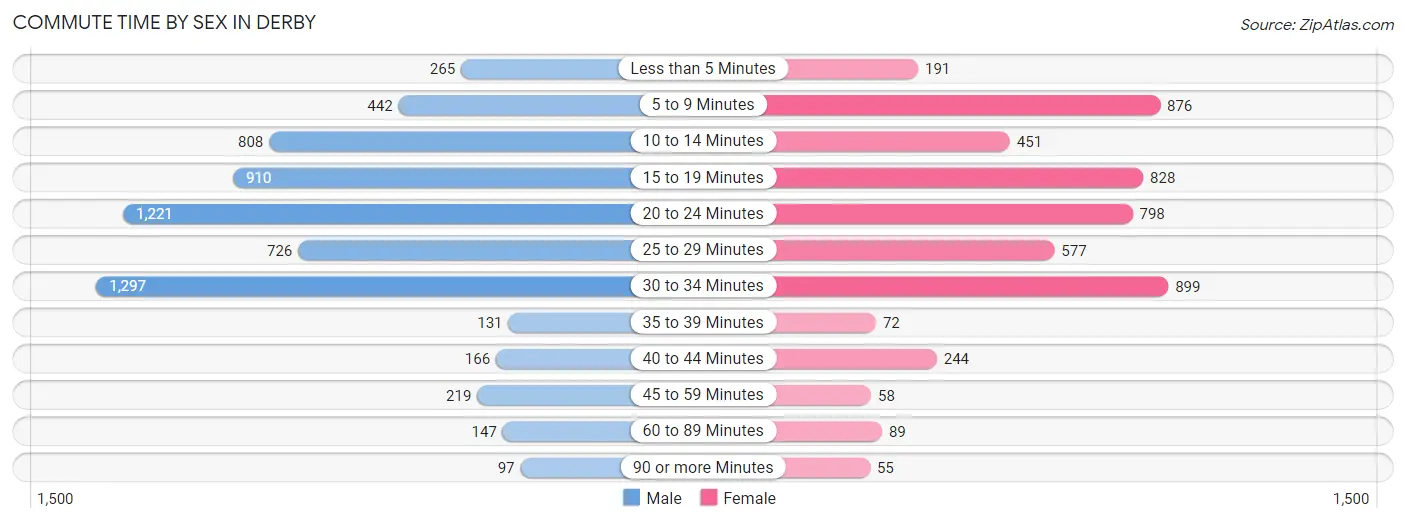
| Commute Time | Male | Female |
| Less than 5 Minutes | 265 (4.1%) | 191 (3.7%) |
| 5 to 9 Minutes | 442 (6.9%) | 876 (17.1%) |
| 10 to 14 Minutes | 808 (12.6%) | 451 (8.8%) |
| 15 to 19 Minutes | 910 (14.1%) | 828 (16.1%) |
| 20 to 24 Minutes | 1,221 (19.0%) | 798 (15.5%) |
| 25 to 29 Minutes | 726 (11.3%) | 577 (11.2%) |
| 30 to 34 Minutes | 1,297 (20.2%) | 899 (17.5%) |
| 35 to 39 Minutes | 131 (2.0%) | 72 (1.4%) |
| 40 to 44 Minutes | 166 (2.6%) | 244 (4.8%) |
| 45 to 59 Minutes | 219 (3.4%) | 58 (1.1%) |
| 60 to 89 Minutes | 147 (2.3%) | 89 (1.7%) |
| 90 or more Minutes | 97 (1.5%) | 55 (1.1%) |
Time of Departure to Work by Sex in Derby
The most frequent times of departure to work in Derby are 7:00 AM to 7:29 AM (919, 14.3%) for males and 7:00 AM to 7:29 AM (958, 18.6%) for females.
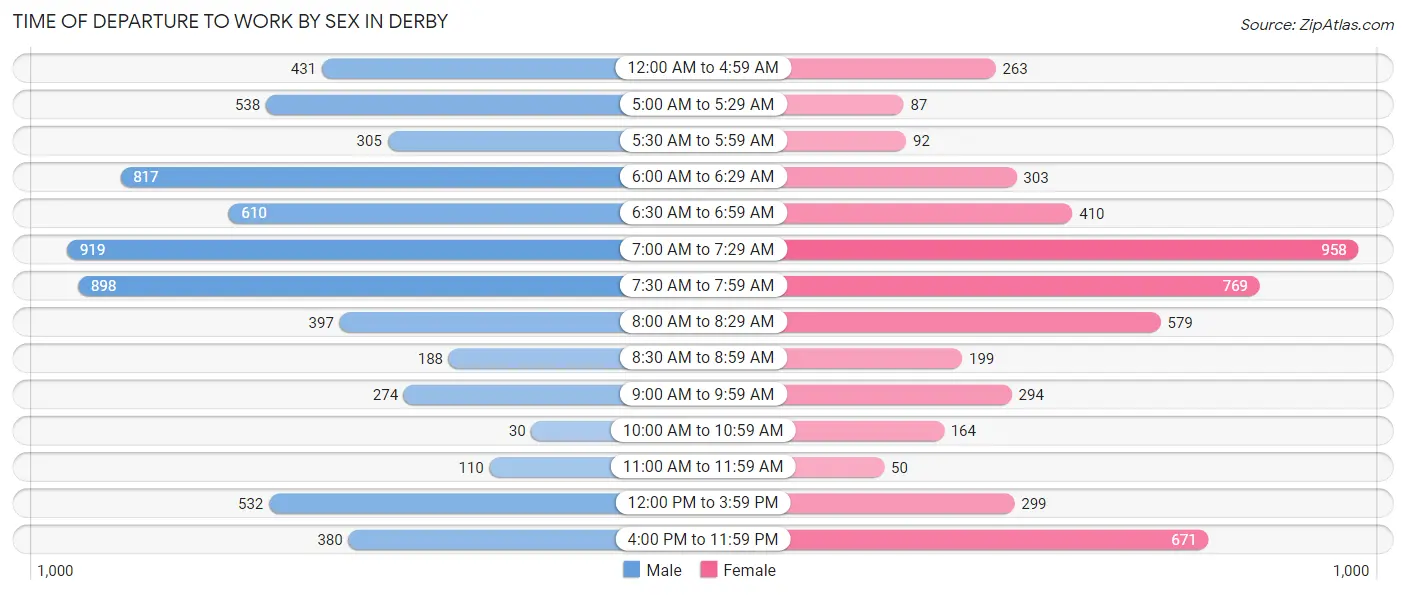
| Time of Departure | Male | Female |
| 12:00 AM to 4:59 AM | 431 (6.7%) | 263 (5.1%) |
| 5:00 AM to 5:29 AM | 538 (8.4%) | 87 (1.7%) |
| 5:30 AM to 5:59 AM | 305 (4.7%) | 92 (1.8%) |
| 6:00 AM to 6:29 AM | 817 (12.7%) | 303 (5.9%) |
| 6:30 AM to 6:59 AM | 610 (9.5%) | 410 (8.0%) |
| 7:00 AM to 7:29 AM | 919 (14.3%) | 958 (18.6%) |
| 7:30 AM to 7:59 AM | 898 (14.0%) | 769 (15.0%) |
| 8:00 AM to 8:29 AM | 397 (6.2%) | 579 (11.3%) |
| 8:30 AM to 8:59 AM | 188 (2.9%) | 199 (3.9%) |
| 9:00 AM to 9:59 AM | 274 (4.3%) | 294 (5.7%) |
| 10:00 AM to 10:59 AM | 30 (0.5%) | 164 (3.2%) |
| 11:00 AM to 11:59 AM | 110 (1.7%) | 50 (1.0%) |
| 12:00 PM to 3:59 PM | 532 (8.3%) | 299 (5.8%) |
| 4:00 PM to 11:59 PM | 380 (5.9%) | 671 (13.1%) |
| Total | 6,429 (100.0%) | 5,138 (100.0%) |
Housing Occupancy in Derby
Occupancy by Ownership in Derby
Of the total 10,029 dwellings in Derby, owner-occupied units account for 6,865 (68.4%), while renter-occupied units make up 3,164 (31.6%).
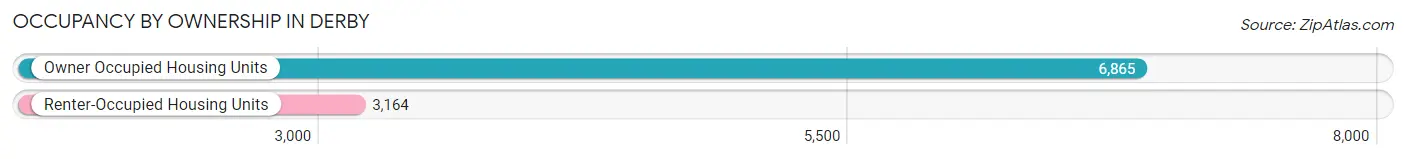
| Occupancy | # Housing Units | % Housing Units |
| Owner Occupied Housing Units | 6,865 | 68.4% |
| Renter-Occupied Housing Units | 3,164 | 31.6% |
| Total Occupied Housing Units | 10,029 | 100.0% |
Occupancy by Household Size in Derby
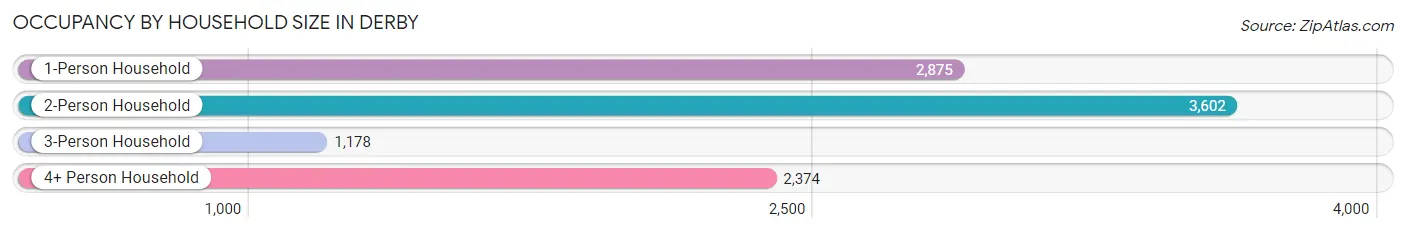
| Household Size | # Housing Units | % Housing Units |
| 1-Person Household | 2,875 | 28.7% |
| 2-Person Household | 3,602 | 35.9% |
| 3-Person Household | 1,178 | 11.7% |
| 4+ Person Household | 2,374 | 23.7% |
| Total Housing Units | 10,029 | 100.0% |
Occupancy by Ownership by Household Size in Derby
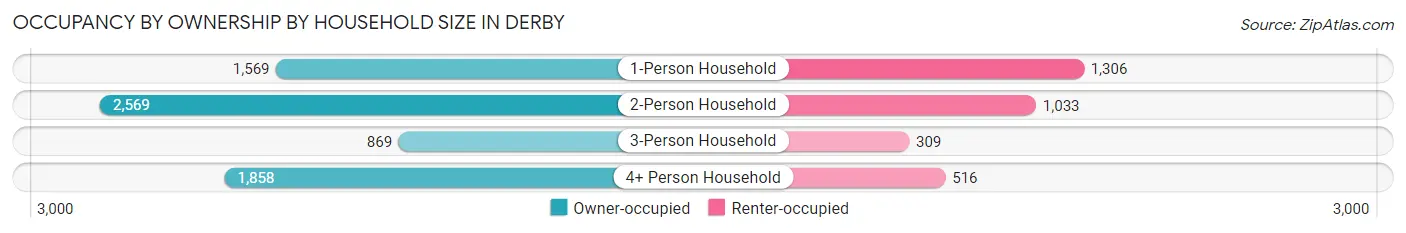
| Household Size | Owner-occupied | Renter-occupied |
| 1-Person Household | 1,569 (54.6%) | 1,306 (45.4%) |
| 2-Person Household | 2,569 (71.3%) | 1,033 (28.7%) |
| 3-Person Household | 869 (73.8%) | 309 (26.2%) |
| 4+ Person Household | 1,858 (78.3%) | 516 (21.7%) |
| Total Housing Units | 6,865 (68.4%) | 3,164 (31.6%) |
Occupancy by Educational Attainment in Derby
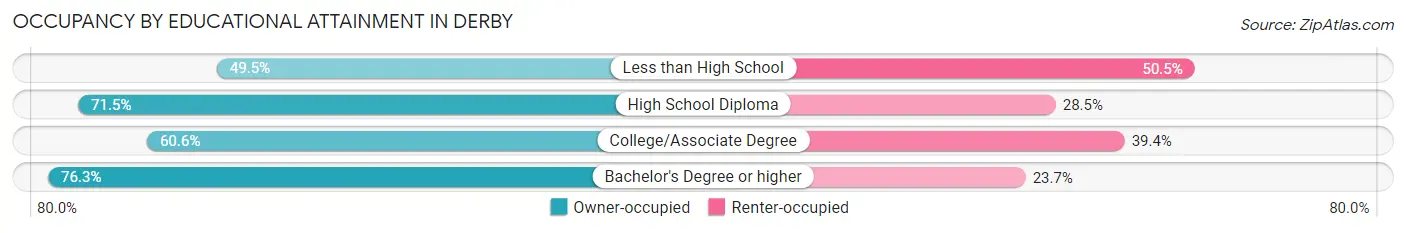
| Household Size | Owner-occupied | Renter-occupied |
| Less than High School | 151 (49.5%) | 154 (50.5%) |
| High School Diploma | 1,250 (71.5%) | 498 (28.5%) |
| College/Associate Degree | 2,393 (60.6%) | 1,557 (39.4%) |
| Bachelor's Degree or higher | 3,071 (76.3%) | 955 (23.7%) |
Occupancy by Age of Householder in Derby
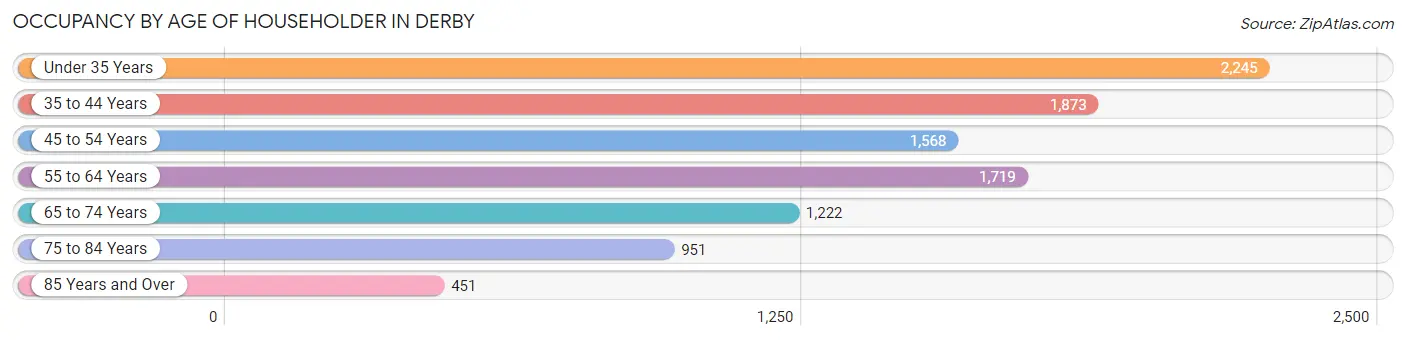
| Age Bracket | # Households | % Households |
| Under 35 Years | 2,245 | 22.4% |
| 35 to 44 Years | 1,873 | 18.7% |
| 45 to 54 Years | 1,568 | 15.6% |
| 55 to 64 Years | 1,719 | 17.1% |
| 65 to 74 Years | 1,222 | 12.2% |
| 75 to 84 Years | 951 | 9.5% |
| 85 Years and Over | 451 | 4.5% |
| Total | 10,029 | 100.0% |
Housing Finances in Derby
Median Income by Occupancy in Derby
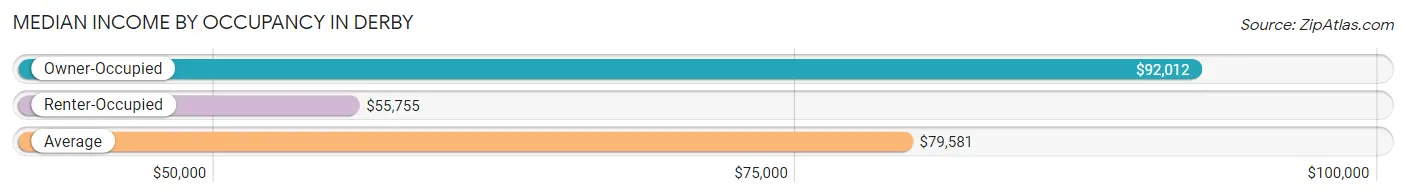
| Occupancy Type | # Households | Median Income |
| Owner-Occupied | 6,865 (68.4%) | $92,012 |
| Renter-Occupied | 3,164 (31.6%) | $55,755 |
| Average | 10,029 (100.0%) | $79,581 |
Occupancy by Householder Income Bracket in Derby
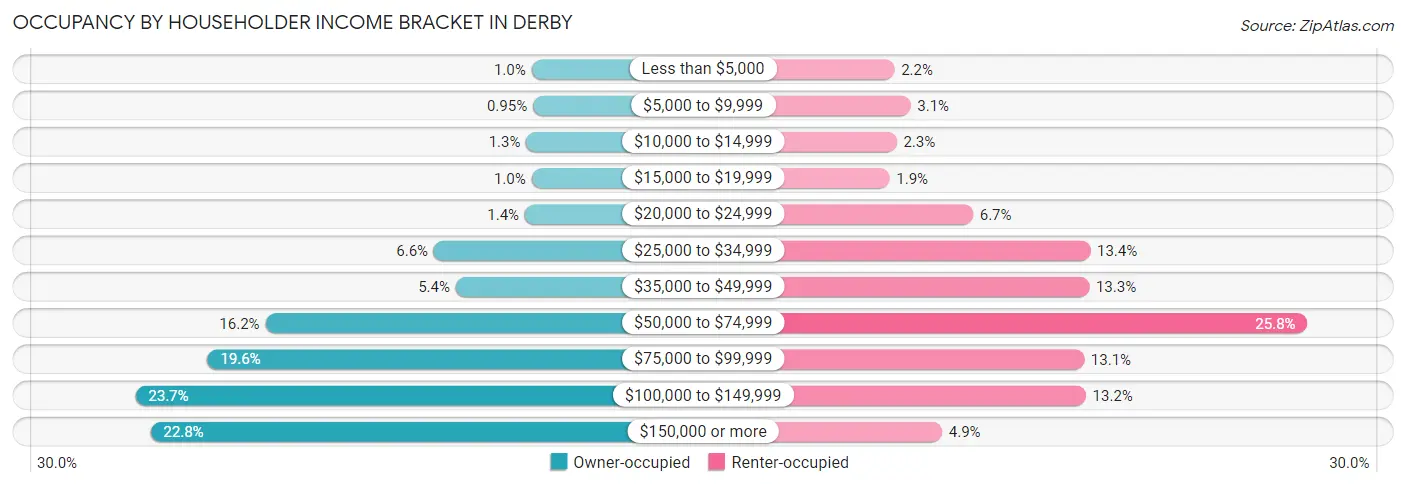
| Income Bracket | Owner-occupied | Renter-occupied |
| Less than $5,000 | 71 (1.0%) | 70 (2.2%) |
| $5,000 to $9,999 | 65 (0.9%) | 99 (3.1%) |
| $10,000 to $14,999 | 91 (1.3%) | 74 (2.3%) |
| $15,000 to $19,999 | 71 (1.0%) | 61 (1.9%) |
| $20,000 to $24,999 | 97 (1.4%) | 212 (6.7%) |
| $25,000 to $34,999 | 454 (6.6%) | 424 (13.4%) |
| $35,000 to $49,999 | 368 (5.4%) | 422 (13.3%) |
| $50,000 to $74,999 | 1,115 (16.2%) | 817 (25.8%) |
| $75,000 to $99,999 | 1,342 (19.6%) | 413 (13.1%) |
| $100,000 to $149,999 | 1,625 (23.7%) | 416 (13.2%) |
| $150,000 or more | 1,566 (22.8%) | 156 (4.9%) |
| Total | 6,865 (100.0%) | 3,164 (100.0%) |
Monthly Housing Cost Tiers in Derby
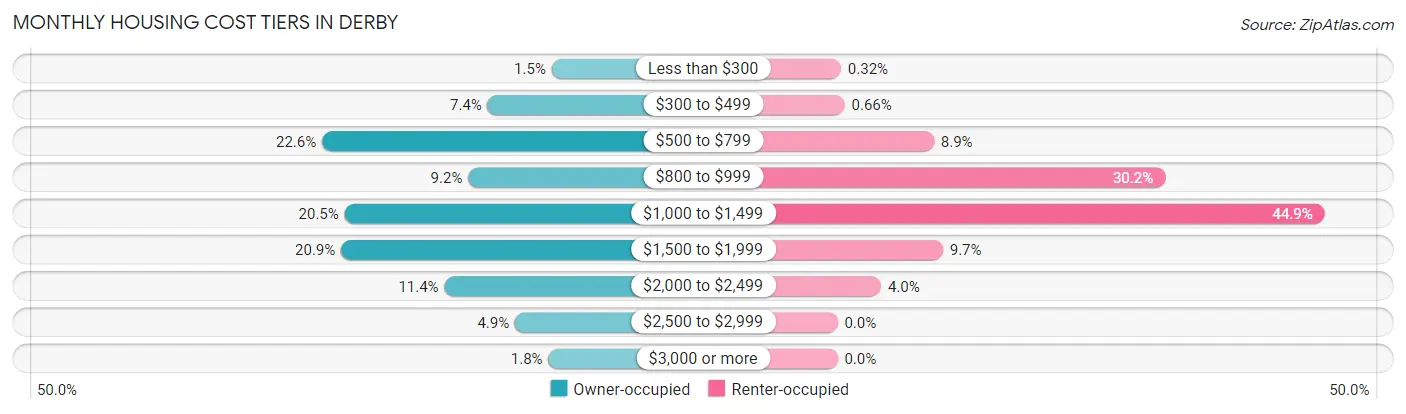
| Monthly Cost | Owner-occupied | Renter-occupied |
| Less than $300 | 101 (1.5%) | 10 (0.3%) |
| $300 to $499 | 506 (7.4%) | 21 (0.7%) |
| $500 to $799 | 1,553 (22.6%) | 281 (8.9%) |
| $800 to $999 | 629 (9.2%) | 954 (30.1%) |
| $1,000 to $1,499 | 1,410 (20.5%) | 1,419 (44.9%) |
| $1,500 to $1,999 | 1,432 (20.9%) | 307 (9.7%) |
| $2,000 to $2,499 | 779 (11.4%) | 127 (4.0%) |
| $2,500 to $2,999 | 333 (4.9%) | 0 (0.0%) |
| $3,000 or more | 122 (1.8%) | 0 (0.0%) |
| Total | 6,865 (100.0%) | 3,164 (100.0%) |
Physical Housing Characteristics in Derby
Housing Structures in Derby
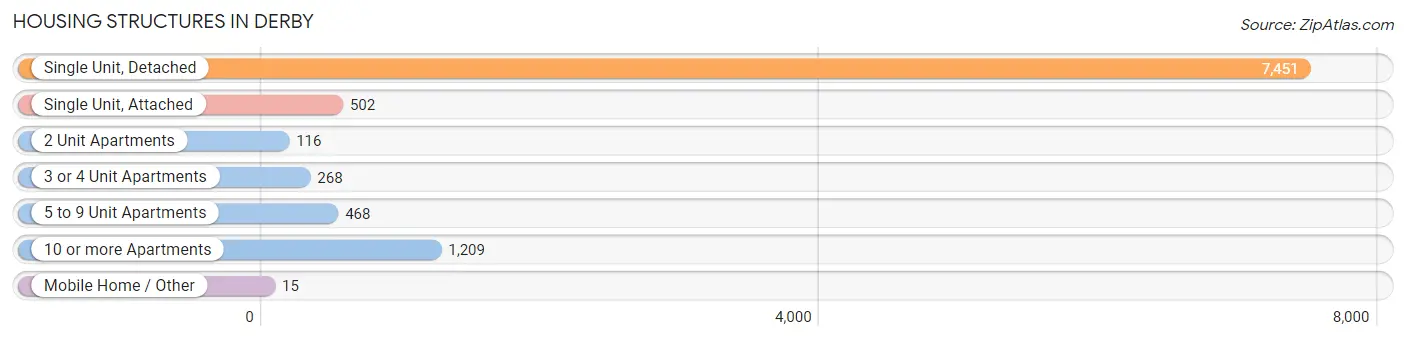
| Structure Type | # Housing Units | % Housing Units |
| Single Unit, Detached | 7,451 | 74.3% |
| Single Unit, Attached | 502 | 5.0% |
| 2 Unit Apartments | 116 | 1.2% |
| 3 or 4 Unit Apartments | 268 | 2.7% |
| 5 to 9 Unit Apartments | 468 | 4.7% |
| 10 or more Apartments | 1,209 | 12.1% |
| Mobile Home / Other | 15 | 0.2% |
| Total | 10,029 | 100.0% |
Housing Structures by Occupancy in Derby
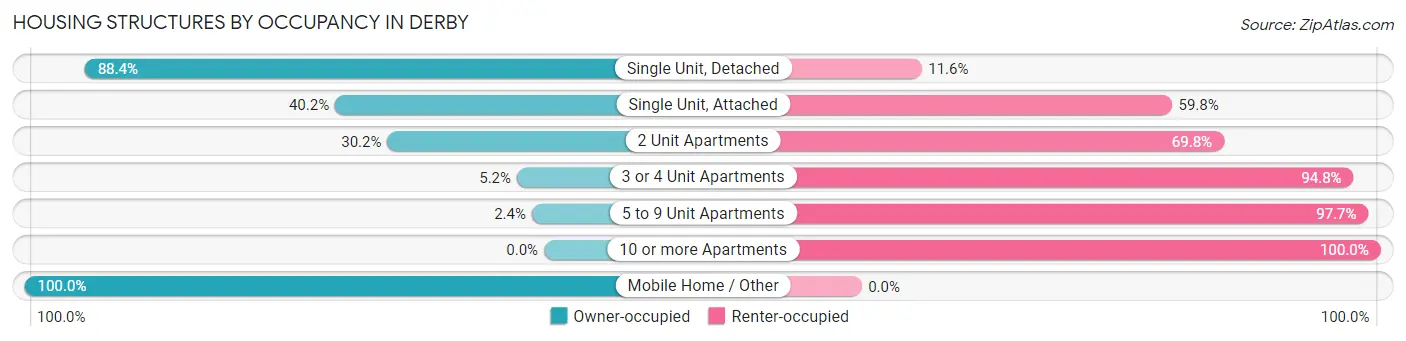
| Structure Type | Owner-occupied | Renter-occupied |
| Single Unit, Detached | 6,588 (88.4%) | 863 (11.6%) |
| Single Unit, Attached | 202 (40.2%) | 300 (59.8%) |
| 2 Unit Apartments | 35 (30.2%) | 81 (69.8%) |
| 3 or 4 Unit Apartments | 14 (5.2%) | 254 (94.8%) |
| 5 to 9 Unit Apartments | 11 (2.4%) | 457 (97.7%) |
| 10 or more Apartments | 0 (0.0%) | 1,209 (100.0%) |
| Mobile Home / Other | 15 (100.0%) | 0 (0.0%) |
| Total | 6,865 (68.4%) | 3,164 (31.6%) |
Housing Structures by Number of Rooms in Derby
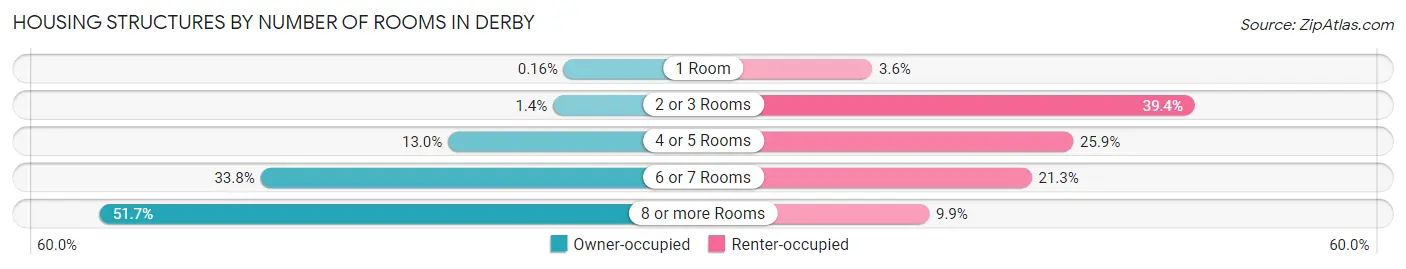
| Number of Rooms | Owner-occupied | Renter-occupied |
| 1 Room | 11 (0.2%) | 113 (3.6%) |
| 2 or 3 Rooms | 93 (1.3%) | 1,246 (39.4%) |
| 4 or 5 Rooms | 893 (13.0%) | 819 (25.9%) |
| 6 or 7 Rooms | 2,322 (33.8%) | 673 (21.3%) |
| 8 or more Rooms | 3,546 (51.6%) | 313 (9.9%) |
| Total | 6,865 (100.0%) | 3,164 (100.0%) |
Housing Structure by Heating Type in Derby
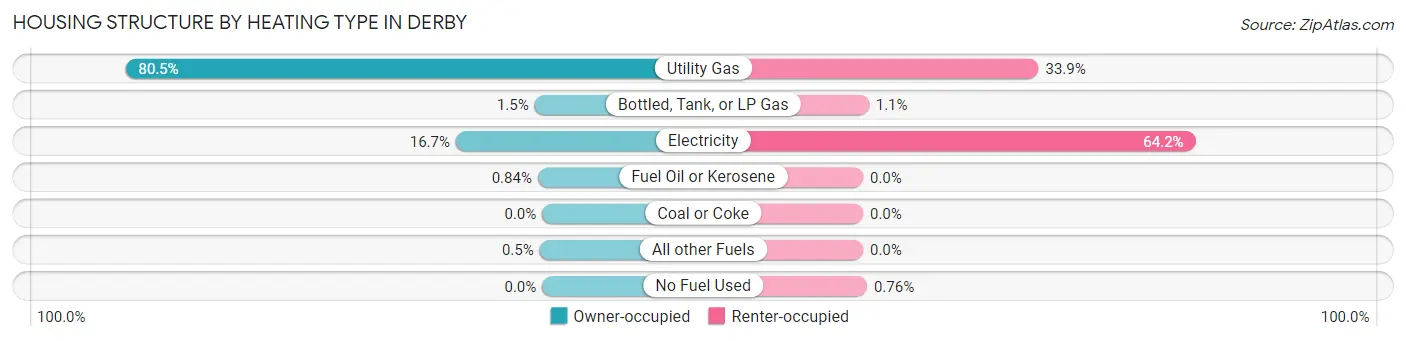
| Heating Type | Owner-occupied | Renter-occupied |
| Utility Gas | 5,528 (80.5%) | 1,073 (33.9%) |
| Bottled, Tank, or LP Gas | 100 (1.5%) | 35 (1.1%) |
| Electricity | 1,145 (16.7%) | 2,032 (64.2%) |
| Fuel Oil or Kerosene | 58 (0.8%) | 0 (0.0%) |
| Coal or Coke | 0 (0.0%) | 0 (0.0%) |
| All other Fuels | 34 (0.5%) | 0 (0.0%) |
| No Fuel Used | 0 (0.0%) | 24 (0.8%) |
| Total | 6,865 (100.0%) | 3,164 (100.0%) |
Household Vehicle Usage in Derby
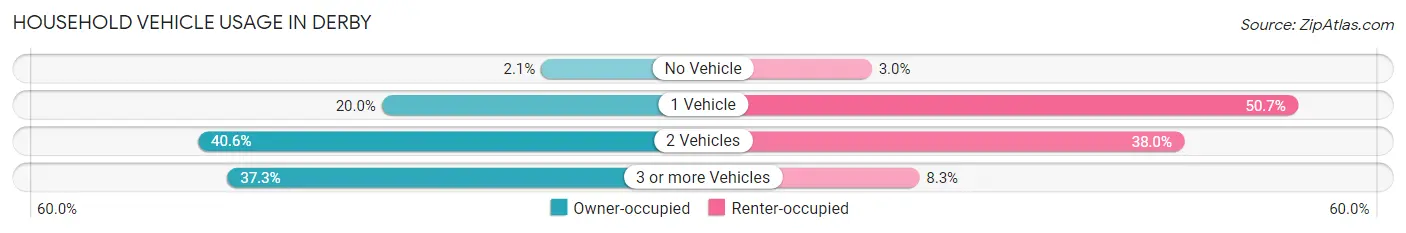
| Vehicles per Household | Owner-occupied | Renter-occupied |
| No Vehicle | 147 (2.1%) | 95 (3.0%) |
| 1 Vehicle | 1,373 (20.0%) | 1,604 (50.7%) |
| 2 Vehicles | 2,785 (40.6%) | 1,201 (38.0%) |
| 3 or more Vehicles | 2,560 (37.3%) | 264 (8.3%) |
| Total | 6,865 (100.0%) | 3,164 (100.0%) |
Real Estate & Mortgages in Derby
Real Estate and Mortgage Overview in Derby
| Characteristic | Without Mortgage | With Mortgage |
| Housing Units | 2,498 | 4,367 |
| Median Property Value | $184,900 | $223,000 |
| Median Household Income | $72,900 | $1,086 |
| Monthly Housing Costs | $652 | $122 |
| Real Estate Taxes | $3,042 | $51 |
Property Value by Mortgage Status in Derby
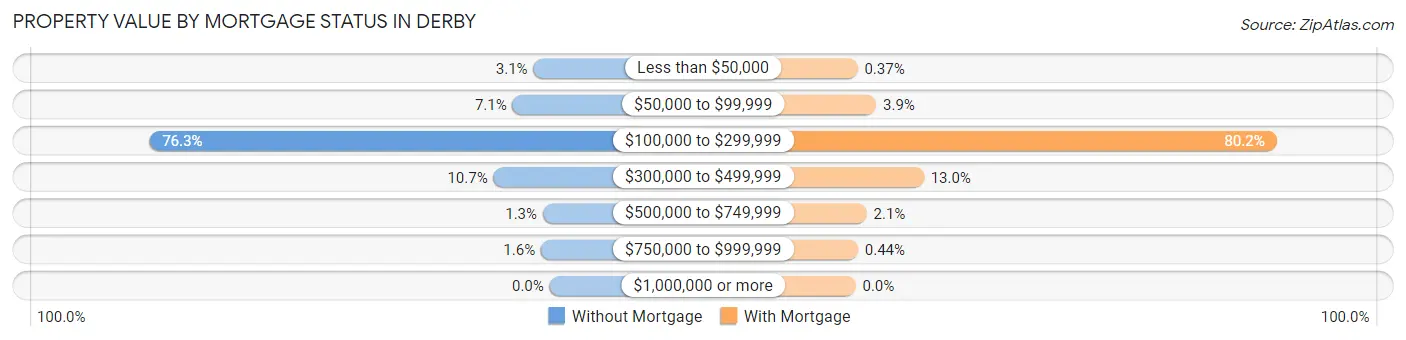
| Property Value | Without Mortgage | With Mortgage |
| Less than $50,000 | 77 (3.1%) | 16 (0.4%) |
| $50,000 to $99,999 | 176 (7.0%) | 171 (3.9%) |
| $100,000 to $299,999 | 1,905 (76.3%) | 3,502 (80.2%) |
| $300,000 to $499,999 | 267 (10.7%) | 567 (13.0%) |
| $500,000 to $749,999 | 32 (1.3%) | 92 (2.1%) |
| $750,000 to $999,999 | 41 (1.6%) | 19 (0.4%) |
| $1,000,000 or more | 0 (0.0%) | 0 (0.0%) |
| Total | 2,498 (100.0%) | 4,367 (100.0%) |
Household Income by Mortgage Status in Derby
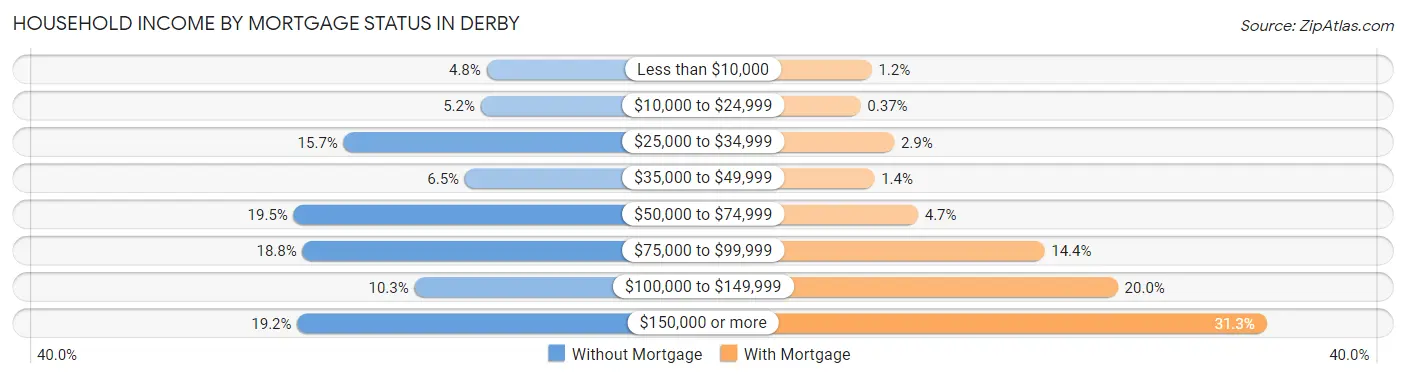
| Household Income | Without Mortgage | With Mortgage |
| Less than $10,000 | 120 (4.8%) | 53 (1.2%) |
| $10,000 to $24,999 | 131 (5.2%) | 16 (0.4%) |
| $25,000 to $34,999 | 392 (15.7%) | 128 (2.9%) |
| $35,000 to $49,999 | 161 (6.5%) | 62 (1.4%) |
| $50,000 to $74,999 | 487 (19.5%) | 207 (4.7%) |
| $75,000 to $99,999 | 470 (18.8%) | 628 (14.4%) |
| $100,000 to $149,999 | 257 (10.3%) | 872 (20.0%) |
| $150,000 or more | 480 (19.2%) | 1,368 (31.3%) |
| Total | 2,498 (100.0%) | 4,367 (100.0%) |
Property Value to Household Income Ratio in Derby
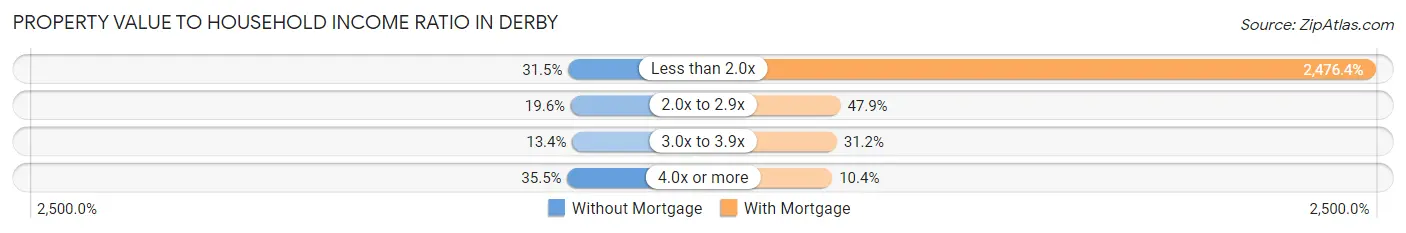
| Value-to-Income Ratio | Without Mortgage | With Mortgage |
| Less than 2.0x | 787 (31.5%) | 108,145 (2,476.4%) |
| 2.0x to 2.9x | 489 (19.6%) | 2,091 (47.9%) |
| 3.0x to 3.9x | 335 (13.4%) | 1,362 (31.2%) |
| 4.0x or more | 887 (35.5%) | 456 (10.4%) |
| Total | 2,498 (100.0%) | 4,367 (100.0%) |
Real Estate Taxes by Mortgage Status in Derby
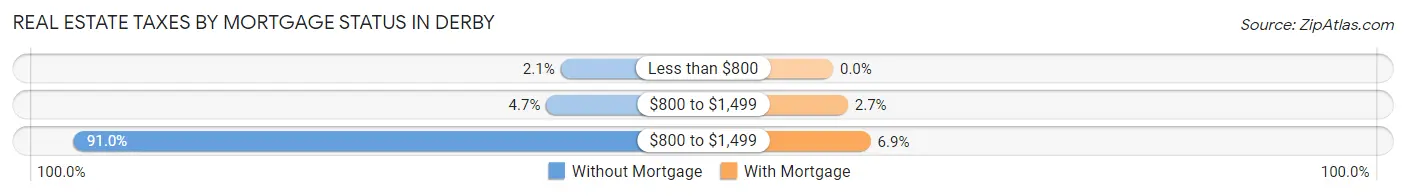
| Property Taxes | Without Mortgage | With Mortgage |
| Less than $800 | 53 (2.1%) | 0 (0.0%) |
| $800 to $1,499 | 118 (4.7%) | 118 (2.7%) |
| $800 to $1,499 | 2,273 (91.0%) | 300 (6.9%) |
| Total | 2,498 (100.0%) | 4,367 (100.0%) |
Health & Disability in Derby
Health Insurance Coverage by Age in Derby
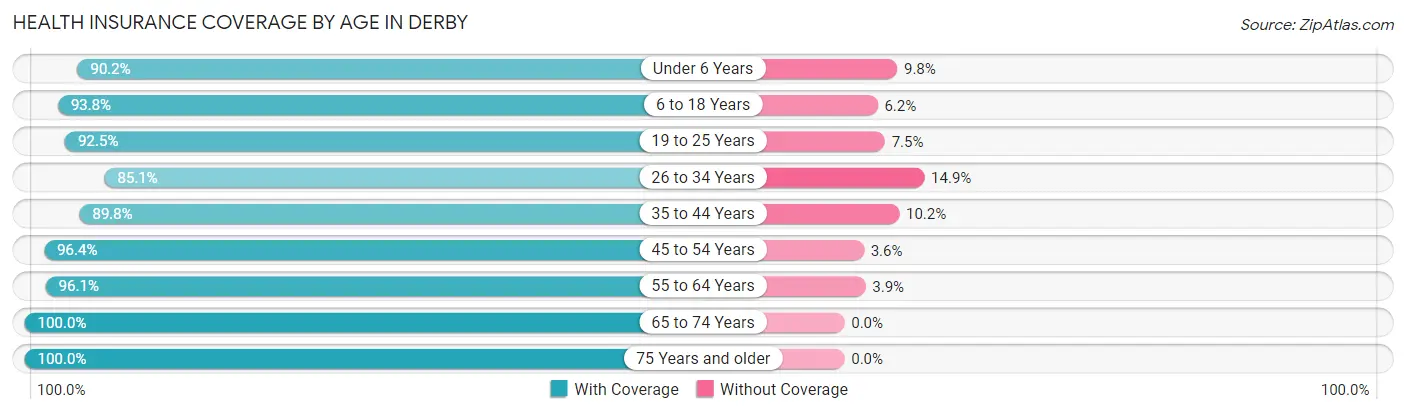
| Age Bracket | With Coverage | Without Coverage |
| Under 6 Years | 1,567 (90.2%) | 171 (9.8%) |
| 6 to 18 Years | 5,238 (93.8%) | 345 (6.2%) |
| 19 to 25 Years | 2,011 (92.5%) | 164 (7.5%) |
| 26 to 34 Years | 2,390 (85.1%) | 418 (14.9%) |
| 35 to 44 Years | 3,088 (89.8%) | 351 (10.2%) |
| 45 to 54 Years | 2,346 (96.4%) | 88 (3.6%) |
| 55 to 64 Years | 2,739 (96.1%) | 112 (3.9%) |
| 65 to 74 Years | 1,890 (100.0%) | 0 (0.0%) |
| 75 Years and older | 1,974 (100.0%) | 0 (0.0%) |
| Total | 23,243 (93.4%) | 1,649 (6.6%) |
Health Insurance Coverage by Citizenship Status in Derby
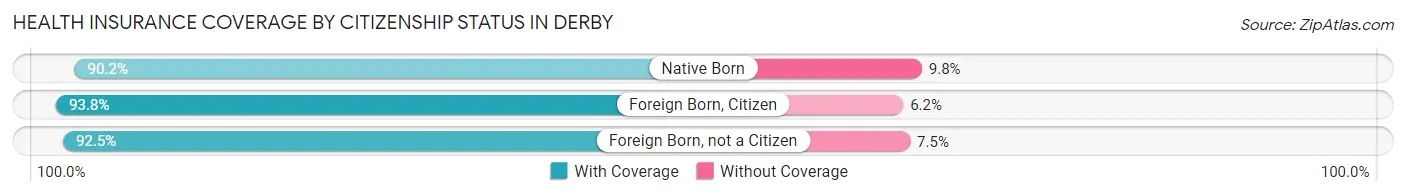
| Citizenship Status | With Coverage | Without Coverage |
| Native Born | 1,567 (90.2%) | 171 (9.8%) |
| Foreign Born, Citizen | 5,238 (93.8%) | 345 (6.2%) |
| Foreign Born, not a Citizen | 2,011 (92.5%) | 164 (7.5%) |
Health Insurance Coverage by Household Income in Derby
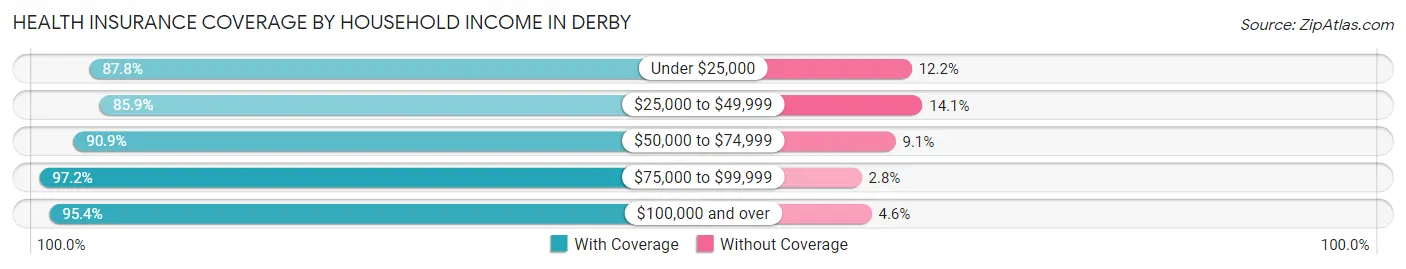
| Household Income | With Coverage | Without Coverage |
| Under $25,000 | 1,243 (87.8%) | 172 (12.2%) |
| $25,000 to $49,999 | 2,471 (85.9%) | 407 (14.1%) |
| $50,000 to $74,999 | 3,912 (90.9%) | 393 (9.1%) |
| $75,000 to $99,999 | 4,201 (97.2%) | 120 (2.8%) |
| $100,000 and over | 11,407 (95.4%) | 554 (4.6%) |
Public vs Private Health Insurance Coverage by Age in Derby
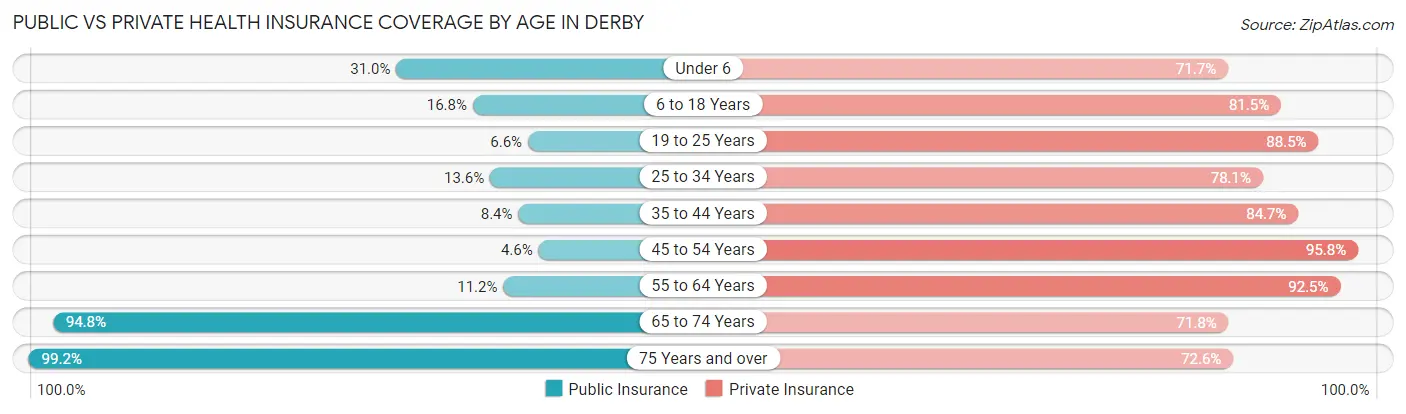
| Age Bracket | Public Insurance | Private Insurance |
| Under 6 | 539 (31.0%) | 1,246 (71.7%) |
| 6 to 18 Years | 938 (16.8%) | 4,552 (81.5%) |
| 19 to 25 Years | 143 (6.6%) | 1,924 (88.5%) |
| 25 to 34 Years | 382 (13.6%) | 2,194 (78.1%) |
| 35 to 44 Years | 287 (8.4%) | 2,914 (84.7%) |
| 45 to 54 Years | 112 (4.6%) | 2,332 (95.8%) |
| 55 to 64 Years | 318 (11.2%) | 2,638 (92.5%) |
| 65 to 74 Years | 1,791 (94.8%) | 1,357 (71.8%) |
| 75 Years and over | 1,959 (99.2%) | 1,434 (72.6%) |
| Total | 6,469 (26.0%) | 20,591 (82.7%) |
Disability Status by Sex by Age in Derby
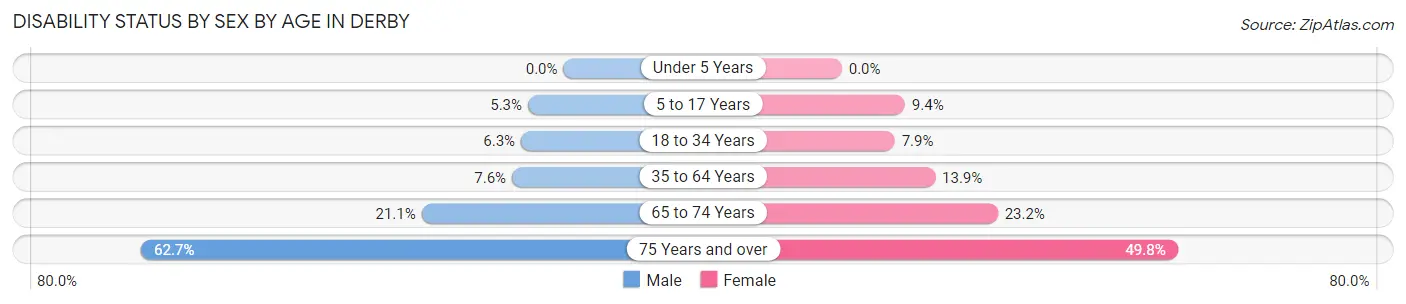
| Age Bracket | Male | Female |
| Under 5 Years | 0 (0.0%) | 0 (0.0%) |
| 5 to 17 Years | 147 (5.3%) | 262 (9.4%) |
| 18 to 34 Years | 172 (6.3%) | 196 (7.9%) |
| 35 to 64 Years | 320 (7.6%) | 629 (13.9%) |
| 65 to 74 Years | 176 (21.0%) | 244 (23.2%) |
| 75 Years and over | 474 (62.7%) | 607 (49.8%) |
Disability Class by Sex by Age in Derby
Disability Class: Hearing Difficulty
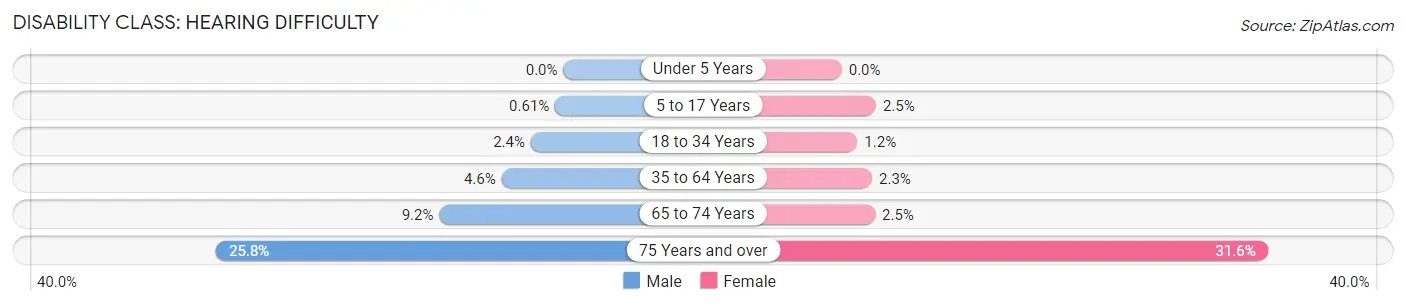
| Age Bracket | Male | Female |
| Under 5 Years | 0 (0.0%) | 0 (0.0%) |
| 5 to 17 Years | 17 (0.6%) | 71 (2.5%) |
| 18 to 34 Years | 66 (2.4%) | 29 (1.2%) |
| 35 to 64 Years | 192 (4.6%) | 102 (2.2%) |
| 65 to 74 Years | 77 (9.2%) | 26 (2.5%) |
| 75 Years and over | 195 (25.8%) | 385 (31.6%) |
Disability Class: Vision Difficulty
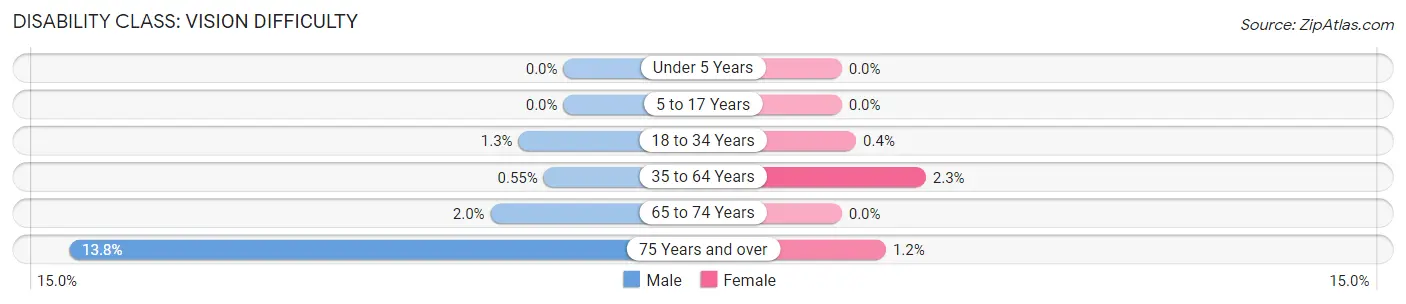
| Age Bracket | Male | Female |
| Under 5 Years | 0 (0.0%) | 0 (0.0%) |
| 5 to 17 Years | 0 (0.0%) | 0 (0.0%) |
| 18 to 34 Years | 34 (1.3%) | 10 (0.4%) |
| 35 to 64 Years | 23 (0.5%) | 106 (2.3%) |
| 65 to 74 Years | 17 (2.0%) | 0 (0.0%) |
| 75 Years and over | 104 (13.8%) | 15 (1.2%) |
Disability Class: Cognitive Difficulty
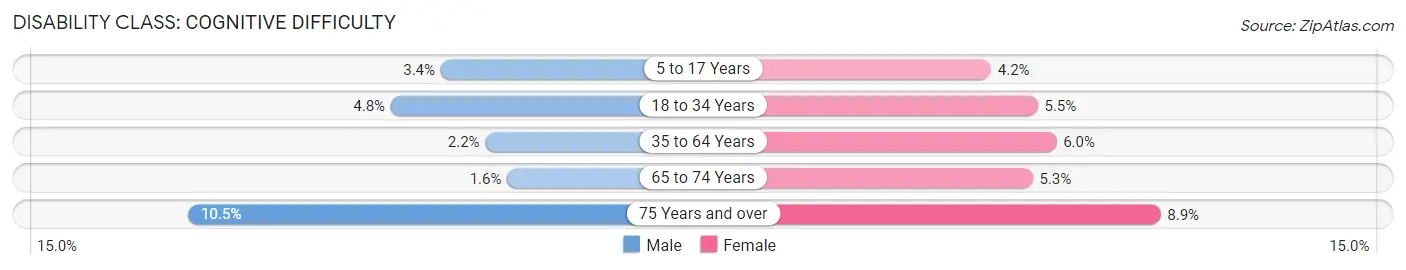
| Age Bracket | Male | Female |
| 5 to 17 Years | 95 (3.4%) | 116 (4.2%) |
| 18 to 34 Years | 131 (4.8%) | 136 (5.4%) |
| 35 to 64 Years | 91 (2.2%) | 271 (6.0%) |
| 65 to 74 Years | 13 (1.6%) | 56 (5.3%) |
| 75 Years and over | 79 (10.4%) | 108 (8.9%) |
Disability Class: Ambulatory Difficulty
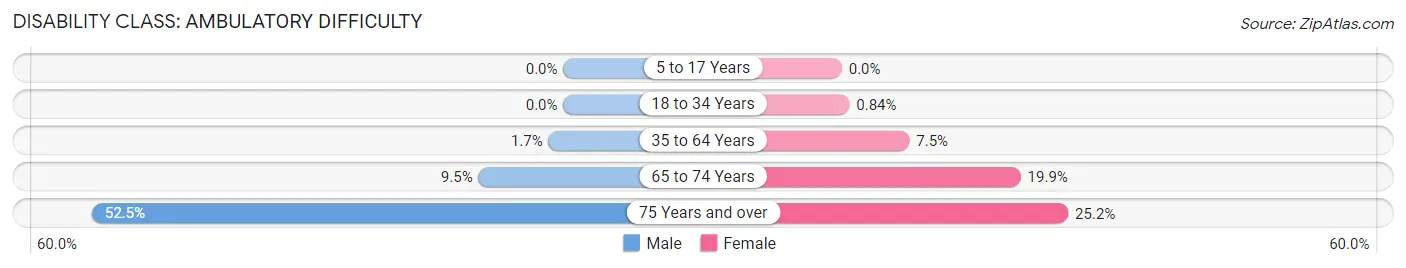
| Age Bracket | Male | Female |
| 5 to 17 Years | 0 (0.0%) | 0 (0.0%) |
| 18 to 34 Years | 0 (0.0%) | 21 (0.8%) |
| 35 to 64 Years | 69 (1.7%) | 341 (7.5%) |
| 65 to 74 Years | 79 (9.5%) | 210 (19.9%) |
| 75 Years and over | 397 (52.5%) | 307 (25.2%) |
Disability Class: Self-Care Difficulty
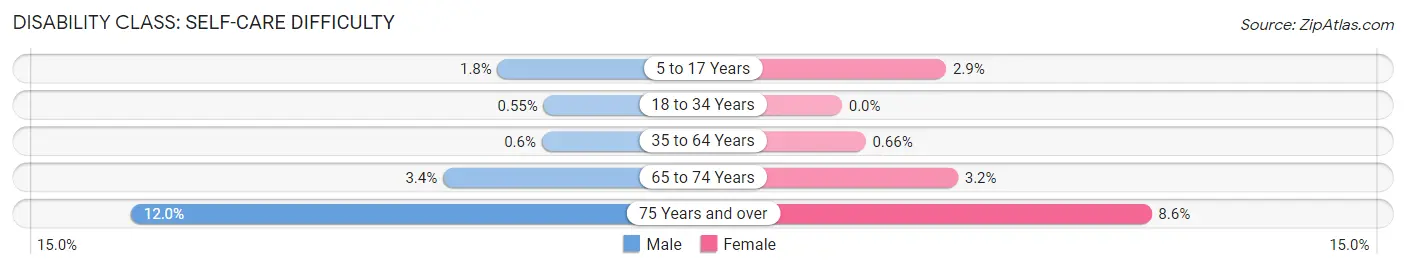
| Age Bracket | Male | Female |
| 5 to 17 Years | 51 (1.8%) | 81 (2.9%) |
| 18 to 34 Years | 15 (0.5%) | 0 (0.0%) |
| 35 to 64 Years | 25 (0.6%) | 30 (0.7%) |
| 65 to 74 Years | 28 (3.4%) | 34 (3.2%) |
| 75 Years and over | 91 (12.0%) | 105 (8.6%) |
Technology Access in Derby
Computing Device Access in Derby
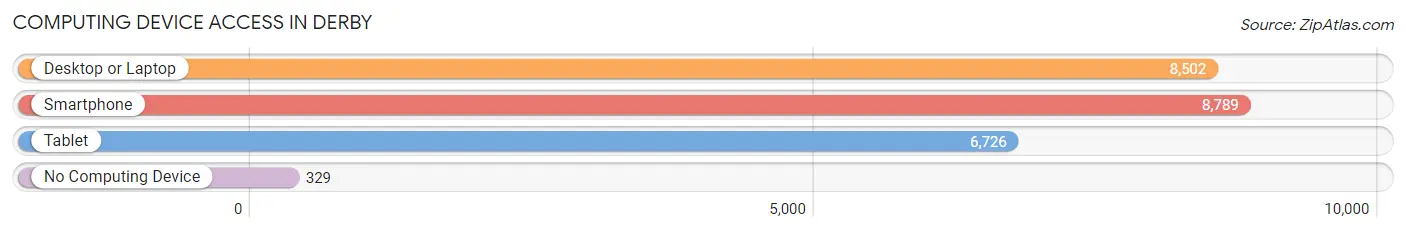
| Device Type | # Households | % Households |
| Desktop or Laptop | 8,502 | 84.8% |
| Smartphone | 8,789 | 87.6% |
| Tablet | 6,726 | 67.1% |
| No Computing Device | 329 | 3.3% |
| Total | 10,029 | 100.0% |
Internet Access in Derby
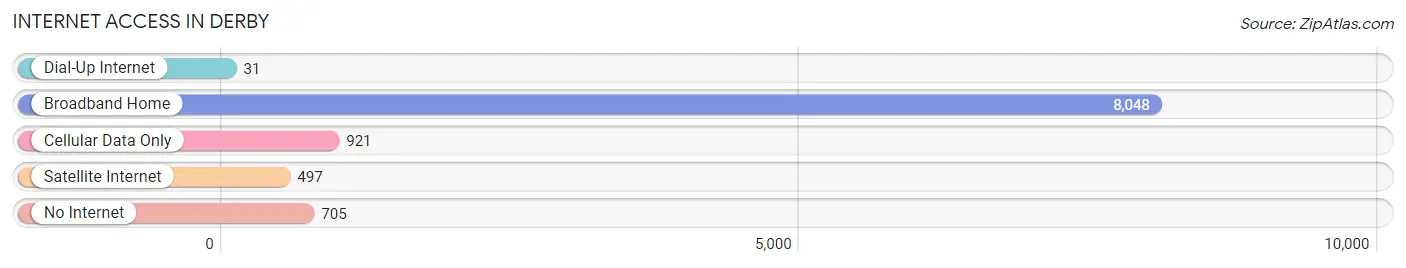
| Internet Type | # Households | % Households |
| Dial-Up Internet | 31 | 0.3% |
| Broadband Home | 8,048 | 80.2% |
| Cellular Data Only | 921 | 9.2% |
| Satellite Internet | 497 | 5.0% |
| No Internet | 705 | 7.0% |
| Total | 10,029 | 100.0% |
Derby Summary
Derby, Kansas is a city located in Sedgwick County, Kansas, United States. It is a suburb of Wichita and is part of the Wichita metropolitan area. As of the 2010 census, the city population was 22,158, making it the 20th largest city in the state.
History
Derby was founded in 1871 by settlers from the Osage Nation. The city was named after Derby, England, and was incorporated in 1879. The city was originally a farming community, but in the early 20th century, it began to develop into a manufacturing center. The city was home to the Derby Manufacturing Company, which produced farm equipment, and the Derby Carriage Works, which produced carriages and wagons.
In the 1950s, Derby began to experience rapid growth due to the expansion of the Wichita metropolitan area. The city was annexed by Wichita in 1964, but was reincorporated as an independent city in 1971.
Geography
Derby is located in south-central Kansas, at the intersection of U.S. Route 81 and U.S. Route 160. It is approximately 10 miles south of Wichita and is part of the Wichita metropolitan area. The city is situated on the Arkansas River, and is surrounded by rolling hills and farmland.
Climate
Derby has a humid subtropical climate, with hot, humid summers and cold, dry winters. The average annual temperature is 61°F, and the average annual precipitation is 33 inches.
Demographics
As of the 2010 census, there were 22,158 people, 8,072 households, and 5,845 families residing in the city. The population density was 1,845.3 people per square mile. The racial makeup of the city was 84.2% White, 8.2% African American, 0.7% Native American, 2.2% Asian, 0.1% Pacific Islander, 1.7% from other races, and 2.7% from two or more races. Hispanic or Latino of any race were 5.3% of the population.
Economy
Derby is home to a variety of businesses, including manufacturing, retail, and healthcare. The city is home to several large employers, including Spirit AeroSystems, Cessna Aircraft Company, and Boeing. The city is also home to several smaller businesses, including restaurants, shops, and service providers.
The city's economy is largely driven by the aerospace industry, which is centered in Wichita. The city is also home to several educational institutions, including the University of Kansas School of Medicine-Wichita, Wichita State University, and Butler Community College.
Conclusion
Derby, Kansas is a city located in Sedgwick County, Kansas, United States. It is a suburb of Wichita and is part of the Wichita metropolitan area. As of the 2010 census, the city population was 22,158, making it the 20th largest city in the state. Derby was founded in 1871 by settlers from the Osage Nation and has since developed into a manufacturing center. The city is situated on the Arkansas River and is surrounded by rolling hills and farmland. The city's economy is largely driven by the aerospace industry, which is centered in Wichita. Derby is home to a variety of businesses, including manufacturing, retail, and healthcare.
Common Questions
What is Per Capita Income in Derby?
Per Capita income in Derby is $38,246.
What is the Median Family Income in Derby?
Median Family Income in Derby is $93,991.
What is the Median Household income in Derby?
Median Household Income in Derby is $79,581.
What is Income or Wage Gap in Derby?
Income or Wage Gap in Derby is 41.8%.
Women in Derby earn 58.2 cents for every dollar earned by a man.
What is Family Income Deficit in Derby?
Family Income Deficit in Derby is $9,840.
Families that are below poverty line in Derby earn $9,840 less on average than the poverty threshold level.
What is Inequality or Gini Index in Derby?
Inequality or Gini Index in Derby is 0.38.
What is the Total Population of Derby?
Total Population of Derby is 25,551.
What is the Total Male Population of Derby?
Total Male Population of Derby is 12,761.
What is the Total Female Population of Derby?
Total Female Population of Derby is 12,790.
What is the Ratio of Males per 100 Females in Derby?
There are 99.77 Males per 100 Females in Derby.
What is the Ratio of Females per 100 Males in Derby?
There are 100.23 Females per 100 Males in Derby.
What is the Median Population Age in Derby?
Median Population Age in Derby is 35.4 Years.
What is the Average Family Size in Derby
Average Family Size in Derby is 3.2 People.
What is the Average Household Size in Derby
Average Household Size in Derby is 2.5 People.
How Large is the Labor Force in Derby?
There are 12,962 People in the Labor Forcein in Derby.
What is the Percentage of People in the Labor Force in Derby?
67.1% of People are in the Labor Force in Derby.
What is the Unemployment Rate in Derby?
Unemployment Rate in Derby is 4.0%.