Cheney, KS Map & Demographics
Cheney Map
Cheney Overview
$32,664
PER CAPITA INCOME
$96,250
AVG FAMILY INCOME
$70,598
AVG HOUSEHOLD INCOME
64.4%
WAGE / INCOME GAP [ % ]
35.6¢/ $1
WAGE / INCOME GAP [ $ ]
$4,331
FAMILY INCOME DEFICIT
0.46
INEQUALITY / GINI INDEX
2,380
TOTAL POPULATION
1,136
MALE POPULATION
1,244
FEMALE POPULATION
91.32
MALES / 100 FEMALES
109.51
FEMALES / 100 MALES
37.3
MEDIAN AGE
3.9
AVG FAMILY SIZE
3.0
AVG HOUSEHOLD SIZE
1,085
LABOR FORCE [ PEOPLE ]
60.8%
PERCENT IN LABOR FORCE
2.5%
UNEMPLOYMENT RATE
Cheney Zip Codes
Cheney Area Codes
Income in Cheney
Income Overview in Cheney
Per Capita Income in Cheney is $32,664, while median incomes of families and households are $96,250 and $70,598 respectively.
| Characteristic | Number | Measure |
| Per Capita Income | 2,380 | $32,664 |
| Median Family Income | 521 | $96,250 |
| Mean Family Income | 521 | $114,739 |
| Median Household Income | 769 | $70,598 |
| Mean Household Income | 769 | $95,729 |
| Income Deficit | 521 | $4,331 |
| Wage / Income Gap (%) | 2,380 | 64.43% |
| Wage / Income Gap ($) | 2,380 | 35.57¢ per $1 |
| Gini / Inequality Index | 2,380 | 0.46 |
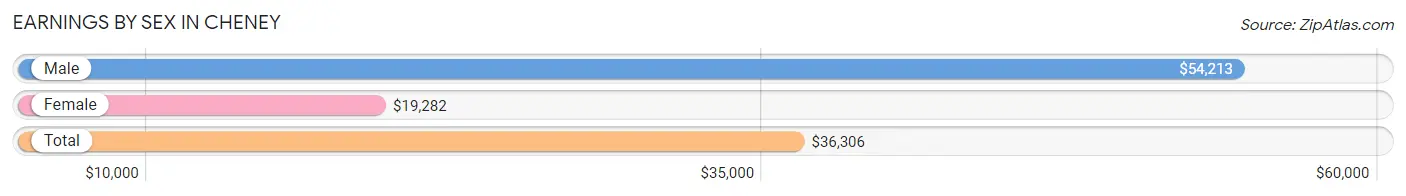
Earnings by Sex in Cheney
Average Earnings in Cheney are $36,306, $54,213 for men and $19,282 for women, a difference of 64.4%.
| Sex | Number | Average Earnings |
| Male | 603 (51.8%) | $54,213 |
| Female | 562 (48.2%) | $19,282 |
| Total | 1,165 (100.0%) | $36,306 |
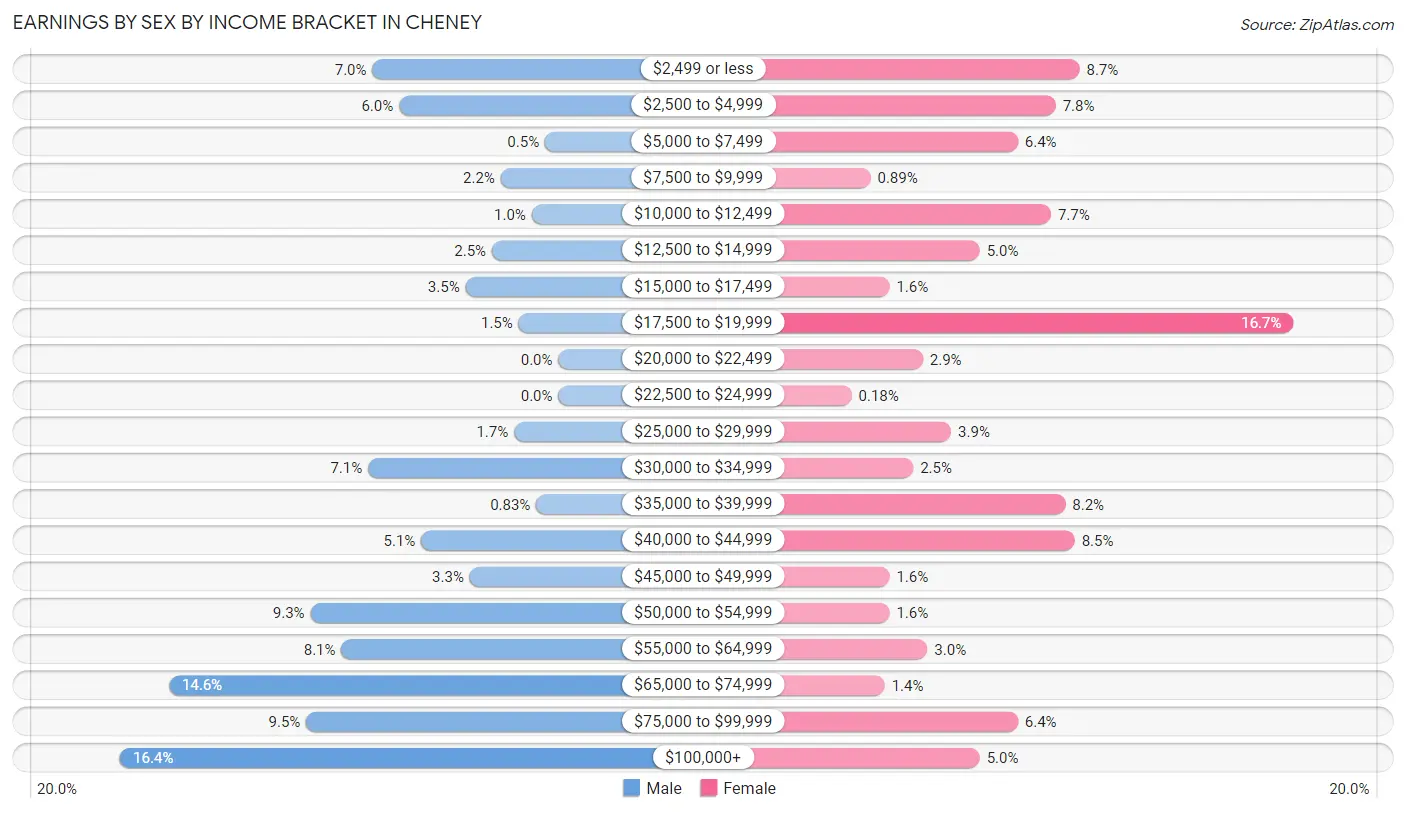
Earnings by Sex by Income Bracket in Cheney
The most common earnings brackets in Cheney are $100,000+ for men (99 | 16.4%) and $17,500 to $19,999 for women (94 | 16.7%).
| Income | Male | Female |
| $2,499 or less | 42 (7.0%) | 49 (8.7%) |
| $2,500 to $4,999 | 36 (6.0%) | 44 (7.8%) |
| $5,000 to $7,499 | 3 (0.5%) | 36 (6.4%) |
| $7,500 to $9,999 | 13 (2.2%) | 5 (0.9%) |
| $10,000 to $12,499 | 6 (1.0%) | 43 (7.6%) |
| $12,500 to $14,999 | 15 (2.5%) | 28 (5.0%) |
| $15,000 to $17,499 | 21 (3.5%) | 9 (1.6%) |
| $17,500 to $19,999 | 9 (1.5%) | 94 (16.7%) |
| $20,000 to $22,499 | 0 (0.0%) | 16 (2.9%) |
| $22,500 to $24,999 | 0 (0.0%) | 1 (0.2%) |
| $25,000 to $29,999 | 10 (1.7%) | 22 (3.9%) |
| $30,000 to $34,999 | 43 (7.1%) | 14 (2.5%) |
| $35,000 to $39,999 | 5 (0.8%) | 46 (8.2%) |
| $40,000 to $44,999 | 31 (5.1%) | 48 (8.5%) |
| $45,000 to $49,999 | 20 (3.3%) | 9 (1.6%) |
| $50,000 to $54,999 | 56 (9.3%) | 9 (1.6%) |
| $55,000 to $64,999 | 49 (8.1%) | 17 (3.0%) |
| $65,000 to $74,999 | 88 (14.6%) | 8 (1.4%) |
| $75,000 to $99,999 | 57 (9.5%) | 36 (6.4%) |
| $100,000+ | 99 (16.4%) | 28 (5.0%) |
| Total | 603 (100.0%) | 562 (100.0%) |
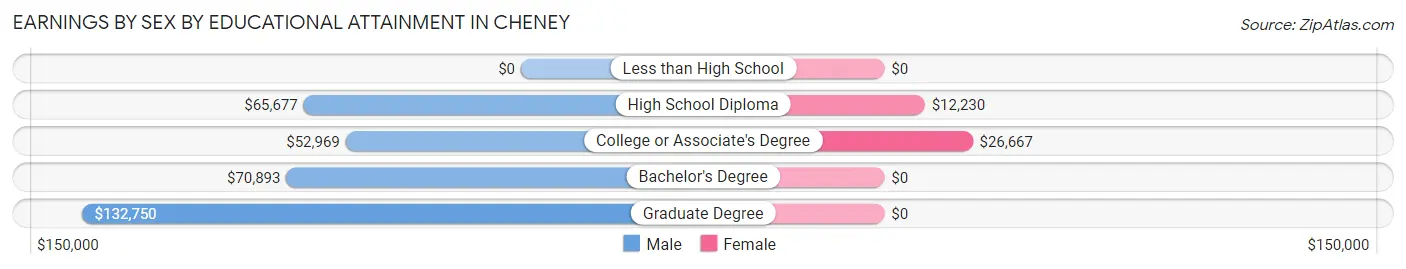
Earnings by Sex by Educational Attainment in Cheney
Average earnings in Cheney are $59,079 for men and $26,597 for women, a difference of 55.0%. Men with an educational attainment of graduate degree enjoy the highest average annual earnings of $132,750, while those with college or associate's degree education earn the least with $52,969. Women with an educational attainment of college or associate's degree earn the most with the average annual earnings of $26,667, while those with high school diploma education have the smallest earnings of $12,230.
| Educational Attainment | Male Income | Female Income |
| Less than High School | - | - |
| High School Diploma | $65,677 | $12,230 |
| College or Associate's Degree | $52,969 | $26,667 |
| Bachelor's Degree | $70,893 | $0 |
| Graduate Degree | $132,750 | $0 |
| Total | $59,079 | $26,597 |
Family Income in Cheney
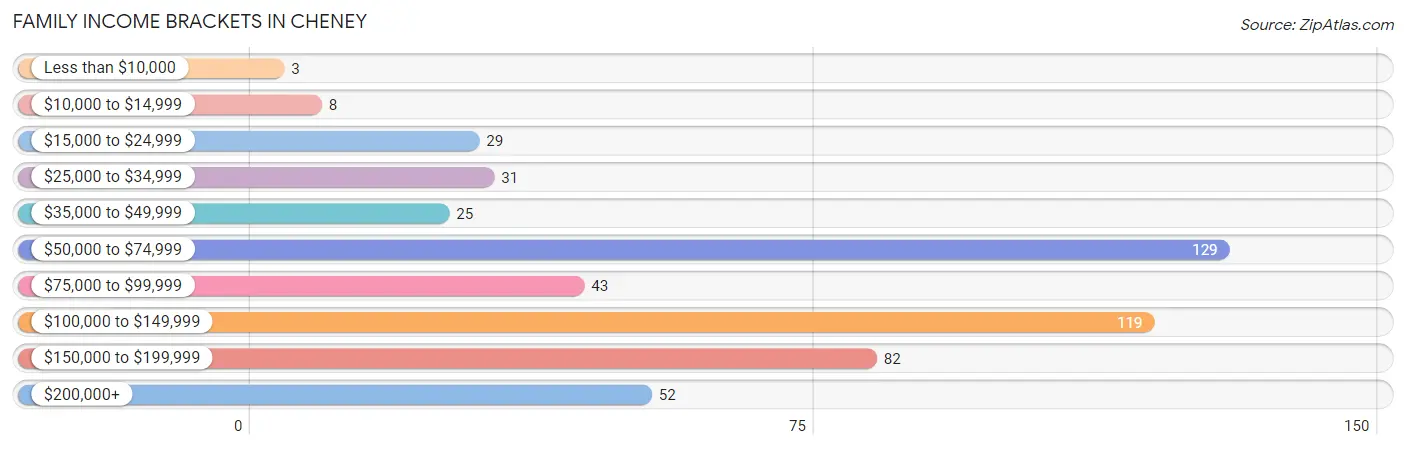
Family Income Brackets in Cheney
According to the Cheney family income data, there are 129 families falling into the $50,000 to $74,999 income range, which is the most common income bracket and makes up 24.8% of all families. Conversely, the less than $10,000 income bracket is the least frequent group with only 3 families (0.6%) belonging to this category.
| Income Bracket | # Families | % Families |
| Less than $10,000 | 3 | 0.6% |
| $10,000 to $14,999 | 8 | 1.5% |
| $15,000 to $24,999 | 29 | 5.6% |
| $25,000 to $34,999 | 31 | 6.0% |
| $35,000 to $49,999 | 25 | 4.8% |
| $50,000 to $74,999 | 129 | 24.8% |
| $75,000 to $99,999 | 43 | 8.3% |
| $100,000 to $149,999 | 119 | 22.8% |
| $150,000 to $199,999 | 82 | 15.7% |
| $200,000+ | 52 | 10.0% |
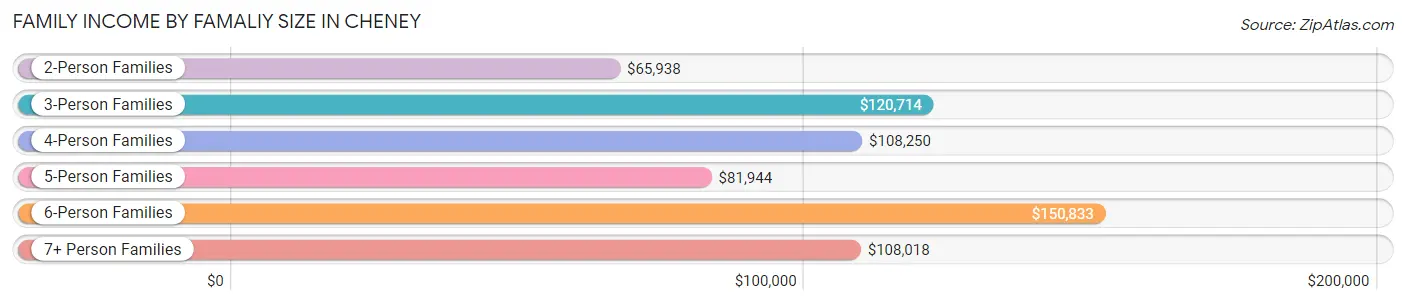
Family Income by Famaliy Size in Cheney
6-person families (16 | 3.1%) account for the highest median family income in Cheney with $150,833 per family, while 3-person families (106 | 20.3%) have the highest median income of $40,238 per family member.
| Income Bracket | # Families | Median Income |
| 2-Person Families | 207 (39.7%) | $65,938 |
| 3-Person Families | 106 (20.3%) | $120,714 |
| 4-Person Families | 49 (9.4%) | $108,250 |
| 5-Person Families | 78 (15.0%) | $81,944 |
| 6-Person Families | 16 (3.1%) | $150,833 |
| 7+ Person Families | 65 (12.5%) | $108,018 |
| Total | 521 (100.0%) | $96,250 |
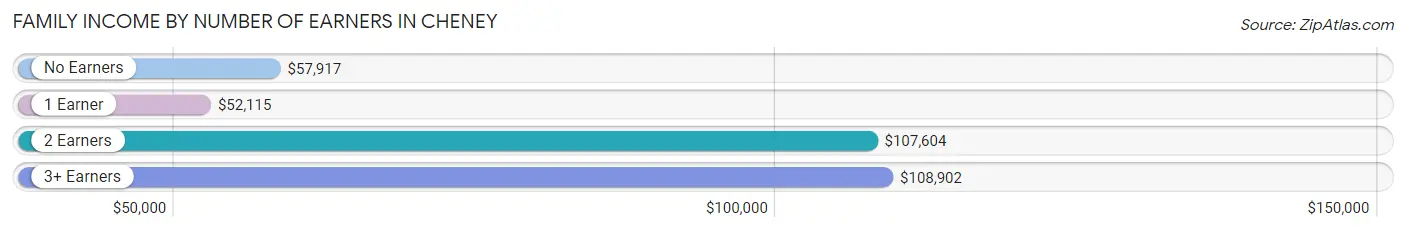
Family Income by Number of Earners in Cheney
The median family income in Cheney is $96,250, with families comprising 3+ earners (158) having the highest median family income of $108,902, while families with 1 earner (80) have the lowest median family income of $52,115, accounting for 30.3% and 15.4% of families, respectively.
| Number of Earners | # Families | Median Income |
| No Earners | 76 (14.6%) | $57,917 |
| 1 Earner | 80 (15.4%) | $52,115 |
| 2 Earners | 207 (39.7%) | $107,604 |
| 3+ Earners | 158 (30.3%) | $108,902 |
| Total | 521 (100.0%) | $96,250 |
Household Income in Cheney
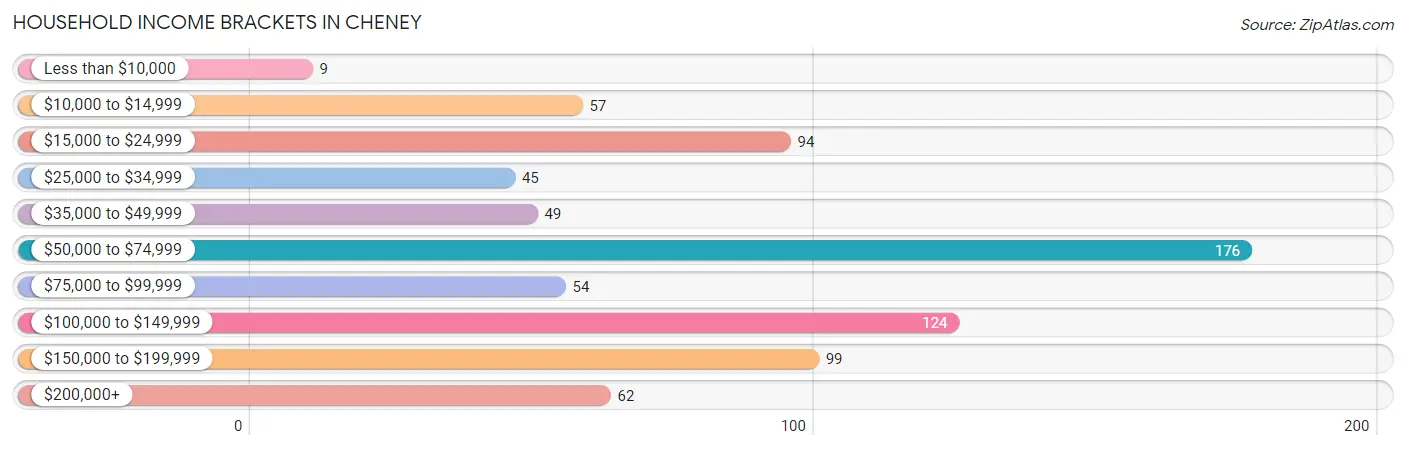
Household Income Brackets in Cheney
With 176 households falling in the category, the $50,000 to $74,999 income range is the most frequent in Cheney, accounting for 22.9% of all households. In contrast, only 9 households (1.2%) fall into the less than $10,000 income bracket, making it the least populous group.
| Income Bracket | # Households | % Households |
| Less than $10,000 | 9 | 1.2% |
| $10,000 to $14,999 | 57 | 7.4% |
| $15,000 to $24,999 | 94 | 12.2% |
| $25,000 to $34,999 | 45 | 5.9% |
| $35,000 to $49,999 | 49 | 6.4% |
| $50,000 to $74,999 | 176 | 22.9% |
| $75,000 to $99,999 | 54 | 7.0% |
| $100,000 to $149,999 | 124 | 16.1% |
| $150,000 to $199,999 | 99 | 12.9% |
| $200,000+ | 62 | 8.1% |
Household Income by Householder Age in Cheney
The median household income in Cheney is $70,598, with the highest median household income of $106,250 found in the 25 to 44 years age bracket for the primary householder. A total of 254 households (33.0%) fall into this category. Meanwhile, the 15 to 24 years age bracket for the primary householder has the lowest median household income of $0, with 6 households (0.8%) in this group.
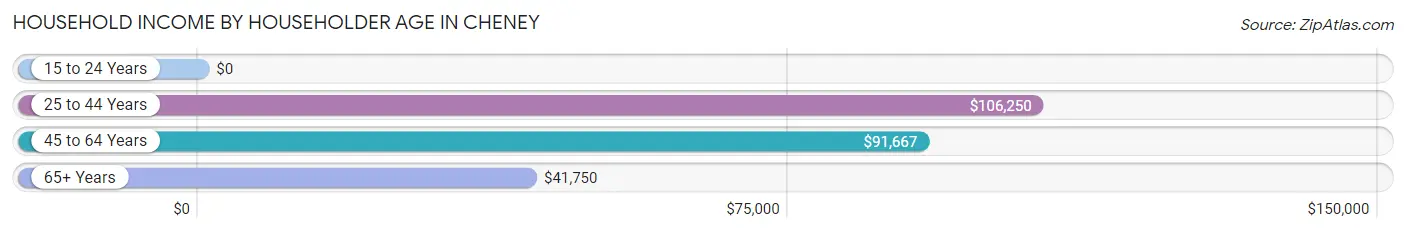
| Income Bracket | # Households | Median Income |
| 15 to 24 Years | 6 (0.8%) | $0 |
| 25 to 44 Years | 254 (33.0%) | $106,250 |
| 45 to 64 Years | 276 (35.9%) | $91,667 |
| 65+ Years | 233 (30.3%) | $41,750 |
| Total | 769 (100.0%) | $70,598 |
Poverty in Cheney
Income Below Poverty by Sex and Age in Cheney
With 5.8% poverty level for males and 15.8% for females among the residents of Cheney, 5 year old males and 75 year old and over females are the most vulnerable to poverty, with 9 males (34.6%) and 44 females (51.8%) in their respective age groups living below the poverty level.
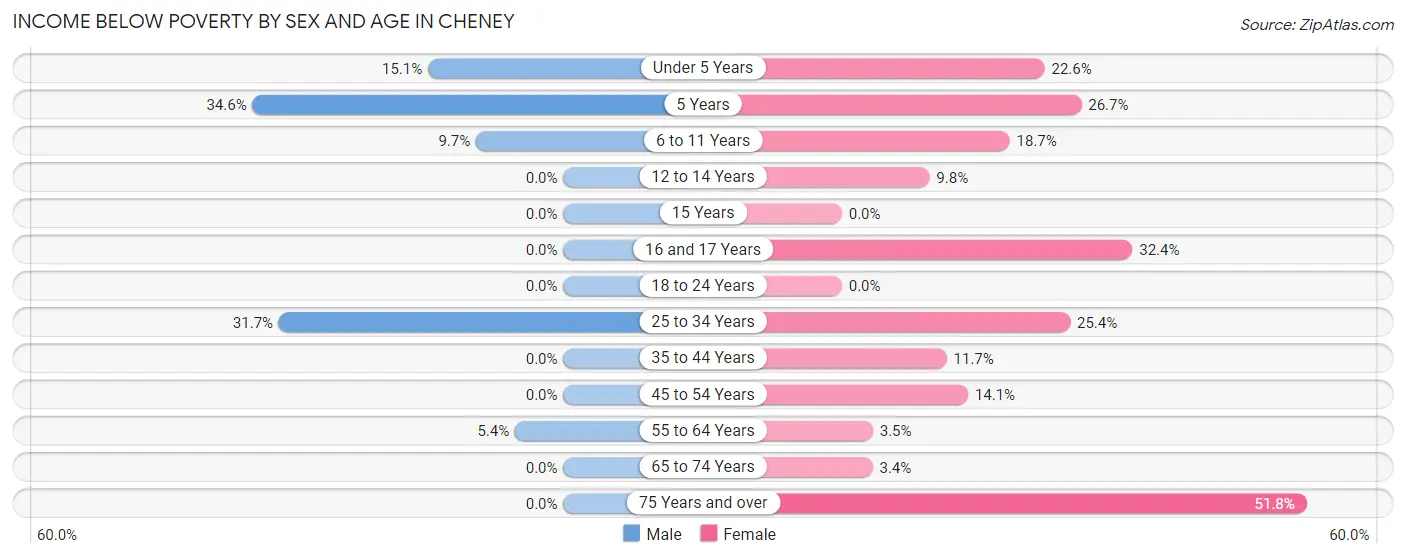
| Age Bracket | Male | Female |
| Under 5 Years | 11 (15.1%) | 14 (22.6%) |
| 5 Years | 9 (34.6%) | 8 (26.7%) |
| 6 to 11 Years | 7 (9.7%) | 20 (18.7%) |
| 12 to 14 Years | 0 (0.0%) | 8 (9.8%) |
| 15 Years | 0 (0.0%) | 0 (0.0%) |
| 16 and 17 Years | 0 (0.0%) | 11 (32.4%) |
| 18 to 24 Years | 0 (0.0%) | 0 (0.0%) |
| 25 to 34 Years | 32 (31.7%) | 30 (25.4%) |
| 35 to 44 Years | 0 (0.0%) | 21 (11.7%) |
| 45 to 54 Years | 0 (0.0%) | 26 (14.1%) |
| 55 to 64 Years | 5 (5.4%) | 3 (3.5%) |
| 65 to 74 Years | 0 (0.0%) | 4 (3.4%) |
| 75 Years and over | 0 (0.0%) | 44 (51.8%) |
| Total | 64 (5.8%) | 189 (15.8%) |
Income Above Poverty by Sex and Age in Cheney
According to the poverty statistics in Cheney, males aged 12 to 14 years and females aged 15 years are the age groups that are most secure financially, with 100.0% of males and 100.0% of females in these age groups living above the poverty line.
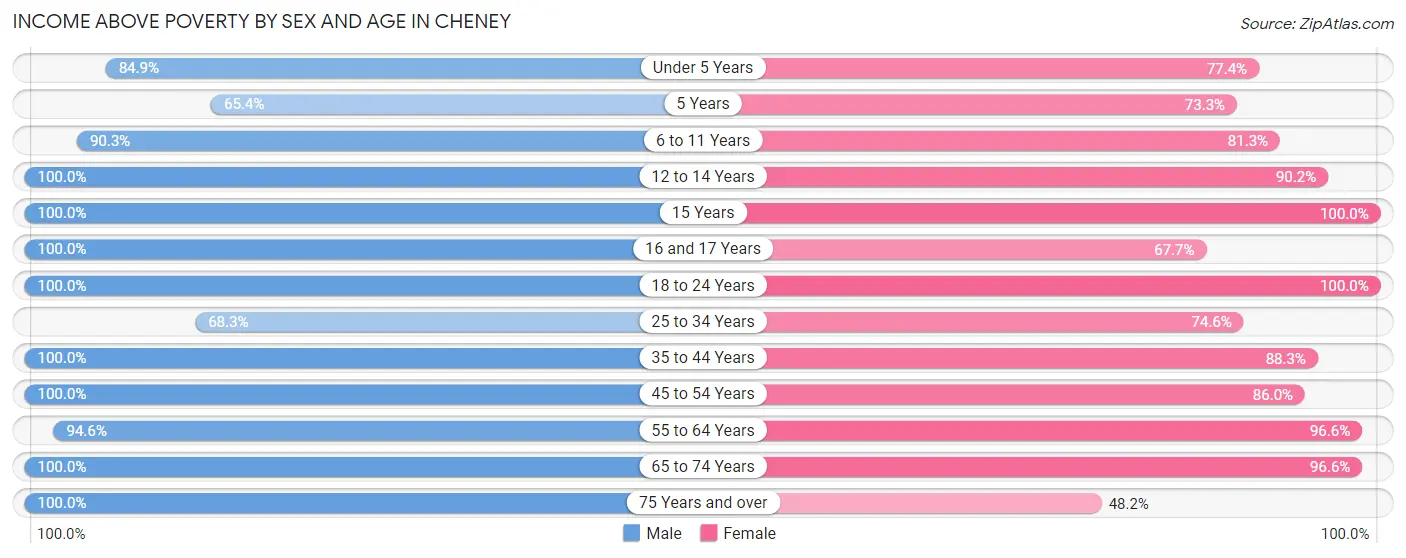
| Age Bracket | Male | Female |
| Under 5 Years | 62 (84.9%) | 48 (77.4%) |
| 5 Years | 17 (65.4%) | 22 (73.3%) |
| 6 to 11 Years | 65 (90.3%) | 87 (81.3%) |
| 12 to 14 Years | 58 (100.0%) | 74 (90.2%) |
| 15 Years | 47 (100.0%) | 9 (100.0%) |
| 16 and 17 Years | 77 (100.0%) | 23 (67.6%) |
| 18 to 24 Years | 83 (100.0%) | 97 (100.0%) |
| 25 to 34 Years | 69 (68.3%) | 88 (74.6%) |
| 35 to 44 Years | 199 (100.0%) | 159 (88.3%) |
| 45 to 54 Years | 129 (100.0%) | 159 (86.0%) |
| 55 to 64 Years | 88 (94.6%) | 84 (96.6%) |
| 65 to 74 Years | 103 (100.0%) | 113 (96.6%) |
| 75 Years and over | 46 (100.0%) | 41 (48.2%) |
| Total | 1,043 (94.2%) | 1,004 (84.2%) |
Income Below Poverty Among Married-Couple Families in Cheney
The poverty statistics for married-couple families in Cheney show that 3.3% or 14 of the total 428 families live below the poverty line. Families with 3 or 4 children have the highest poverty rate of 12.7%, comprising of 8 families. On the other hand, families with 5 or more children have the lowest poverty rate of 0.0%, which includes 0 families.
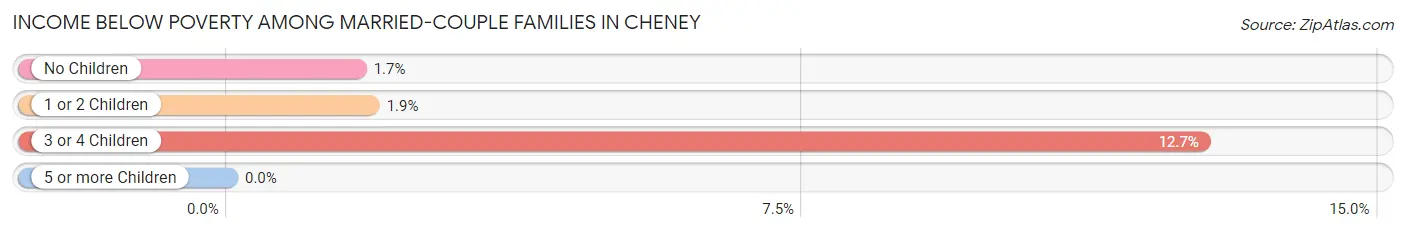
| Children | Above Poverty | Below Poverty |
| No Children | 176 (98.3%) | 3 (1.7%) |
| 1 or 2 Children | 159 (98.2%) | 3 (1.8%) |
| 3 or 4 Children | 55 (87.3%) | 8 (12.7%) |
| 5 or more Children | 24 (100.0%) | 0 (0.0%) |
| Total | 414 (96.7%) | 14 (3.3%) |
Income Below Poverty Among Single-Parent Households in Cheney
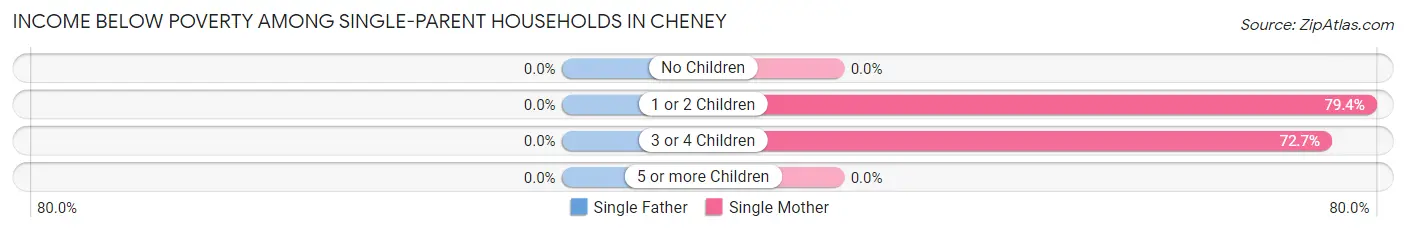
| Children | Single Father | Single Mother |
| No Children | 0 (0.0%) | 0 (0.0%) |
| 1 or 2 Children | 0 (0.0%) | 27 (79.4%) |
| 3 or 4 Children | 0 (0.0%) | 8 (72.7%) |
| 5 or more Children | 0 (0.0%) | 0 (0.0%) |
| Total | 0 (0.0%) | 35 (42.2%) |
Income Below Poverty Among Married-Couple vs Single-Parent Households in Cheney
The poverty data for Cheney shows that 14 of the married-couple family households (3.3%) and 35 of the single-parent households (37.6%) are living below the poverty level. Within the married-couple family households, those with 3 or 4 children have the highest poverty rate, with 8 households (12.7%) falling below the poverty line. Among the single-parent households, those with 1 or 2 children have the highest poverty rate, with 27 household (79.4%) living below poverty.
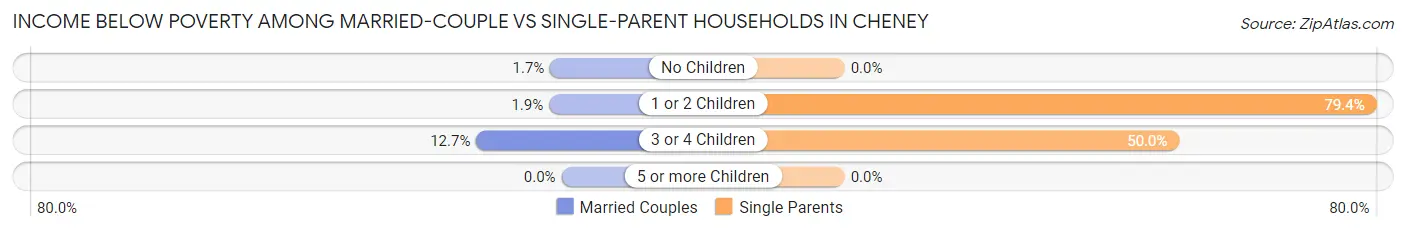
| Children | Married-Couple Families | Single-Parent Households |
| No Children | 3 (1.7%) | 0 (0.0%) |
| 1 or 2 Children | 3 (1.8%) | 27 (79.4%) |
| 3 or 4 Children | 8 (12.7%) | 8 (50.0%) |
| 5 or more Children | 0 (0.0%) | 0 (0.0%) |
| Total | 14 (3.3%) | 35 (37.6%) |
Race in Cheney
The most populous races in Cheney are White / Caucasian (2,294 | 96.4%), Hispanic or Latino (104 | 4.4%), and Two or more Races (34 | 1.4%).
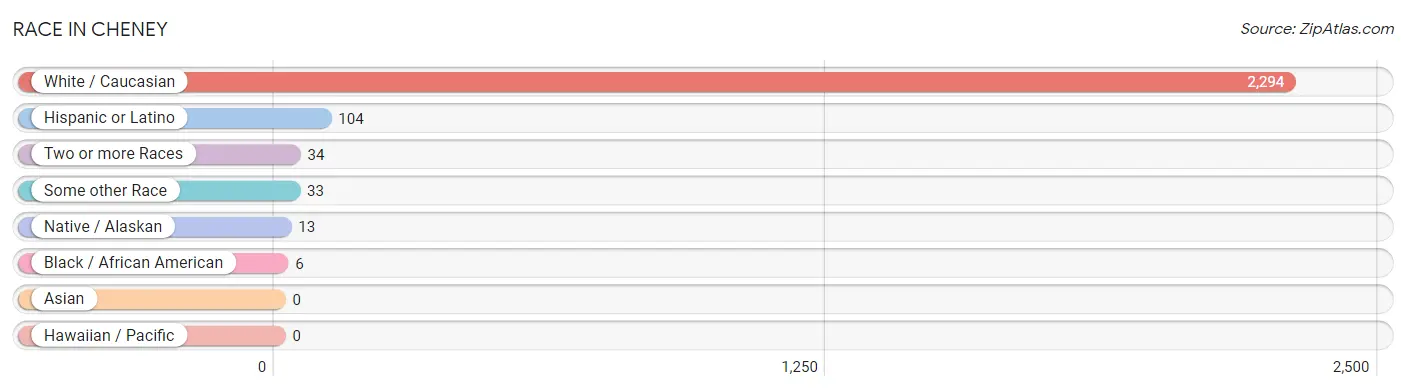
| Race | # Population | % Population |
| Asian | 0 | 0.0% |
| Black / African American | 6 | 0.3% |
| Hawaiian / Pacific | 0 | 0.0% |
| Hispanic or Latino | 104 | 4.4% |
| Native / Alaskan | 13 | 0.5% |
| White / Caucasian | 2,294 | 96.4% |
| Two or more Races | 34 | 1.4% |
| Some other Race | 33 | 1.4% |
| Total | 2,380 | 100.0% |
Ancestry in Cheney
The most populous ancestries reported in Cheney are German (811 | 34.1%), Irish (424 | 17.8%), English (266 | 11.2%), American (94 | 4.0%), and Dutch (82 | 3.5%), together accounting for 70.5% of all Cheney residents.
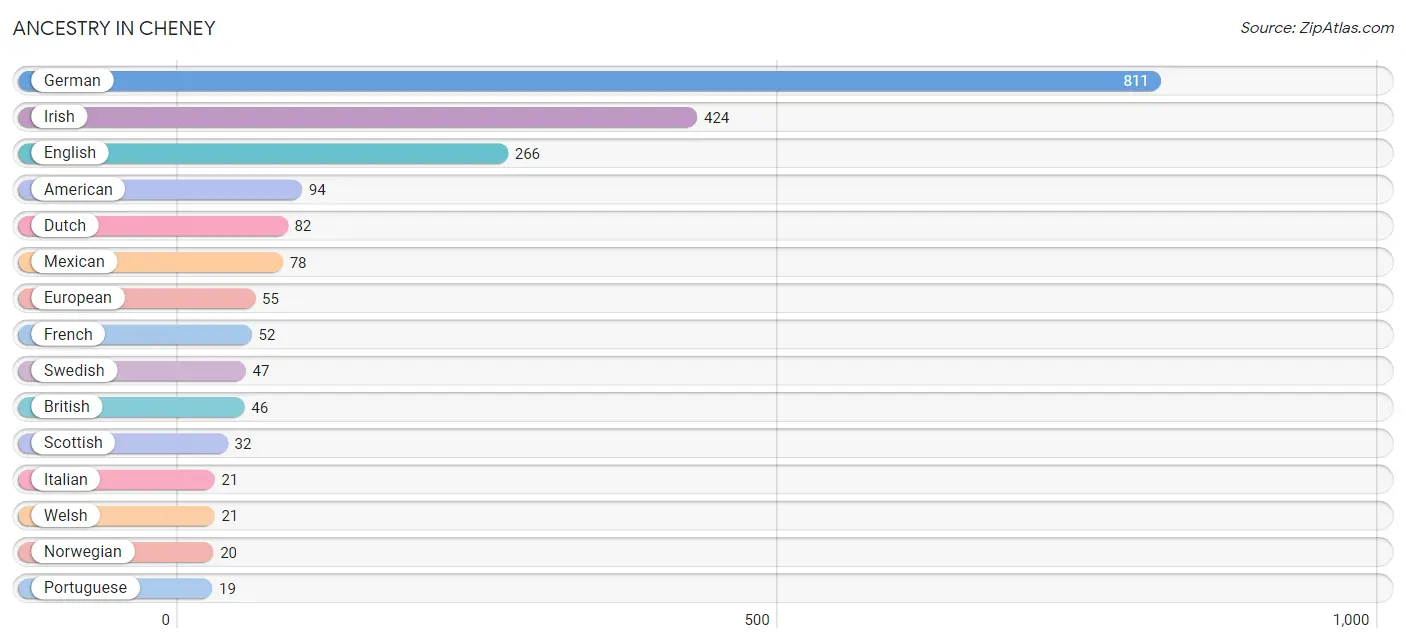
| Ancestry | # Population | % Population |
| American | 94 | 4.0% |
| Austrian | 11 | 0.5% |
| British | 46 | 1.9% |
| Canadian | 5 | 0.2% |
| Cherokee | 14 | 0.6% |
| Creek | 13 | 0.5% |
| Cuban | 12 | 0.5% |
| Czech | 6 | 0.3% |
| Danish | 4 | 0.2% |
| Dutch | 82 | 3.5% |
| English | 266 | 11.2% |
| European | 55 | 2.3% |
| French | 52 | 2.2% |
| French Canadian | 5 | 0.2% |
| German | 811 | 34.1% |
| Irish | 424 | 17.8% |
| Italian | 21 | 0.9% |
| Luxembourger | 4 | 0.2% |
| Mexican | 78 | 3.3% |
| Norwegian | 20 | 0.8% |
| Polish | 9 | 0.4% |
| Portuguese | 19 | 0.8% |
| Russian | 12 | 0.5% |
| Scotch-Irish | 5 | 0.2% |
| Scottish | 32 | 1.3% |
| Spaniard | 2 | 0.1% |
| Swedish | 47 | 2.0% |
| Ukrainian | 7 | 0.3% |
| Welsh | 21 | 0.9% | View All 29 Rows |
Immigrants in Cheney

| Immigration Origin | # Population | % Population | View All 0 Rows |
Sex and Age in Cheney
Sex and Age in Cheney
The most populous age groups in Cheney are 15 to 19 Years (202 | 17.8%) for men and 45 to 49 Years (144 | 11.6%) for women.
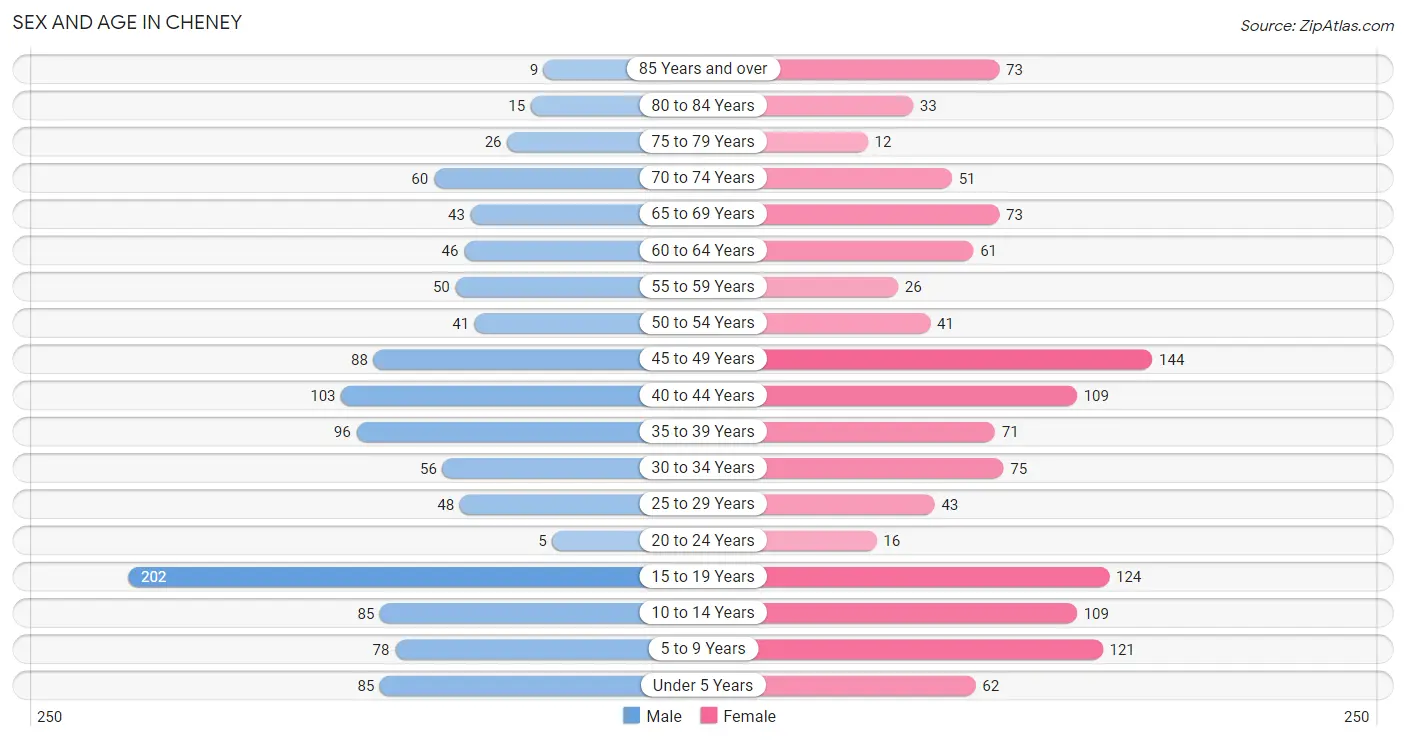
| Age Bracket | Male | Female |
| Under 5 Years | 85 (7.5%) | 62 (5.0%) |
| 5 to 9 Years | 78 (6.9%) | 121 (9.7%) |
| 10 to 14 Years | 85 (7.5%) | 109 (8.8%) |
| 15 to 19 Years | 202 (17.8%) | 124 (10.0%) |
| 20 to 24 Years | 5 (0.4%) | 16 (1.3%) |
| 25 to 29 Years | 48 (4.2%) | 43 (3.5%) |
| 30 to 34 Years | 56 (4.9%) | 75 (6.0%) |
| 35 to 39 Years | 96 (8.5%) | 71 (5.7%) |
| 40 to 44 Years | 103 (9.1%) | 109 (8.8%) |
| 45 to 49 Years | 88 (7.7%) | 144 (11.6%) |
| 50 to 54 Years | 41 (3.6%) | 41 (3.3%) |
| 55 to 59 Years | 50 (4.4%) | 26 (2.1%) |
| 60 to 64 Years | 46 (4.1%) | 61 (4.9%) |
| 65 to 69 Years | 43 (3.8%) | 73 (5.9%) |
| 70 to 74 Years | 60 (5.3%) | 51 (4.1%) |
| 75 to 79 Years | 26 (2.3%) | 12 (1.0%) |
| 80 to 84 Years | 15 (1.3%) | 33 (2.6%) |
| 85 Years and over | 9 (0.8%) | 73 (5.9%) |
| Total | 1,136 (100.0%) | 1,244 (100.0%) |
Families and Households in Cheney
Median Family Size in Cheney
The median family size in Cheney is 3.85 persons per family, with married-couple families (428 | 82.2%) accounting for the largest median family size of 4.05 persons per family. On the other hand, single female/mother families (83 | 15.9%) represent the smallest median family size with 2.88 persons per family.
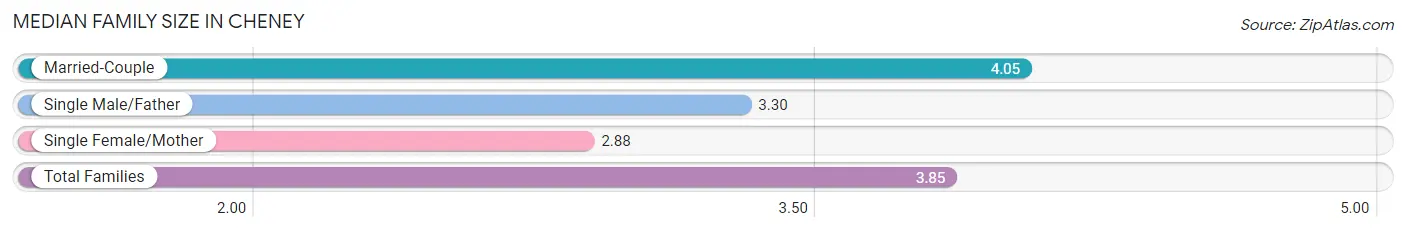
| Family Type | # Families | Family Size |
| Married-Couple | 428 (82.2%) | 4.05 |
| Single Male/Father | 10 (1.9%) | 3.30 |
| Single Female/Mother | 83 (15.9%) | 2.88 |
| Total Families | 521 (100.0%) | 3.85 |
Median Household Size in Cheney
The median household size in Cheney is 3.03 persons per household, with married-couple households (428 | 55.7%) accounting for the largest median household size of 4.1 persons per household. non-family households (248 | 32.3%) represent the smallest median household size with 1.20 persons per household.
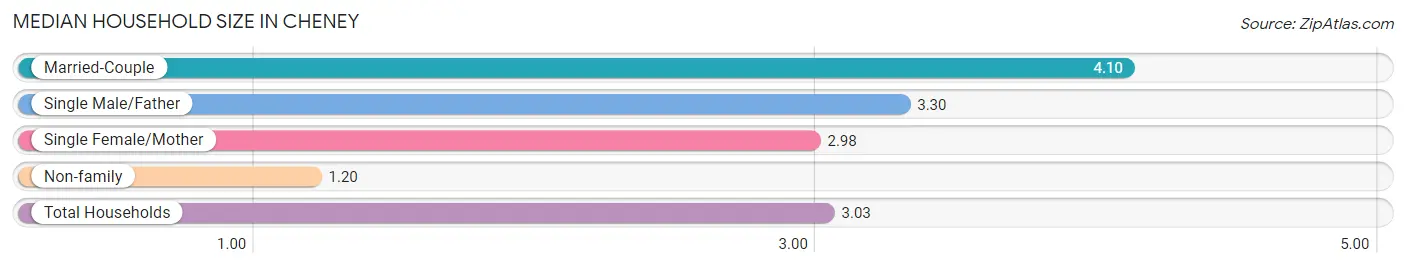
| Household Type | # Households | Household Size |
| Married-Couple | 428 (55.7%) | 4.10 |
| Single Male/Father | 10 (1.3%) | 3.30 |
| Single Female/Mother | 83 (10.8%) | 2.98 |
| Non-family | 248 (32.3%) | 1.20 |
| Total Households | 769 (100.0%) | 3.03 |
Household Size by Marriage Status in Cheney
Out of a total of 769 households in Cheney, 521 (67.7%) are family households, while 248 (32.3%) are nonfamily households. The most numerous type of family households are 2-person households, comprising 200, and the most common type of nonfamily households are 1-person households, comprising 218.
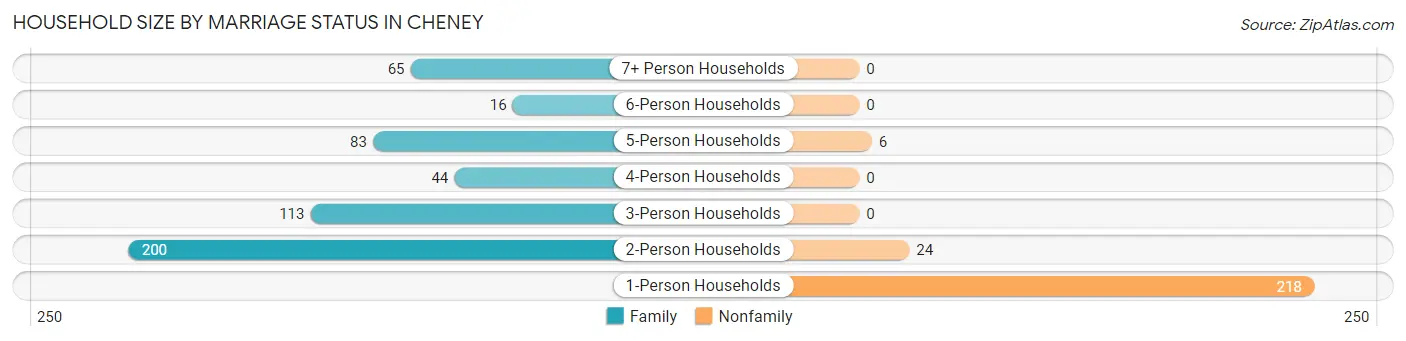
| Household Size | Family Households | Nonfamily Households |
| 1-Person Households | - | 218 (28.3%) |
| 2-Person Households | 200 (26.0%) | 24 (3.1%) |
| 3-Person Households | 113 (14.7%) | 0 (0.0%) |
| 4-Person Households | 44 (5.7%) | 0 (0.0%) |
| 5-Person Households | 83 (10.8%) | 6 (0.8%) |
| 6-Person Households | 16 (2.1%) | 0 (0.0%) |
| 7+ Person Households | 65 (8.5%) | 0 (0.0%) |
| Total | 521 (67.7%) | 248 (32.3%) |
Female Fertility in Cheney
Fertility by Age in Cheney
Average fertility rate in Cheney is 34.0 births per 1,000 women. Women in the age bracket of 20 to 34 years have the highest fertility rate with 149.0 births per 1,000 women. Women in the age bracket of 20 to 34 years acount for 100.0% of all women with births.
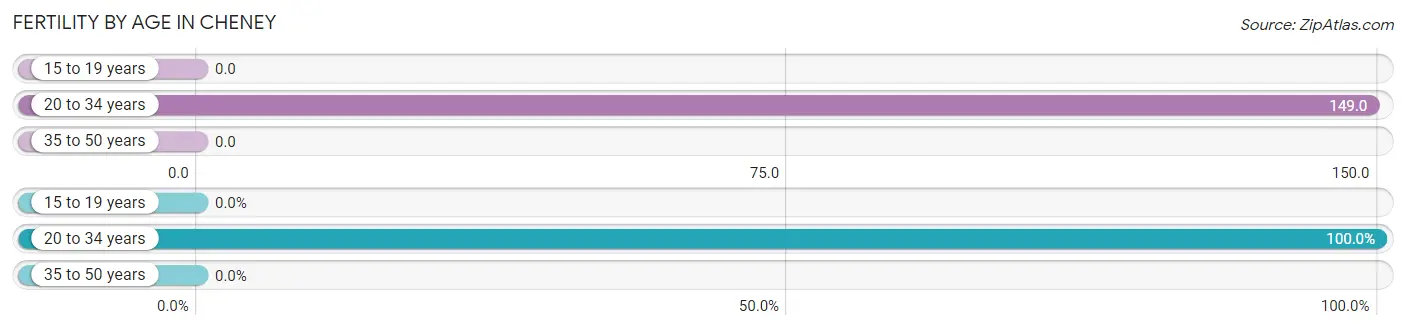
| Age Bracket | Women with Births | Births / 1,000 Women |
| 15 to 19 years | 0 (0.0%) | 0.0 |
| 20 to 34 years | 20 (100.0%) | 149.0 |
| 35 to 50 years | 0 (0.0%) | 0.0 |
| Total | 20 (100.0%) | 34.0 |
Fertility by Age by Marriage Status in Cheney
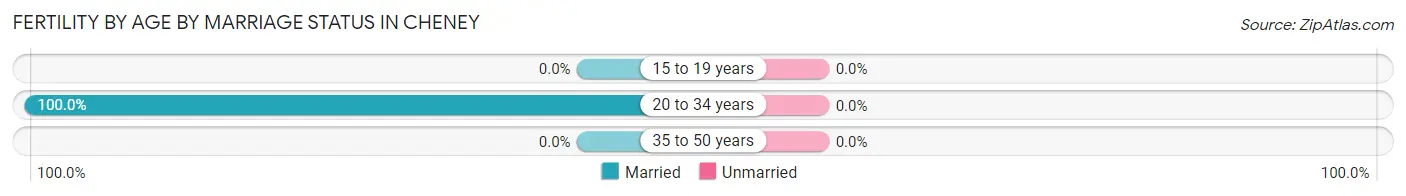
| Age Bracket | Married | Unmarried |
| 15 to 19 years | 0 (0.0%) | 0 (0.0%) |
| 20 to 34 years | 20 (100.0%) | 0 (0.0%) |
| 35 to 50 years | 0 (0.0%) | 0 (0.0%) |
| Total | 20 (100.0%) | 0 (0.0%) |
Fertility by Education in Cheney
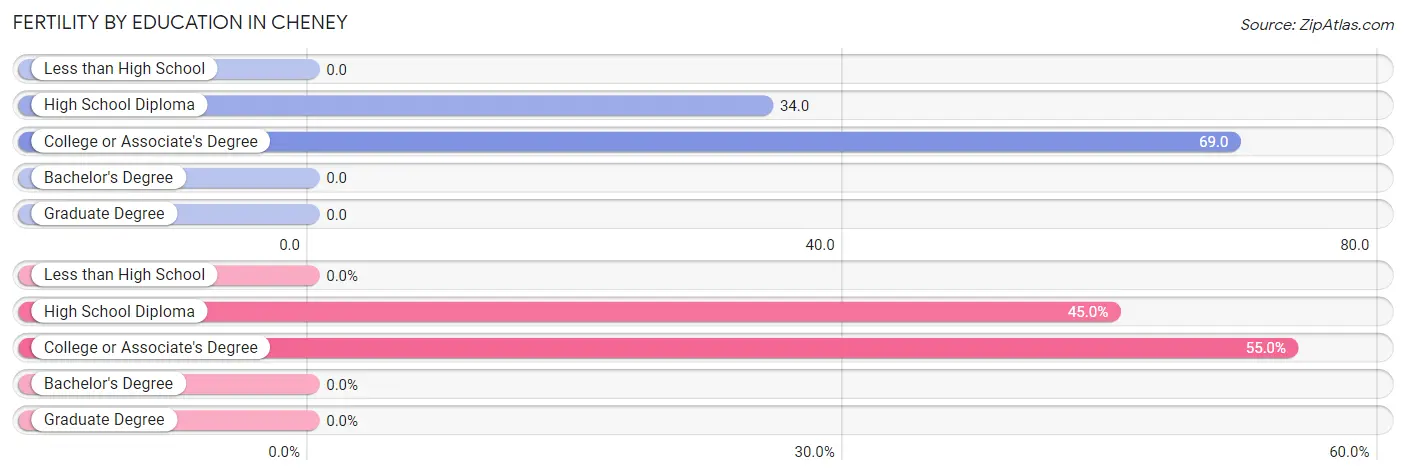
| Educational Attainment | Women with Births | Births / 1,000 Women |
| Less than High School | 0 (0.0%) | 0.0 |
| High School Diploma | 9 (45.0%) | 34.0 |
| College or Associate's Degree | 11 (55.0%) | 69.0 |
| Bachelor's Degree | 0 (0.0%) | 0.0 |
| Graduate Degree | 0 (0.0%) | 0.0 |
| Total | 20 (100.0%) | 34.0 |
Fertility by Education by Marriage Status in Cheney
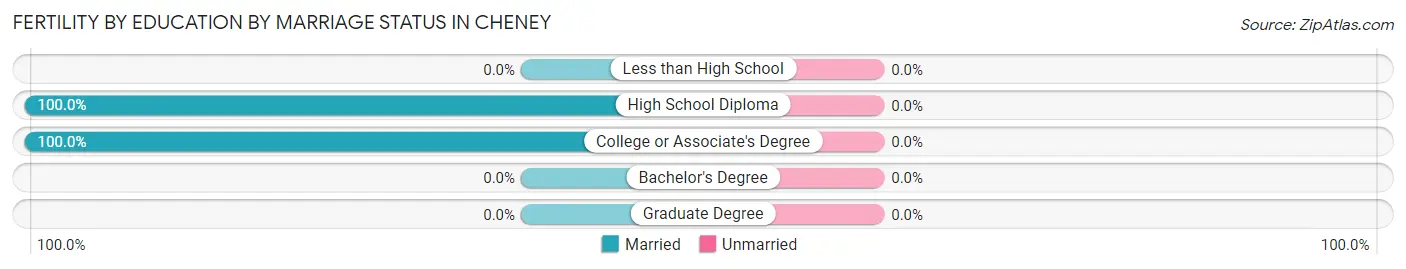
| Educational Attainment | Married | Unmarried |
| Less than High School | 0 (0.0%) | 0 (0.0%) |
| High School Diploma | 9 (100.0%) | 0 (0.0%) |
| College or Associate's Degree | 11 (100.0%) | 0 (0.0%) |
| Bachelor's Degree | 0 (0.0%) | 0 (0.0%) |
| Graduate Degree | 0 (0.0%) | 0 (0.0%) |
| Total | 20 (100.0%) | 0 (0.0%) |
Employment Characteristics in Cheney
Employment by Class of Employer in Cheney
Among the 1,052 employed individuals in Cheney, private company employees (698 | 66.3%), local government employees (177 | 16.8%), and self-employed (not incorporated) (58 | 5.5%) make up the most common classes of employment.
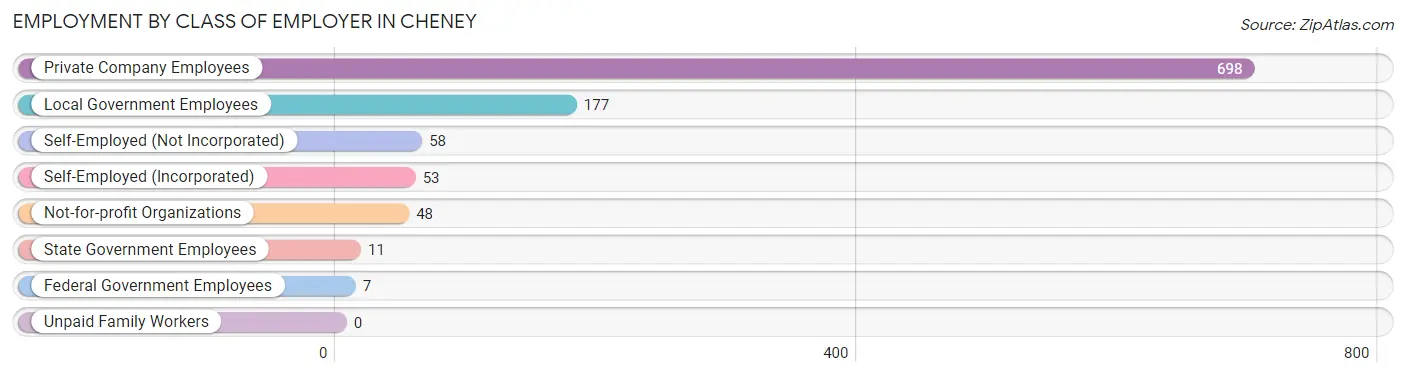
| Employer Class | # Employees | % Employees |
| Private Company Employees | 698 | 66.3% |
| Self-Employed (Incorporated) | 53 | 5.0% |
| Self-Employed (Not Incorporated) | 58 | 5.5% |
| Not-for-profit Organizations | 48 | 4.6% |
| Local Government Employees | 177 | 16.8% |
| State Government Employees | 11 | 1.1% |
| Federal Government Employees | 7 | 0.7% |
| Unpaid Family Workers | 0 | 0.0% |
| Total | 1,052 | 100.0% |
Employment Status by Age in Cheney
According to the labor force statistics for Cheney, out of the total population over 16 years of age (1,784), 60.8% or 1,085 individuals are in the labor force, with 2.5% or 27 of them unemployed. The age group with the highest labor force participation rate is 20 to 24 years, with 100.0% or 21 individuals in the labor force. Within the labor force, the 16 to 19 years age range has the highest percentage of unemployed individuals, with 8.4% or 13 of them being unemployed.
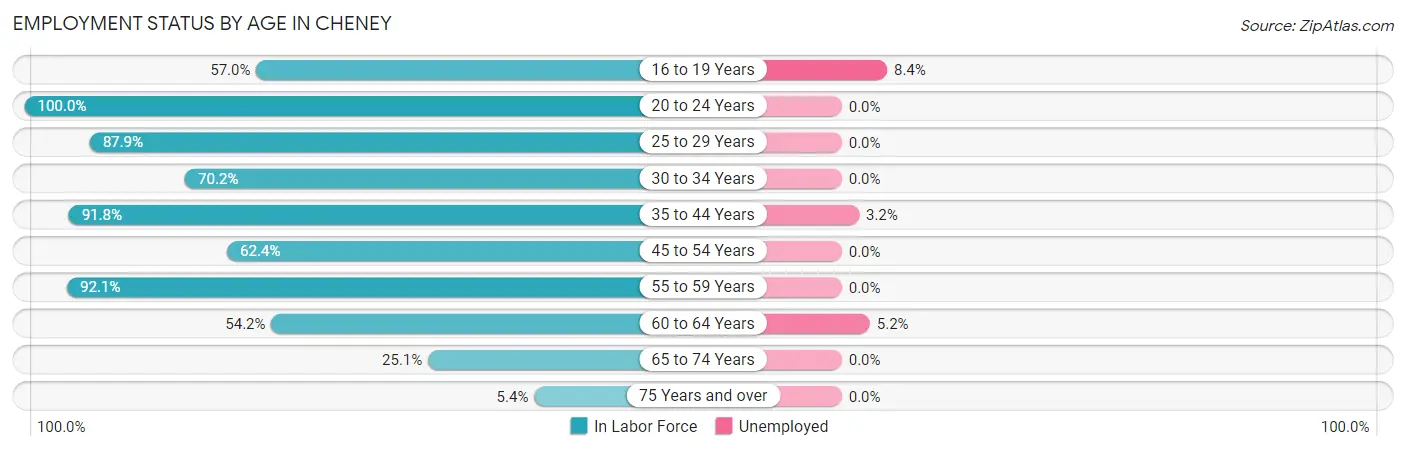
| Age Bracket | In Labor Force | Unemployed |
| 16 to 19 Years | 154 (57.0%) | 13 (8.4%) |
| 20 to 24 Years | 21 (100.0%) | 0 (0.0%) |
| 25 to 29 Years | 80 (87.9%) | 0 (0.0%) |
| 30 to 34 Years | 92 (70.2%) | 0 (0.0%) |
| 35 to 44 Years | 348 (91.8%) | 11 (3.2%) |
| 45 to 54 Years | 196 (62.4%) | 0 (0.0%) |
| 55 to 59 Years | 70 (92.1%) | 0 (0.0%) |
| 60 to 64 Years | 58 (54.2%) | 3 (5.2%) |
| 65 to 74 Years | 57 (25.1%) | 0 (0.0%) |
| 75 Years and over | 9 (5.4%) | 0 (0.0%) |
| Total | 1,085 (60.8%) | 27 (2.5%) |
Employment Status by Educational Attainment in Cheney
According to labor force statistics for Cheney, 76.9% of individuals (844) out of the total population between 25 and 64 years of age (1,098) are in the labor force, with 1.7% or 14 of them being unemployed. The group with the highest labor force participation rate are those with the educational attainment of bachelor's degree or higher, with 85.2% or 231 individuals in the labor force. Within the labor force, individuals with less than high school education have the highest percentage of unemployment, with 14.3% or 3 of them being unemployed.
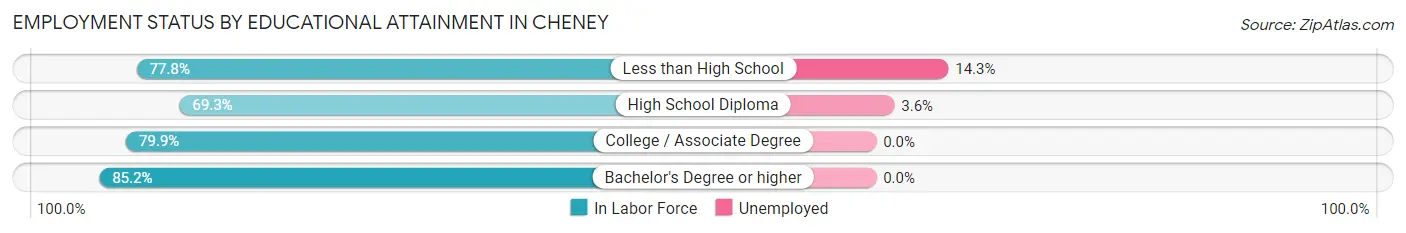
| Educational Attainment | In Labor Force | Unemployed |
| Less than High School | 21 (77.8%) | 4 (14.3%) |
| High School Diploma | 309 (69.3%) | 16 (3.6%) |
| College / Associate Degree | 283 (79.9%) | 0 (0.0%) |
| Bachelor's Degree or higher | 231 (85.2%) | 0 (0.0%) |
| Total | 844 (76.9%) | 19 (1.7%) |
Employment Occupations by Sex in Cheney
Management, Business, Science and Arts Occupations
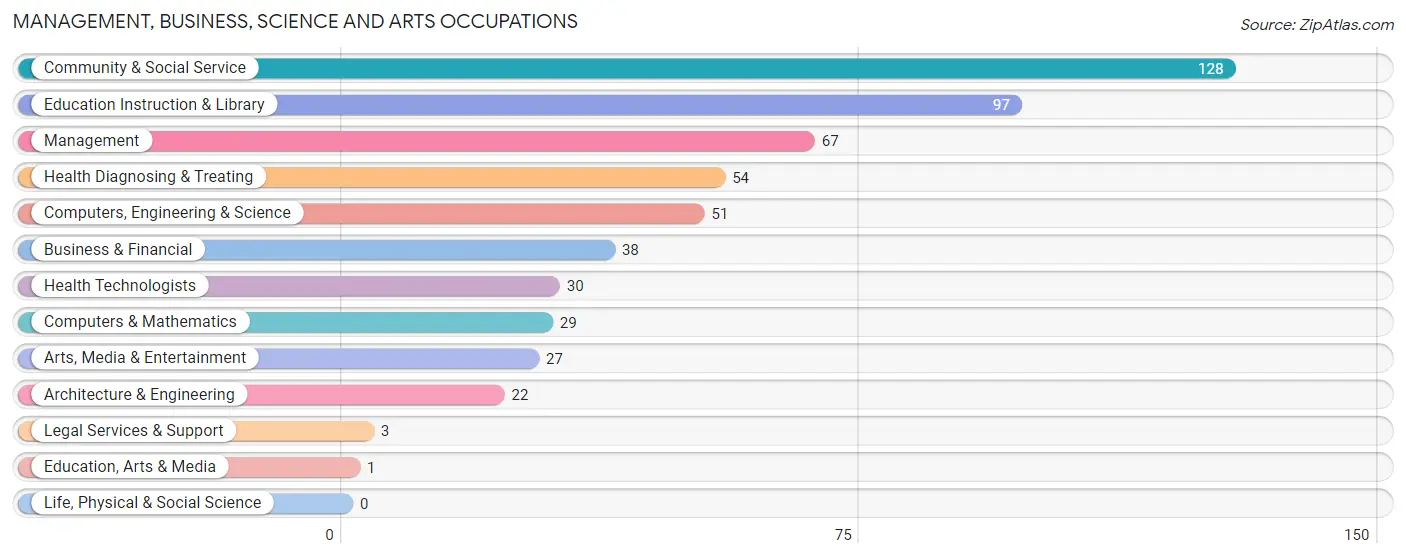
The most common Management, Business, Science and Arts occupations in Cheney are Community & Social Service (128 | 12.1%), Education Instruction & Library (97 | 9.2%), Management (67 | 6.3%), Health Diagnosing & Treating (54 | 5.1%), and Computers, Engineering & Science (51 | 4.8%).
Management, Business, Science and Arts Occupations by Sex
Within the Management, Business, Science and Arts occupations in Cheney, the most male-oriented occupations are Architecture & Engineering (100.0%), Computers, Engineering & Science (90.2%), and Computers & Mathematics (82.8%), while the most female-oriented occupations are Business & Financial (100.0%), Education, Arts & Media (100.0%), and Legal Services & Support (100.0%).
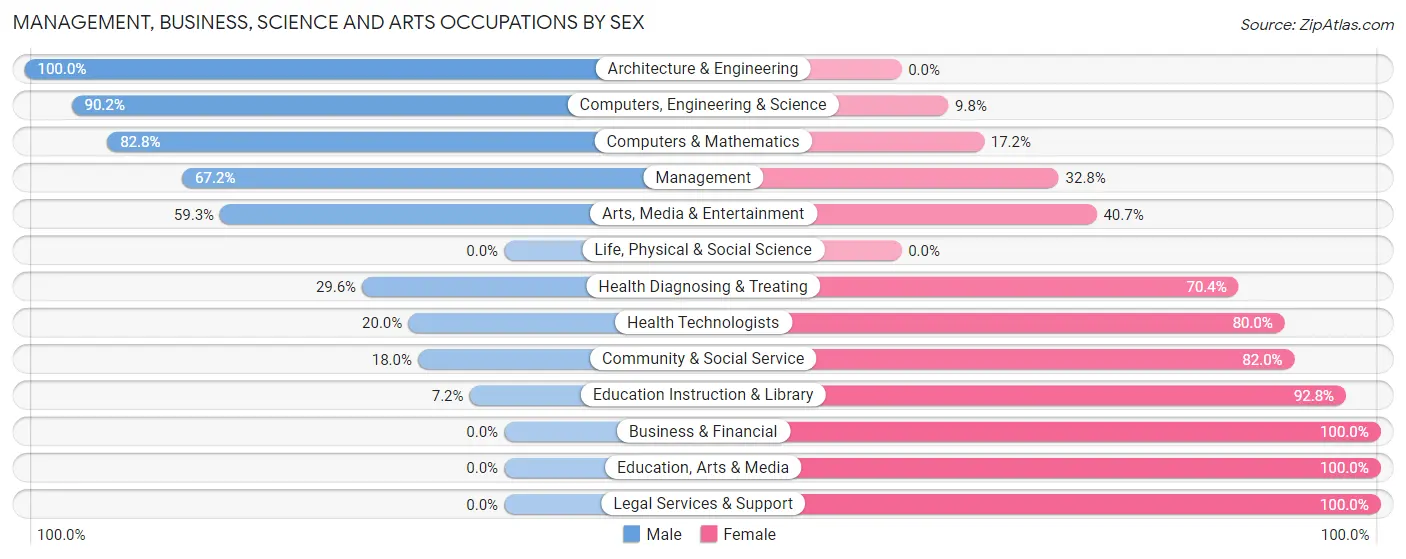
| Occupation | Male | Female |
| Management | 45 (67.2%) | 22 (32.8%) |
| Business & Financial | 0 (0.0%) | 38 (100.0%) |
| Computers, Engineering & Science | 46 (90.2%) | 5 (9.8%) |
| Computers & Mathematics | 24 (82.8%) | 5 (17.2%) |
| Architecture & Engineering | 22 (100.0%) | 0 (0.0%) |
| Life, Physical & Social Science | 0 (0.0%) | 0 (0.0%) |
| Community & Social Service | 23 (18.0%) | 105 (82.0%) |
| Education, Arts & Media | 0 (0.0%) | 1 (100.0%) |
| Legal Services & Support | 0 (0.0%) | 3 (100.0%) |
| Education Instruction & Library | 7 (7.2%) | 90 (92.8%) |
| Arts, Media & Entertainment | 16 (59.3%) | 11 (40.7%) |
| Health Diagnosing & Treating | 16 (29.6%) | 38 (70.4%) |
| Health Technologists | 6 (20.0%) | 24 (80.0%) |
| Total (Category) | 130 (38.5%) | 208 (61.5%) |
| Total (Overall) | 565 (53.4%) | 493 (46.6%) |
Services Occupations
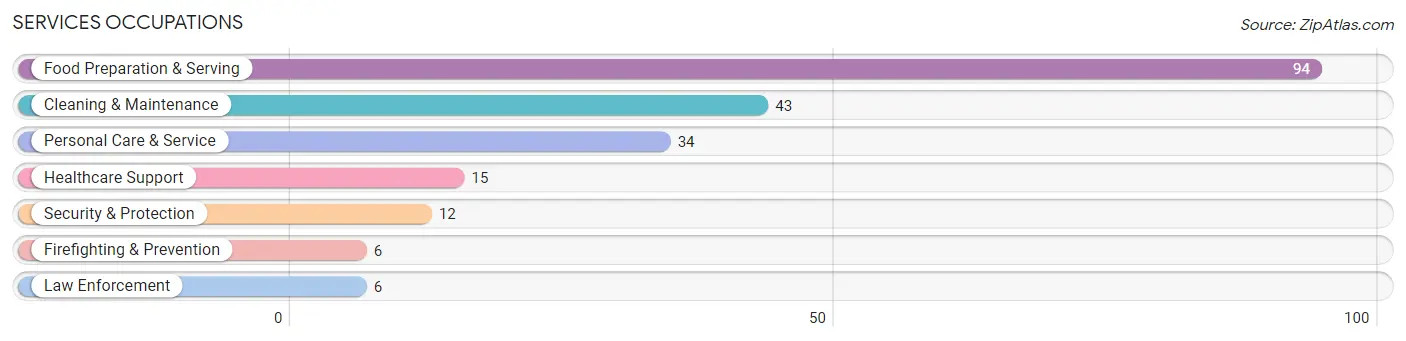
The most common Services occupations in Cheney are Food Preparation & Serving (94 | 8.9%), Cleaning & Maintenance (43 | 4.1%), Personal Care & Service (34 | 3.2%), Healthcare Support (15 | 1.4%), and Security & Protection (12 | 1.1%).
Services Occupations by Sex
Within the Services occupations in Cheney, the most male-oriented occupations are Firefighting & Prevention (100.0%), Cleaning & Maintenance (90.7%), and Security & Protection (50.0%), while the most female-oriented occupations are Healthcare Support (100.0%), Law Enforcement (100.0%), and Personal Care & Service (94.1%).
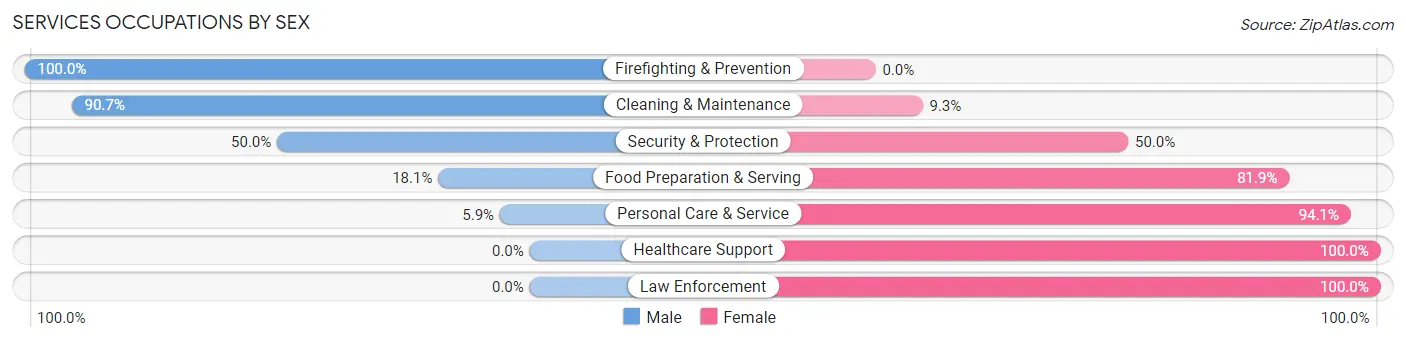
| Occupation | Male | Female |
| Healthcare Support | 0 (0.0%) | 15 (100.0%) |
| Security & Protection | 6 (50.0%) | 6 (50.0%) |
| Firefighting & Prevention | 6 (100.0%) | 0 (0.0%) |
| Law Enforcement | 0 (0.0%) | 6 (100.0%) |
| Food Preparation & Serving | 17 (18.1%) | 77 (81.9%) |
| Cleaning & Maintenance | 39 (90.7%) | 4 (9.3%) |
| Personal Care & Service | 2 (5.9%) | 32 (94.1%) |
| Total (Category) | 64 (32.3%) | 134 (67.7%) |
| Total (Overall) | 565 (53.4%) | 493 (46.6%) |
Sales and Office Occupations
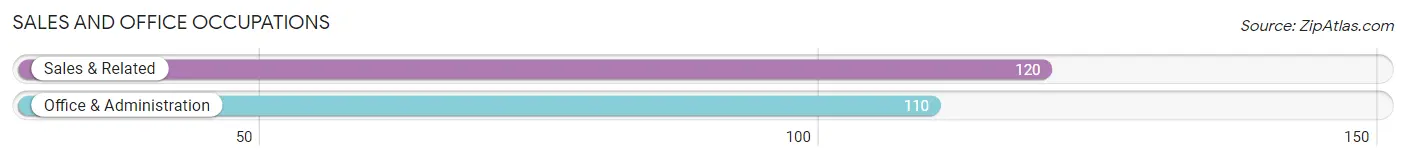
The most common Sales and Office occupations in Cheney are Sales & Related (120 | 11.3%), and Office & Administration (110 | 10.4%).
Sales and Office Occupations by Sex
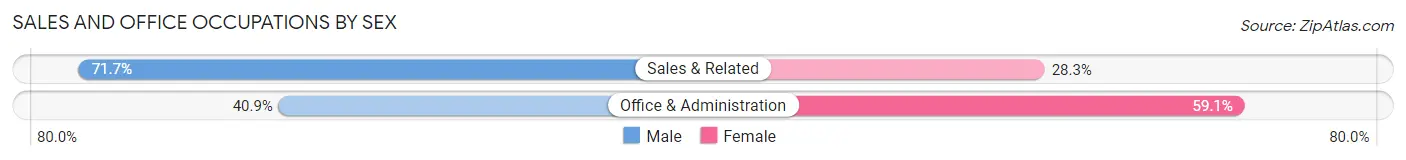
| Occupation | Male | Female |
| Sales & Related | 86 (71.7%) | 34 (28.3%) |
| Office & Administration | 45 (40.9%) | 65 (59.1%) |
| Total (Category) | 131 (57.0%) | 99 (43.0%) |
| Total (Overall) | 565 (53.4%) | 493 (46.6%) |
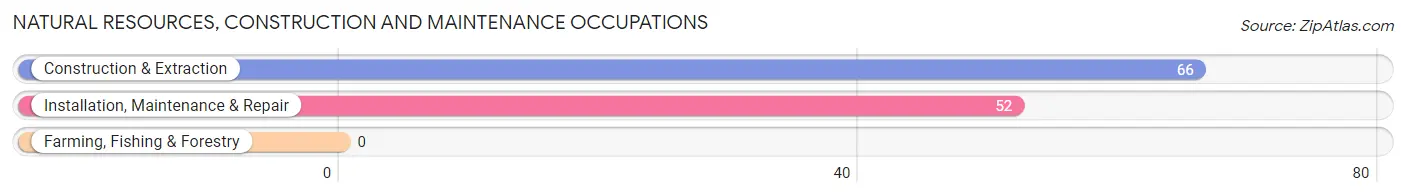
Natural Resources, Construction and Maintenance Occupations
The most common Natural Resources, Construction and Maintenance occupations in Cheney are Construction & Extraction (66 | 6.2%), and Installation, Maintenance & Repair (52 | 4.9%).
Natural Resources, Construction and Maintenance Occupations by Sex
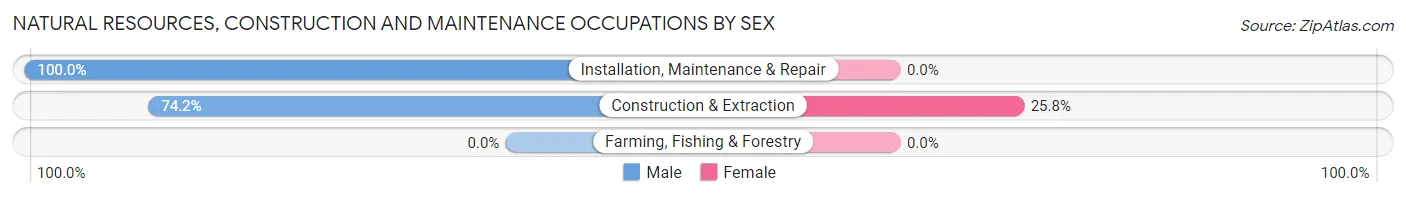
| Occupation | Male | Female |
| Farming, Fishing & Forestry | 0 (0.0%) | 0 (0.0%) |
| Construction & Extraction | 49 (74.2%) | 17 (25.8%) |
| Installation, Maintenance & Repair | 52 (100.0%) | 0 (0.0%) |
| Total (Category) | 101 (85.6%) | 17 (14.4%) |
| Total (Overall) | 565 (53.4%) | 493 (46.6%) |
Production, Transportation and Moving Occupations
The most common Production, Transportation and Moving occupations in Cheney are Production (116 | 11.0%), Transportation (33 | 3.1%), and Material Moving (25 | 2.4%).
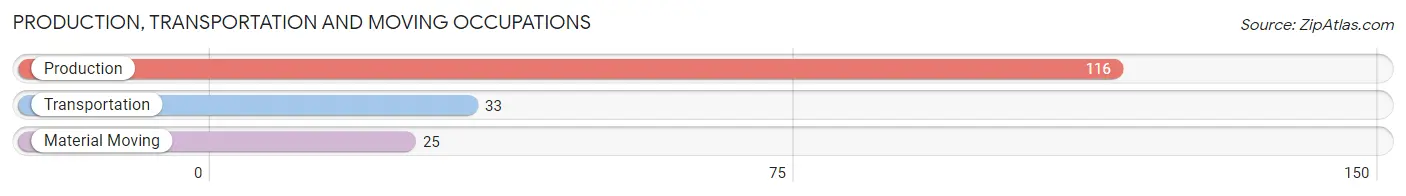
Production, Transportation and Moving Occupations by Sex
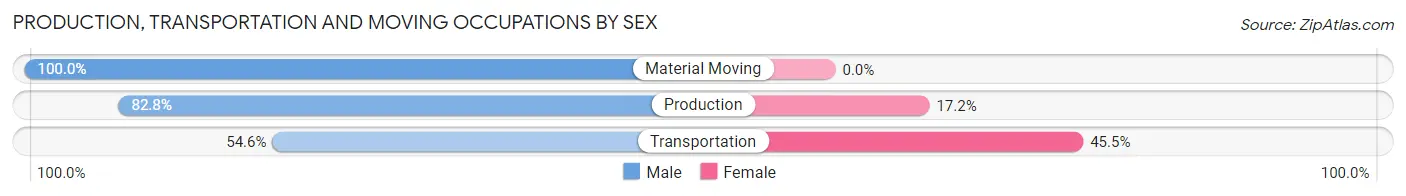
| Occupation | Male | Female |
| Production | 96 (82.8%) | 20 (17.2%) |
| Transportation | 18 (54.5%) | 15 (45.5%) |
| Material Moving | 25 (100.0%) | 0 (0.0%) |
| Total (Category) | 139 (79.9%) | 35 (20.1%) |
| Total (Overall) | 565 (53.4%) | 493 (46.6%) |
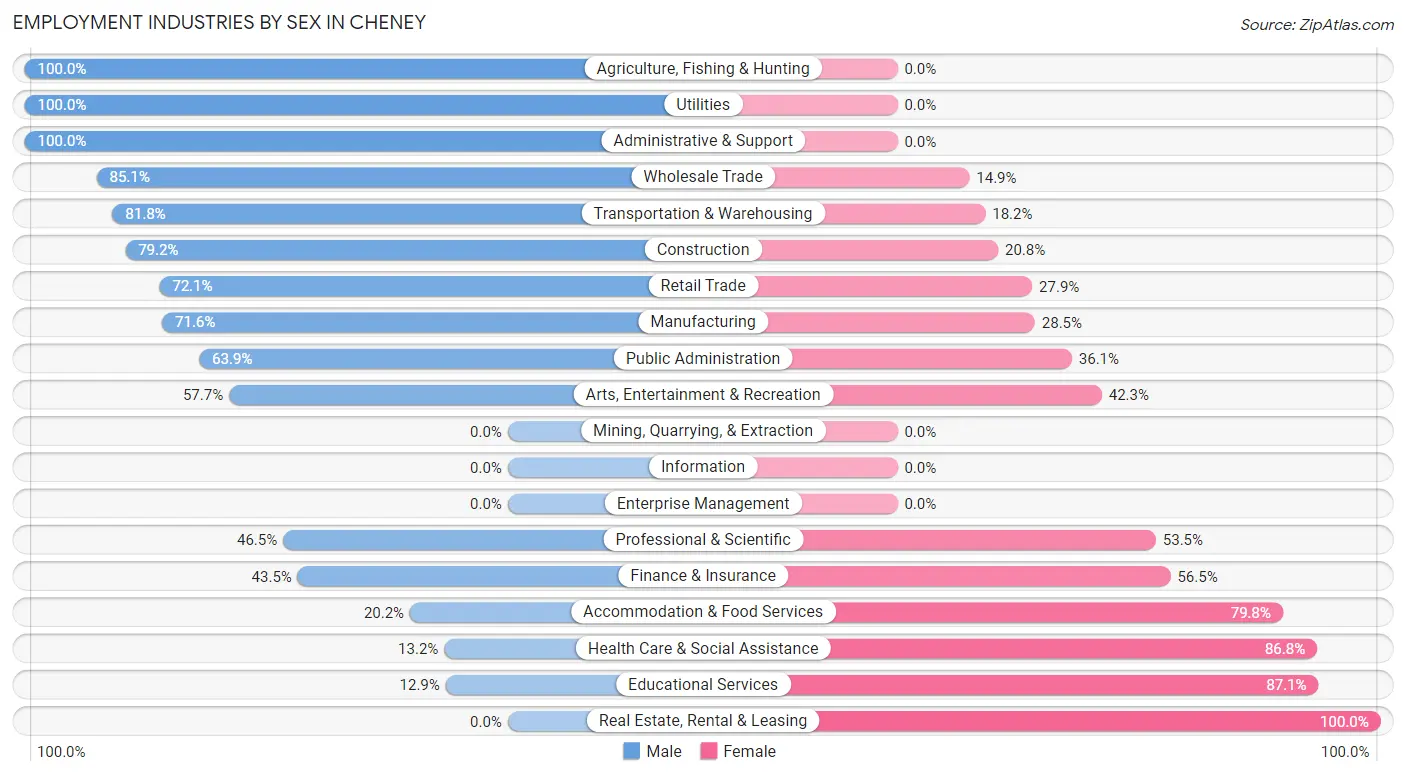
Employment Industries by Sex in Cheney
Employment Industries in Cheney
The major employment industries in Cheney include Manufacturing (239 | 22.6%), Retail Trade (147 | 13.9%), Educational Services (140 | 13.2%), Accommodation & Food Services (84 | 7.9%), and Health Care & Social Assistance (76 | 7.2%).

Employment Industries by Sex in Cheney
The Cheney industries that see more men than women are Agriculture, Fishing & Hunting (100.0%), Utilities (100.0%), and Administrative & Support (100.0%), whereas the industries that tend to have a higher number of women are Real Estate, Rental & Leasing (100.0%), Educational Services (87.1%), and Health Care & Social Assistance (86.8%).
| Industry | Male | Female |
| Agriculture, Fishing & Hunting | 9 (100.0%) | 0 (0.0%) |
| Mining, Quarrying, & Extraction | 0 (0.0%) | 0 (0.0%) |
| Construction | 57 (79.2%) | 15 (20.8%) |
| Manufacturing | 171 (71.6%) | 68 (28.4%) |
| Wholesale Trade | 40 (85.1%) | 7 (14.9%) |
| Retail Trade | 106 (72.1%) | 41 (27.9%) |
| Transportation & Warehousing | 18 (81.8%) | 4 (18.2%) |
| Utilities | 11 (100.0%) | 0 (0.0%) |
| Information | 0 (0.0%) | 0 (0.0%) |
| Finance & Insurance | 20 (43.5%) | 26 (56.5%) |
| Real Estate, Rental & Leasing | 0 (0.0%) | 10 (100.0%) |
| Professional & Scientific | 20 (46.5%) | 23 (53.5%) |
| Enterprise Management | 0 (0.0%) | 0 (0.0%) |
| Administrative & Support | 23 (100.0%) | 0 (0.0%) |
| Educational Services | 18 (12.9%) | 122 (87.1%) |
| Health Care & Social Assistance | 10 (13.2%) | 66 (86.8%) |
| Arts, Entertainment & Recreation | 15 (57.7%) | 11 (42.3%) |
| Accommodation & Food Services | 17 (20.2%) | 67 (79.8%) |
| Public Administration | 23 (63.9%) | 13 (36.1%) |
| Total | 565 (53.4%) | 493 (46.6%) |
Education in Cheney
School Enrollment in Cheney
The most common levels of schooling among the 685 students in Cheney are high school (230 | 33.6%), middle school (173 | 25.3%), and elementary school (139 | 20.3%).
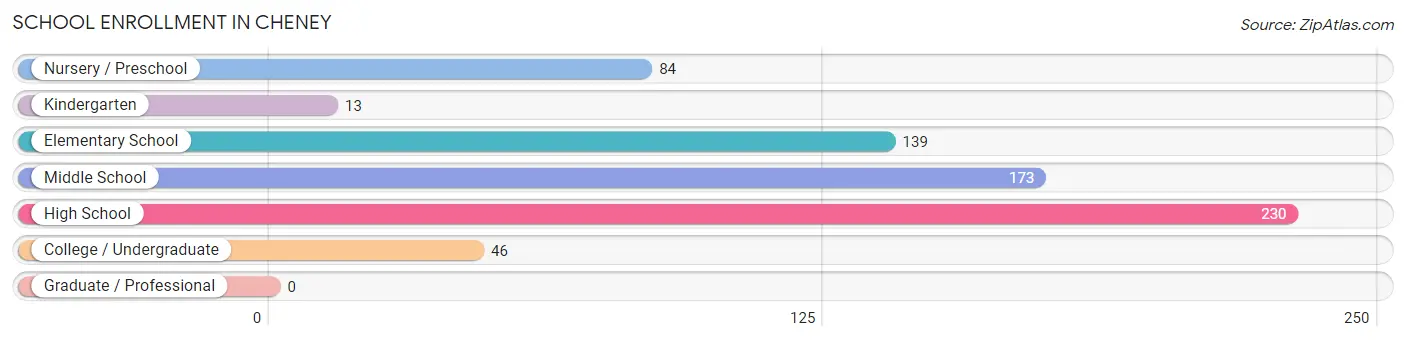
| School Level | # Students | % Students |
| Nursery / Preschool | 84 | 12.3% |
| Kindergarten | 13 | 1.9% |
| Elementary School | 139 | 20.3% |
| Middle School | 173 | 25.3% |
| High School | 230 | 33.6% |
| College / Undergraduate | 46 | 6.7% |
| Graduate / Professional | 0 | 0.0% |
| Total | 685 | 100.0% |
School Enrollment by Age by Funding Source in Cheney
Out of a total of 685 students who are enrolled in schools in Cheney, 66 (9.6%) attend a private institution, while the remaining 619 (90.4%) are enrolled in public schools. The age group of 20 to 24 year olds has the highest likelihood of being enrolled in private schools, with 10 (100.0% in the age bracket) enrolled. Conversely, the age group of 10 to 14 year olds has the lowest likelihood of being enrolled in a private school, with 194 (100.0% in the age bracket) attending a public institution.
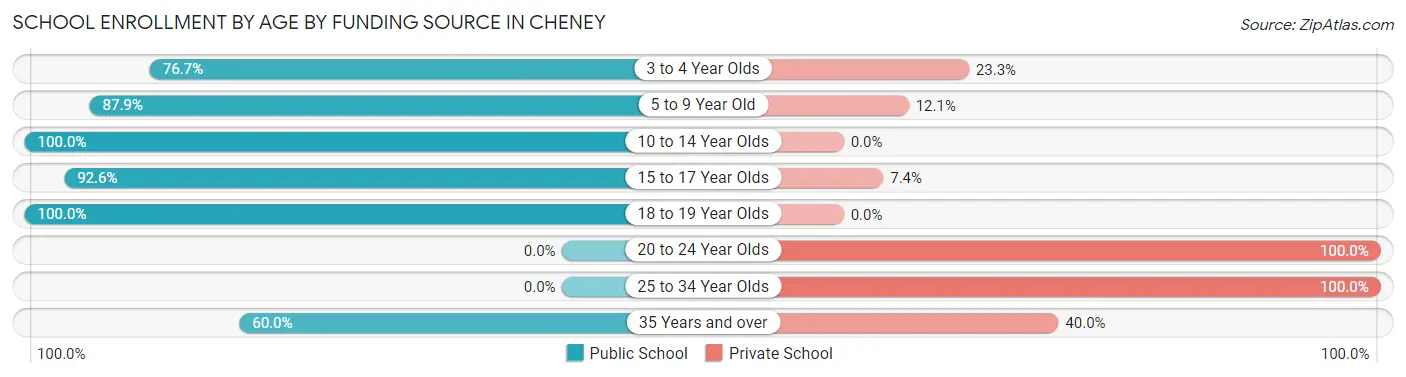
| Age Bracket | Public School | Private School |
| 3 to 4 Year Olds | 23 (76.7%) | 7 (23.3%) |
| 5 to 9 Year Old | 174 (87.9%) | 24 (12.1%) |
| 10 to 14 Year Olds | 194 (100.0%) | 0 (0.0%) |
| 15 to 17 Year Olds | 138 (92.6%) | 11 (7.4%) |
| 18 to 19 Year Olds | 81 (100.0%) | 0 (0.0%) |
| 20 to 24 Year Olds | 0 (0.0%) | 10 (100.0%) |
| 25 to 34 Year Olds | 0 (0.0%) | 8 (100.0%) |
| 35 Years and over | 9 (60.0%) | 6 (40.0%) |
| Total | 619 (90.4%) | 66 (9.6%) |
Educational Attainment by Field of Study in Cheney
Business (96 | 25.1%), education (79 | 20.6%), science & technology (51 | 13.3%), arts & humanities (35 | 9.1%), and psychology (31 | 8.1%) are the most common fields of study among 383 individuals in Cheney who have obtained a bachelor's degree or higher.
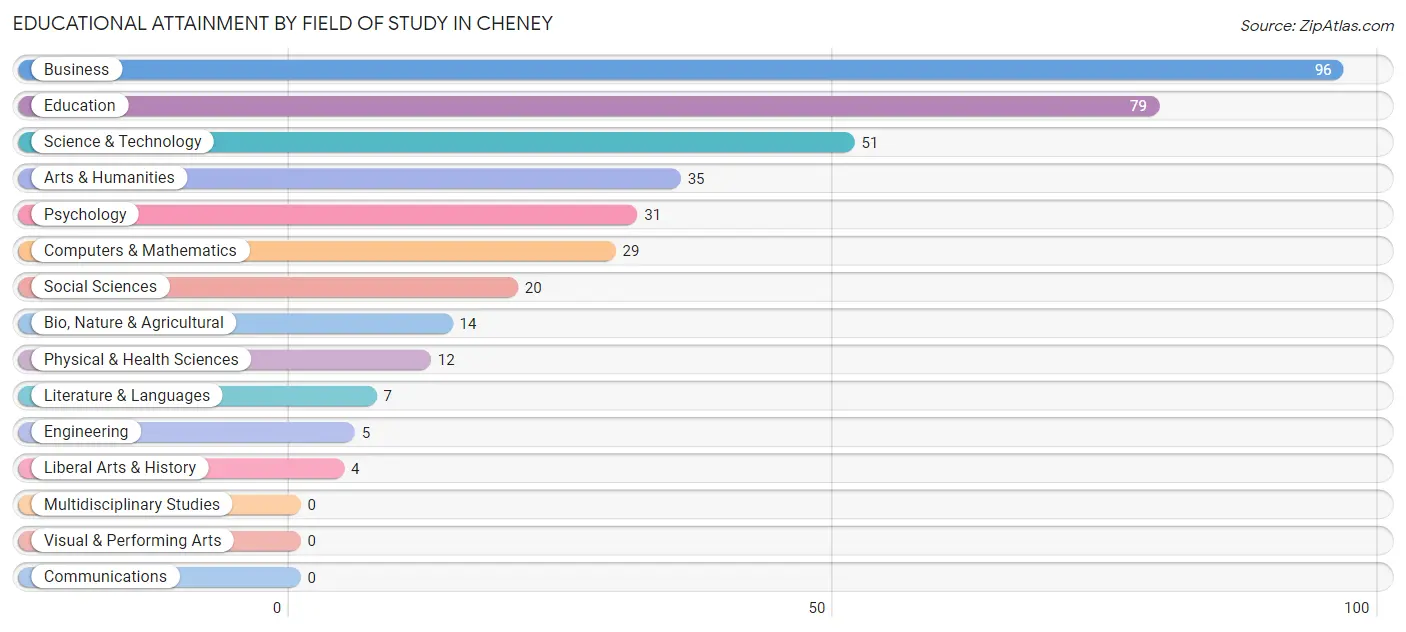
| Field of Study | # Graduates | % Graduates |
| Computers & Mathematics | 29 | 7.6% |
| Bio, Nature & Agricultural | 14 | 3.7% |
| Physical & Health Sciences | 12 | 3.1% |
| Psychology | 31 | 8.1% |
| Social Sciences | 20 | 5.2% |
| Engineering | 5 | 1.3% |
| Multidisciplinary Studies | 0 | 0.0% |
| Science & Technology | 51 | 13.3% |
| Business | 96 | 25.1% |
| Education | 79 | 20.6% |
| Literature & Languages | 7 | 1.8% |
| Liberal Arts & History | 4 | 1.0% |
| Visual & Performing Arts | 0 | 0.0% |
| Communications | 0 | 0.0% |
| Arts & Humanities | 35 | 9.1% |
| Total | 383 | 100.0% |
Transportation & Commute in Cheney
Vehicle Availability by Sex in Cheney
The most prevalent vehicle ownership categories in Cheney are males with 2 vehicles (185, accounting for 32.7%) and females with 2 vehicles (147, making up 38.0%).
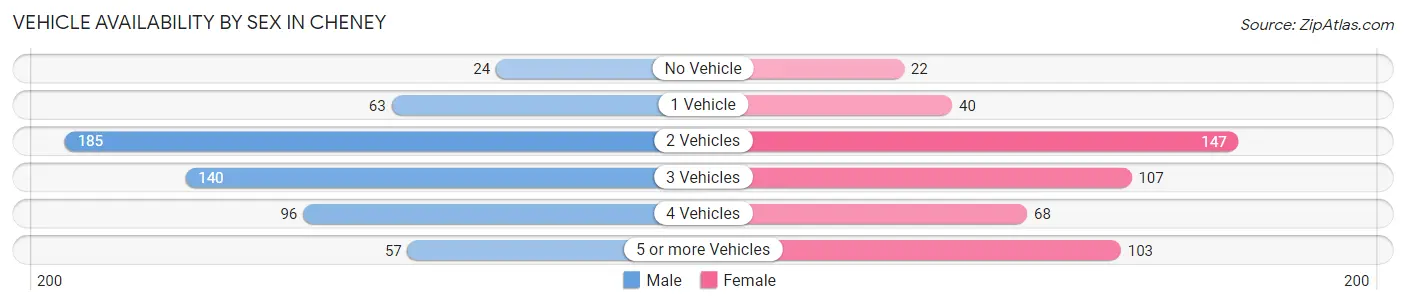
| Vehicles Available | Male | Female |
| No Vehicle | 24 (4.3%) | 22 (4.5%) |
| 1 Vehicle | 63 (11.2%) | 40 (8.2%) |
| 2 Vehicles | 185 (32.7%) | 147 (30.2%) |
| 3 Vehicles | 140 (24.8%) | 107 (22.0%) |
| 4 Vehicles | 96 (17.0%) | 68 (14.0%) |
| 5 or more Vehicles | 57 (10.1%) | 103 (21.1%) |
| Total | 565 (100.0%) | 487 (100.0%) |
Commute Time in Cheney
The most frequently occuring commute durations in Cheney are 30 to 34 minutes (264 commuters, 26.9%), 5 to 9 minutes (165 commuters, 16.8%), and less than 5 minutes (160 commuters, 16.3%).
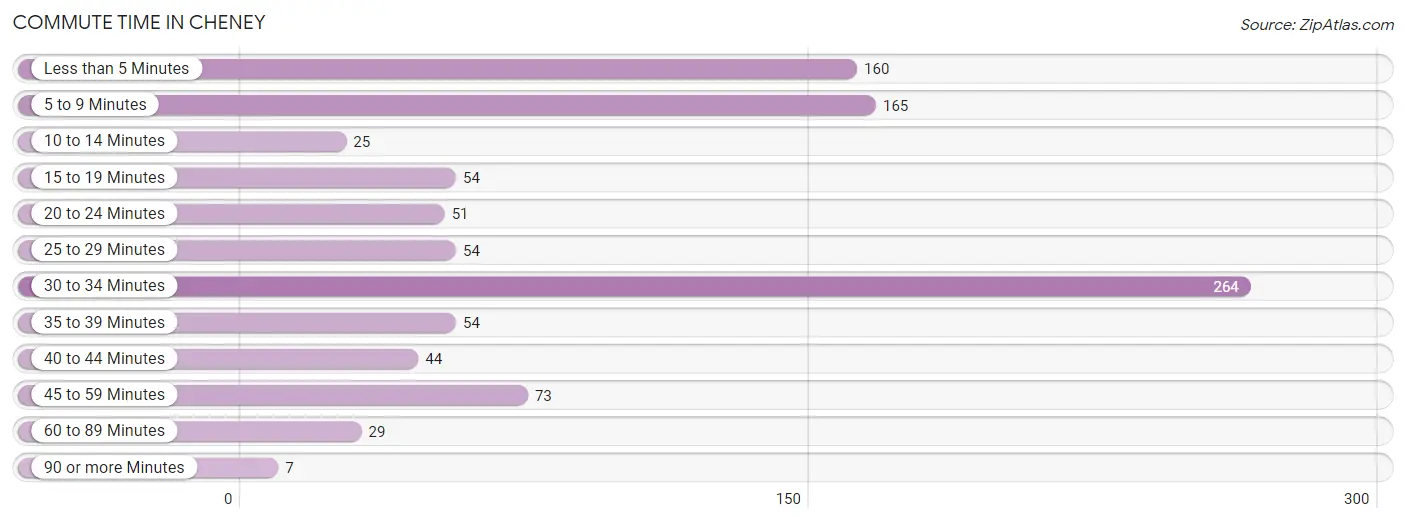
| Commute Time | # Commuters | % Commuters |
| Less than 5 Minutes | 160 | 16.3% |
| 5 to 9 Minutes | 165 | 16.8% |
| 10 to 14 Minutes | 25 | 2.5% |
| 15 to 19 Minutes | 54 | 5.5% |
| 20 to 24 Minutes | 51 | 5.2% |
| 25 to 29 Minutes | 54 | 5.5% |
| 30 to 34 Minutes | 264 | 26.9% |
| 35 to 39 Minutes | 54 | 5.5% |
| 40 to 44 Minutes | 44 | 4.5% |
| 45 to 59 Minutes | 73 | 7.4% |
| 60 to 89 Minutes | 29 | 3.0% |
| 90 or more Minutes | 7 | 0.7% |
Commute Time by Sex in Cheney
The most common commute times in Cheney are 30 to 34 minutes (148 commuters, 27.7%) for males and 30 to 34 minutes (116 commuters, 26.0%) for females.
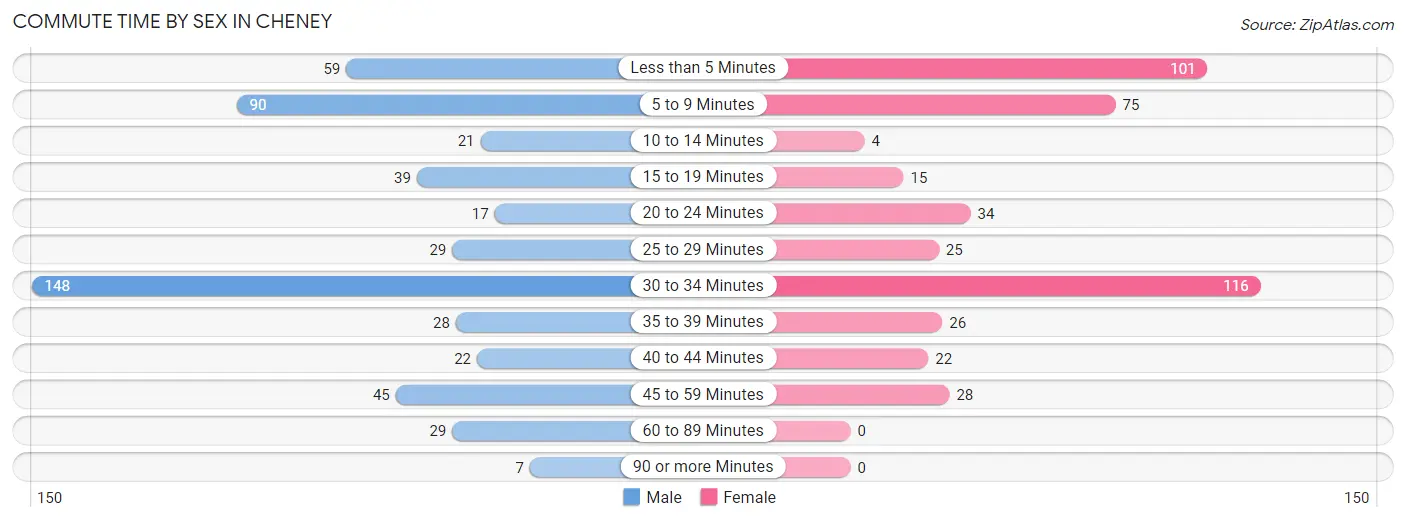
| Commute Time | Male | Female |
| Less than 5 Minutes | 59 (11.1%) | 101 (22.7%) |
| 5 to 9 Minutes | 90 (16.9%) | 75 (16.8%) |
| 10 to 14 Minutes | 21 (3.9%) | 4 (0.9%) |
| 15 to 19 Minutes | 39 (7.3%) | 15 (3.4%) |
| 20 to 24 Minutes | 17 (3.2%) | 34 (7.6%) |
| 25 to 29 Minutes | 29 (5.4%) | 25 (5.6%) |
| 30 to 34 Minutes | 148 (27.7%) | 116 (26.0%) |
| 35 to 39 Minutes | 28 (5.2%) | 26 (5.8%) |
| 40 to 44 Minutes | 22 (4.1%) | 22 (4.9%) |
| 45 to 59 Minutes | 45 (8.4%) | 28 (6.3%) |
| 60 to 89 Minutes | 29 (5.4%) | 0 (0.0%) |
| 90 or more Minutes | 7 (1.3%) | 0 (0.0%) |
Time of Departure to Work by Sex in Cheney
The most frequent times of departure to work in Cheney are 5:00 AM to 5:29 AM (99, 18.5%) for males and 7:00 AM to 7:29 AM (128, 28.7%) for females.
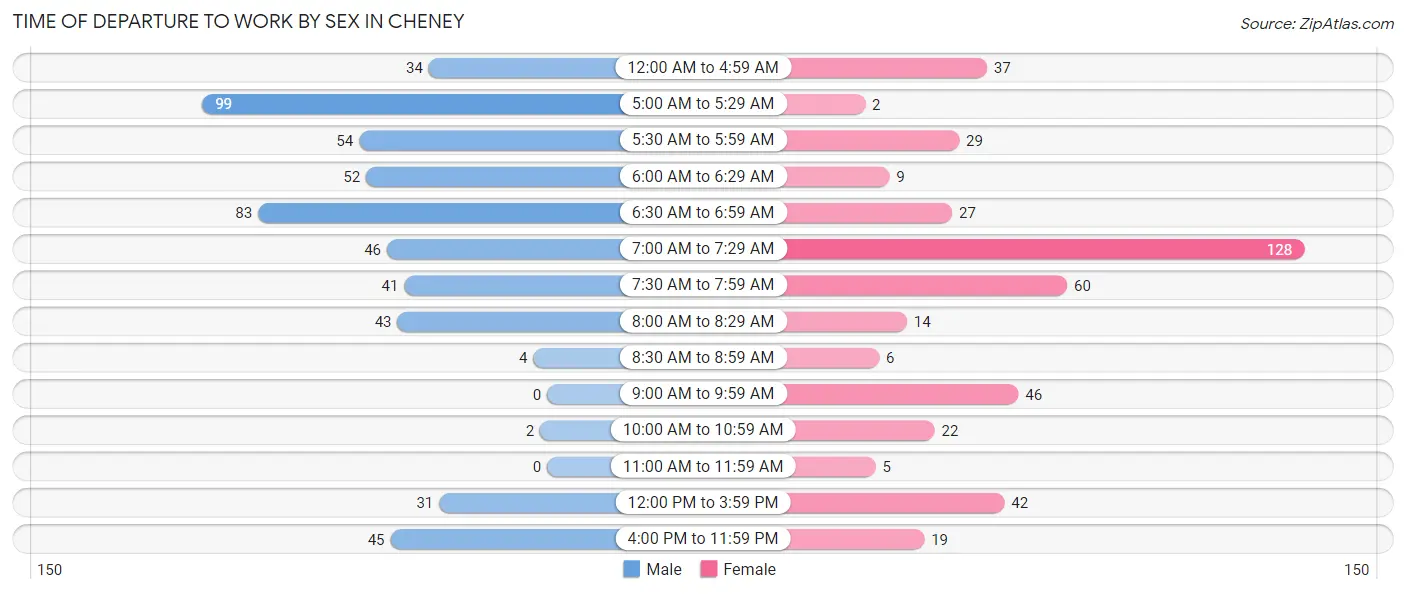
| Time of Departure | Male | Female |
| 12:00 AM to 4:59 AM | 34 (6.4%) | 37 (8.3%) |
| 5:00 AM to 5:29 AM | 99 (18.5%) | 2 (0.4%) |
| 5:30 AM to 5:59 AM | 54 (10.1%) | 29 (6.5%) |
| 6:00 AM to 6:29 AM | 52 (9.7%) | 9 (2.0%) |
| 6:30 AM to 6:59 AM | 83 (15.5%) | 27 (6.0%) |
| 7:00 AM to 7:29 AM | 46 (8.6%) | 128 (28.7%) |
| 7:30 AM to 7:59 AM | 41 (7.7%) | 60 (13.5%) |
| 8:00 AM to 8:29 AM | 43 (8.1%) | 14 (3.1%) |
| 8:30 AM to 8:59 AM | 4 (0.7%) | 6 (1.3%) |
| 9:00 AM to 9:59 AM | 0 (0.0%) | 46 (10.3%) |
| 10:00 AM to 10:59 AM | 2 (0.4%) | 22 (4.9%) |
| 11:00 AM to 11:59 AM | 0 (0.0%) | 5 (1.1%) |
| 12:00 PM to 3:59 PM | 31 (5.8%) | 42 (9.4%) |
| 4:00 PM to 11:59 PM | 45 (8.4%) | 19 (4.3%) |
| Total | 534 (100.0%) | 446 (100.0%) |
Housing Occupancy in Cheney
Occupancy by Ownership in Cheney
Of the total 769 dwellings in Cheney, owner-occupied units account for 614 (79.8%), while renter-occupied units make up 155 (20.2%).
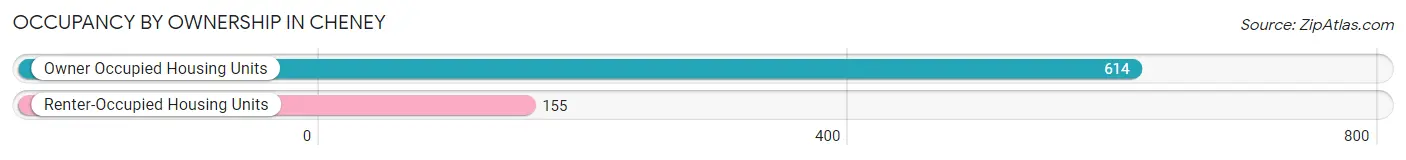
| Occupancy | # Housing Units | % Housing Units |
| Owner Occupied Housing Units | 614 | 79.8% |
| Renter-Occupied Housing Units | 155 | 20.2% |
| Total Occupied Housing Units | 769 | 100.0% |
Occupancy by Household Size in Cheney
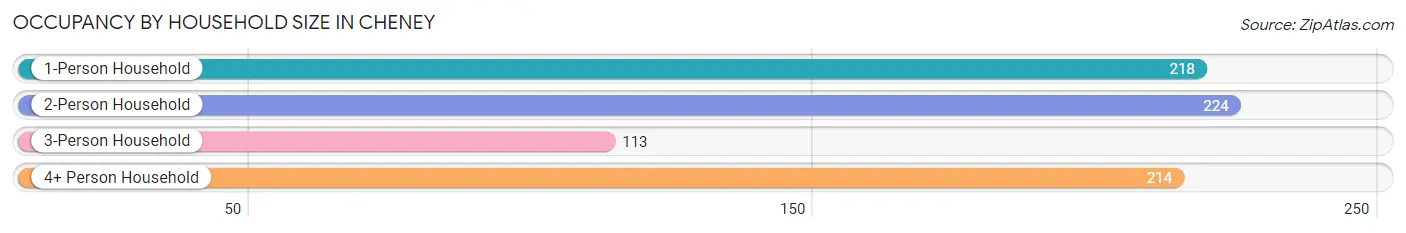
| Household Size | # Housing Units | % Housing Units |
| 1-Person Household | 218 | 28.3% |
| 2-Person Household | 224 | 29.1% |
| 3-Person Household | 113 | 14.7% |
| 4+ Person Household | 214 | 27.8% |
| Total Housing Units | 769 | 100.0% |
Occupancy by Ownership by Household Size in Cheney
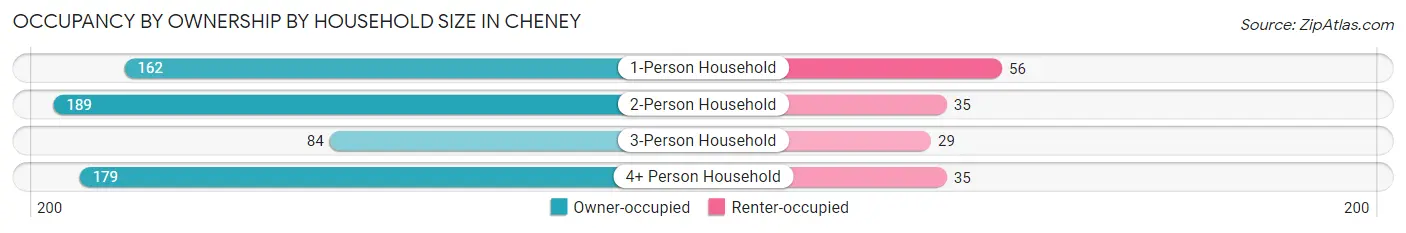
| Household Size | Owner-occupied | Renter-occupied |
| 1-Person Household | 162 (74.3%) | 56 (25.7%) |
| 2-Person Household | 189 (84.4%) | 35 (15.6%) |
| 3-Person Household | 84 (74.3%) | 29 (25.7%) |
| 4+ Person Household | 179 (83.6%) | 35 (16.4%) |
| Total Housing Units | 614 (79.8%) | 155 (20.2%) |
Occupancy by Educational Attainment in Cheney
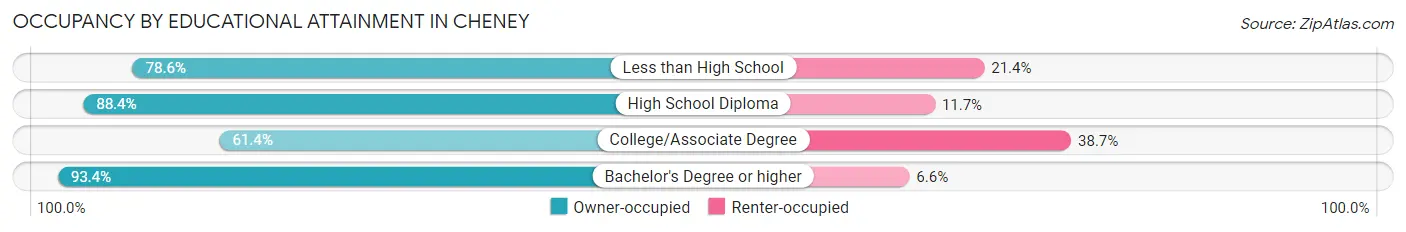
| Household Size | Owner-occupied | Renter-occupied |
| Less than High School | 55 (78.6%) | 15 (21.4%) |
| High School Diploma | 235 (88.3%) | 31 (11.7%) |
| College/Associate Degree | 154 (61.4%) | 97 (38.7%) |
| Bachelor's Degree or higher | 170 (93.4%) | 12 (6.6%) |
Occupancy by Age of Householder in Cheney
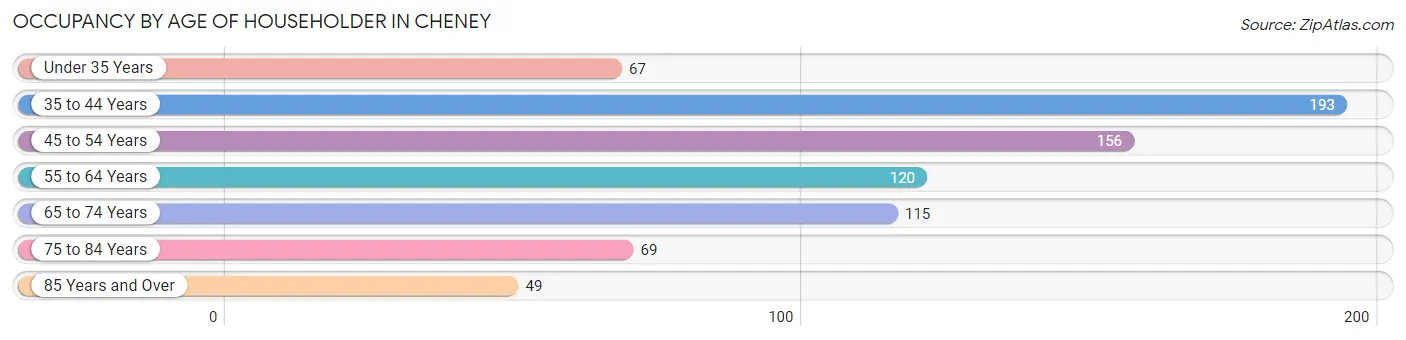
| Age Bracket | # Households | % Households |
| Under 35 Years | 67 | 8.7% |
| 35 to 44 Years | 193 | 25.1% |
| 45 to 54 Years | 156 | 20.3% |
| 55 to 64 Years | 120 | 15.6% |
| 65 to 74 Years | 115 | 14.9% |
| 75 to 84 Years | 69 | 9.0% |
| 85 Years and Over | 49 | 6.4% |
| Total | 769 | 100.0% |
Housing Finances in Cheney
Median Income by Occupancy in Cheney
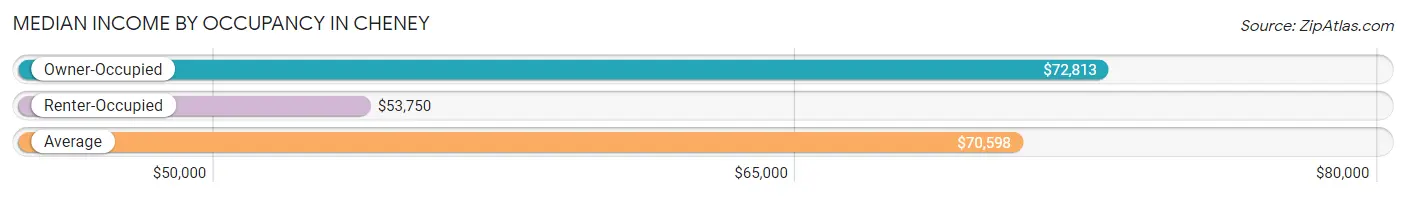
| Occupancy Type | # Households | Median Income |
| Owner-Occupied | 614 (79.8%) | $72,813 |
| Renter-Occupied | 155 (20.2%) | $53,750 |
| Average | 769 (100.0%) | $70,598 |
Occupancy by Householder Income Bracket in Cheney
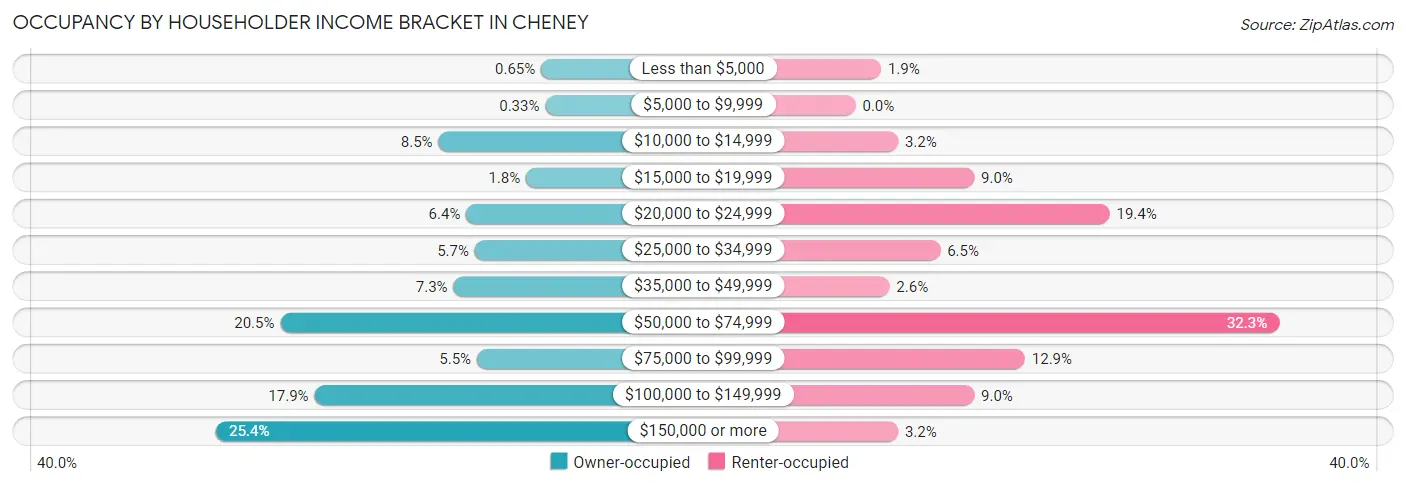
| Income Bracket | Owner-occupied | Renter-occupied |
| Less than $5,000 | 4 (0.6%) | 3 (1.9%) |
| $5,000 to $9,999 | 2 (0.3%) | 0 (0.0%) |
| $10,000 to $14,999 | 52 (8.5%) | 5 (3.2%) |
| $15,000 to $19,999 | 11 (1.8%) | 14 (9.0%) |
| $20,000 to $24,999 | 39 (6.4%) | 30 (19.4%) |
| $25,000 to $34,999 | 35 (5.7%) | 10 (6.5%) |
| $35,000 to $49,999 | 45 (7.3%) | 4 (2.6%) |
| $50,000 to $74,999 | 126 (20.5%) | 50 (32.3%) |
| $75,000 to $99,999 | 34 (5.5%) | 20 (12.9%) |
| $100,000 to $149,999 | 110 (17.9%) | 14 (9.0%) |
| $150,000 or more | 156 (25.4%) | 5 (3.2%) |
| Total | 614 (100.0%) | 155 (100.0%) |
Monthly Housing Cost Tiers in Cheney
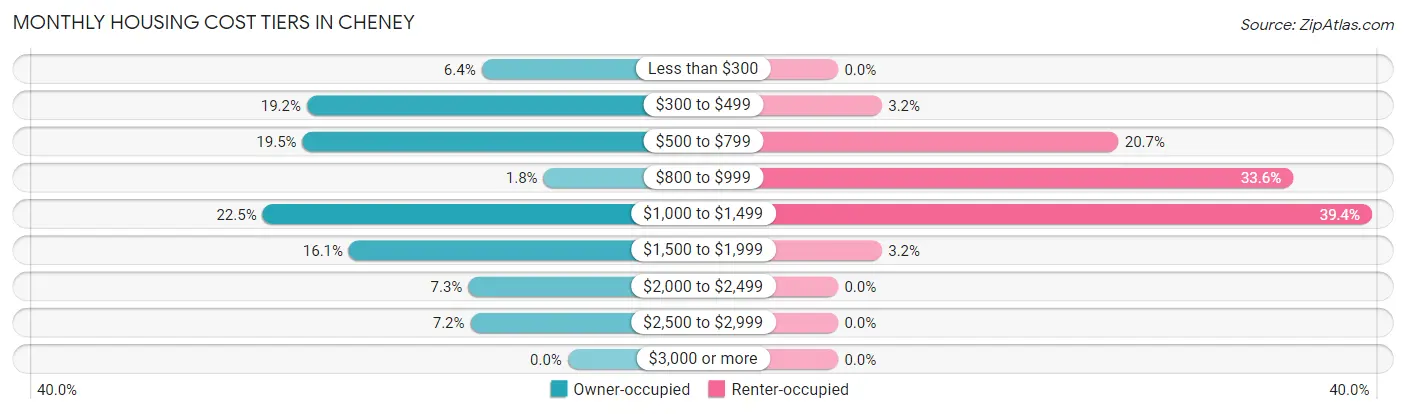
| Monthly Cost | Owner-occupied | Renter-occupied |
| Less than $300 | 39 (6.4%) | 0 (0.0%) |
| $300 to $499 | 118 (19.2%) | 5 (3.2%) |
| $500 to $799 | 120 (19.5%) | 32 (20.6%) |
| $800 to $999 | 11 (1.8%) | 52 (33.6%) |
| $1,000 to $1,499 | 138 (22.5%) | 61 (39.4%) |
| $1,500 to $1,999 | 99 (16.1%) | 5 (3.2%) |
| $2,000 to $2,499 | 45 (7.3%) | 0 (0.0%) |
| $2,500 to $2,999 | 44 (7.2%) | 0 (0.0%) |
| $3,000 or more | 0 (0.0%) | 0 (0.0%) |
| Total | 614 (100.0%) | 155 (100.0%) |
Physical Housing Characteristics in Cheney
Housing Structures in Cheney
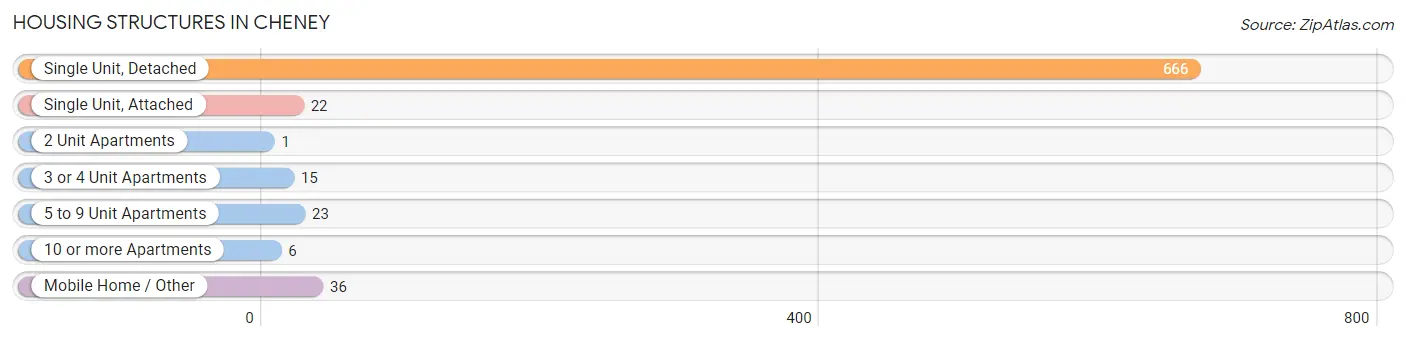
| Structure Type | # Housing Units | % Housing Units |
| Single Unit, Detached | 666 | 86.6% |
| Single Unit, Attached | 22 | 2.9% |
| 2 Unit Apartments | 1 | 0.1% |
| 3 or 4 Unit Apartments | 15 | 1.9% |
| 5 to 9 Unit Apartments | 23 | 3.0% |
| 10 or more Apartments | 6 | 0.8% |
| Mobile Home / Other | 36 | 4.7% |
| Total | 769 | 100.0% |
Housing Structures by Occupancy in Cheney
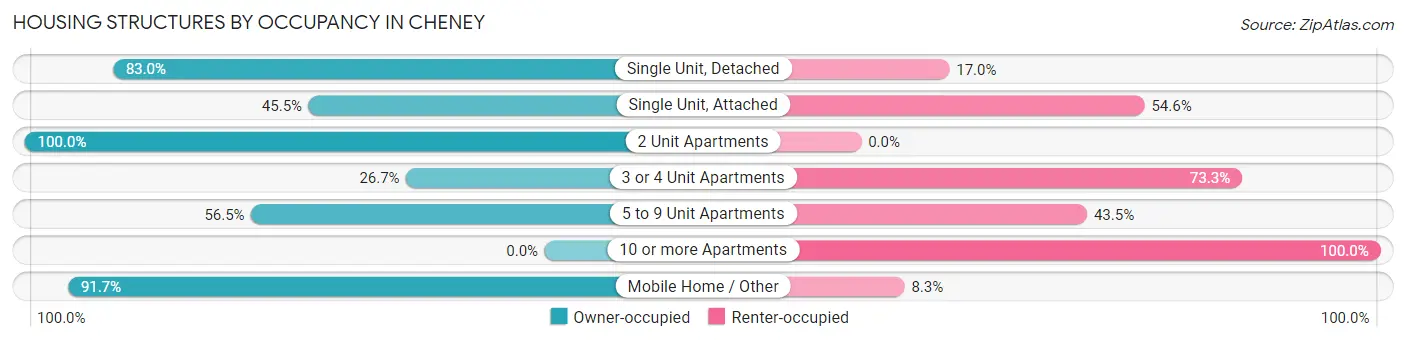
| Structure Type | Owner-occupied | Renter-occupied |
| Single Unit, Detached | 553 (83.0%) | 113 (17.0%) |
| Single Unit, Attached | 10 (45.5%) | 12 (54.5%) |
| 2 Unit Apartments | 1 (100.0%) | 0 (0.0%) |
| 3 or 4 Unit Apartments | 4 (26.7%) | 11 (73.3%) |
| 5 to 9 Unit Apartments | 13 (56.5%) | 10 (43.5%) |
| 10 or more Apartments | 0 (0.0%) | 6 (100.0%) |
| Mobile Home / Other | 33 (91.7%) | 3 (8.3%) |
| Total | 614 (79.8%) | 155 (20.2%) |
Housing Structures by Number of Rooms in Cheney
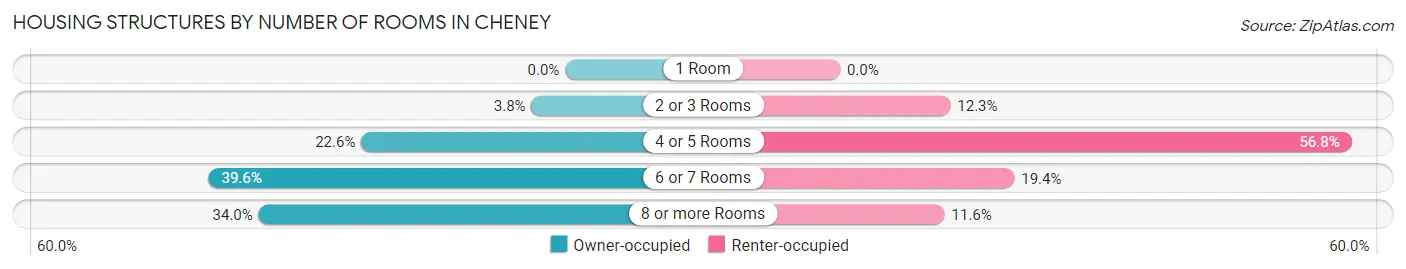
| Number of Rooms | Owner-occupied | Renter-occupied |
| 1 Room | 0 (0.0%) | 0 (0.0%) |
| 2 or 3 Rooms | 23 (3.7%) | 19 (12.3%) |
| 4 or 5 Rooms | 139 (22.6%) | 88 (56.8%) |
| 6 or 7 Rooms | 243 (39.6%) | 30 (19.4%) |
| 8 or more Rooms | 209 (34.0%) | 18 (11.6%) |
| Total | 614 (100.0%) | 155 (100.0%) |
Housing Structure by Heating Type in Cheney
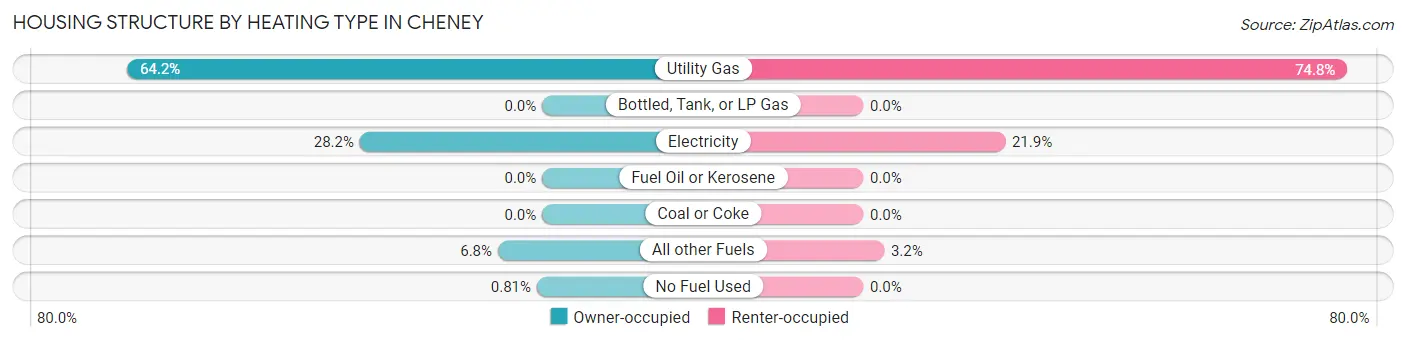
| Heating Type | Owner-occupied | Renter-occupied |
| Utility Gas | 394 (64.2%) | 116 (74.8%) |
| Bottled, Tank, or LP Gas | 0 (0.0%) | 0 (0.0%) |
| Electricity | 173 (28.2%) | 34 (21.9%) |
| Fuel Oil or Kerosene | 0 (0.0%) | 0 (0.0%) |
| Coal or Coke | 0 (0.0%) | 0 (0.0%) |
| All other Fuels | 42 (6.8%) | 5 (3.2%) |
| No Fuel Used | 5 (0.8%) | 0 (0.0%) |
| Total | 614 (100.0%) | 155 (100.0%) |
Household Vehicle Usage in Cheney
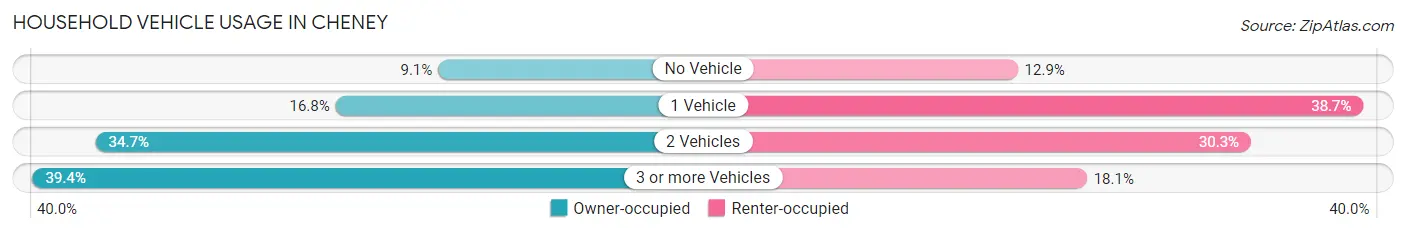
| Vehicles per Household | Owner-occupied | Renter-occupied |
| No Vehicle | 56 (9.1%) | 20 (12.9%) |
| 1 Vehicle | 103 (16.8%) | 60 (38.7%) |
| 2 Vehicles | 213 (34.7%) | 47 (30.3%) |
| 3 or more Vehicles | 242 (39.4%) | 28 (18.1%) |
| Total | 614 (100.0%) | 155 (100.0%) |
Real Estate & Mortgages in Cheney
Real Estate and Mortgage Overview in Cheney
| Characteristic | Without Mortgage | With Mortgage |
| Housing Units | 269 | 345 |
| Median Property Value | $102,500 | $173,200 |
| Median Household Income | $50,096 | $130 |
| Monthly Housing Costs | $437 | $0 |
| Real Estate Taxes | $1,432 | $14 |
Property Value by Mortgage Status in Cheney
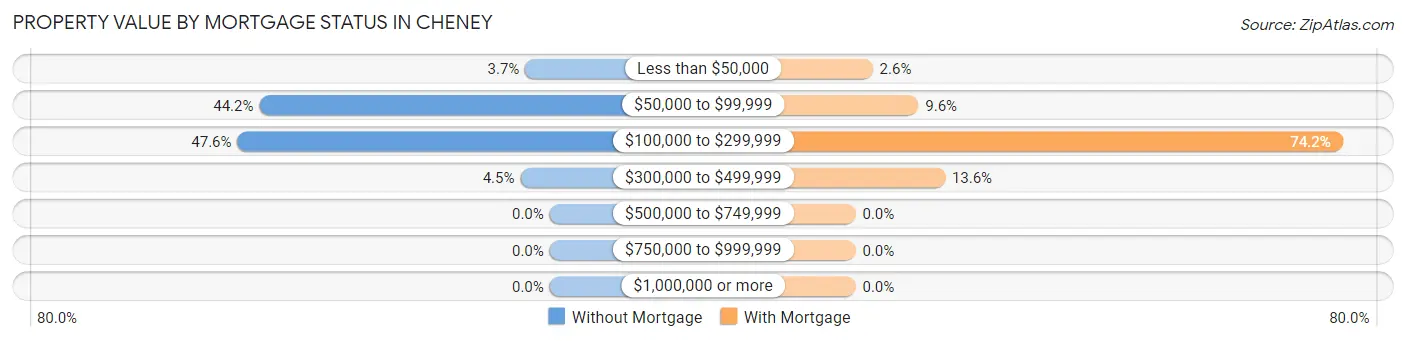
| Property Value | Without Mortgage | With Mortgage |
| Less than $50,000 | 10 (3.7%) | 9 (2.6%) |
| $50,000 to $99,999 | 119 (44.2%) | 33 (9.6%) |
| $100,000 to $299,999 | 128 (47.6%) | 256 (74.2%) |
| $300,000 to $499,999 | 12 (4.5%) | 47 (13.6%) |
| $500,000 to $749,999 | 0 (0.0%) | 0 (0.0%) |
| $750,000 to $999,999 | 0 (0.0%) | 0 (0.0%) |
| $1,000,000 or more | 0 (0.0%) | 0 (0.0%) |
| Total | 269 (100.0%) | 345 (100.0%) |
Household Income by Mortgage Status in Cheney
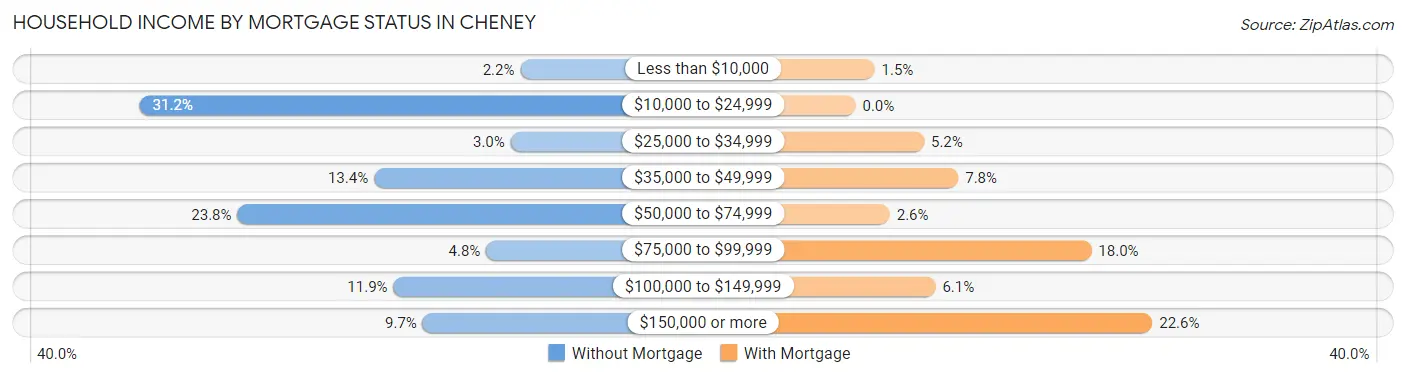
| Household Income | Without Mortgage | With Mortgage |
| Less than $10,000 | 6 (2.2%) | 5 (1.5%) |
| $10,000 to $24,999 | 84 (31.2%) | 0 (0.0%) |
| $25,000 to $34,999 | 8 (3.0%) | 18 (5.2%) |
| $35,000 to $49,999 | 36 (13.4%) | 27 (7.8%) |
| $50,000 to $74,999 | 64 (23.8%) | 9 (2.6%) |
| $75,000 to $99,999 | 13 (4.8%) | 62 (18.0%) |
| $100,000 to $149,999 | 32 (11.9%) | 21 (6.1%) |
| $150,000 or more | 26 (9.7%) | 78 (22.6%) |
| Total | 269 (100.0%) | 345 (100.0%) |
Property Value to Household Income Ratio in Cheney
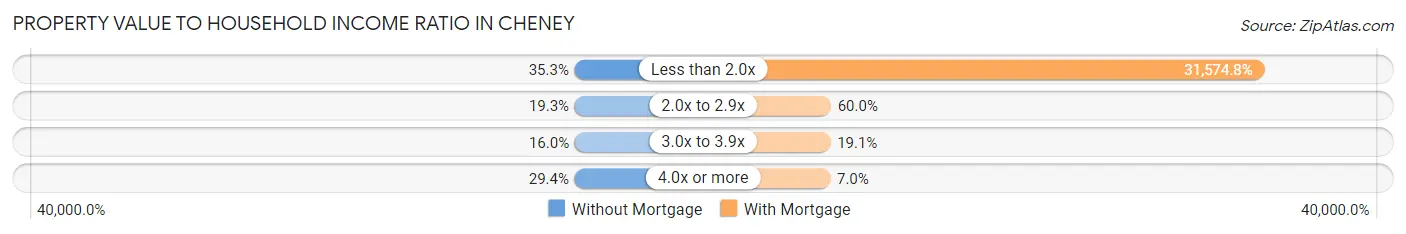
| Value-to-Income Ratio | Without Mortgage | With Mortgage |
| Less than 2.0x | 95 (35.3%) | 108,933 (31,574.8%) |
| 2.0x to 2.9x | 52 (19.3%) | 207 (60.0%) |
| 3.0x to 3.9x | 43 (16.0%) | 66 (19.1%) |
| 4.0x or more | 79 (29.4%) | 24 (7.0%) |
| Total | 269 (100.0%) | 345 (100.0%) |
Real Estate Taxes by Mortgage Status in Cheney
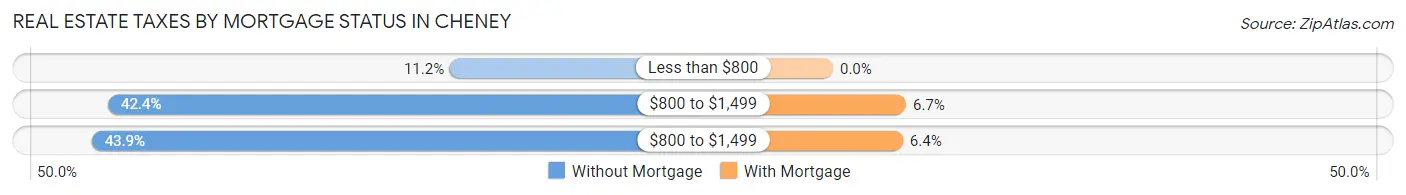
| Property Taxes | Without Mortgage | With Mortgage |
| Less than $800 | 30 (11.2%) | 0 (0.0%) |
| $800 to $1,499 | 114 (42.4%) | 23 (6.7%) |
| $800 to $1,499 | 118 (43.9%) | 22 (6.4%) |
| Total | 269 (100.0%) | 345 (100.0%) |
Health & Disability in Cheney
Health Insurance Coverage by Age in Cheney
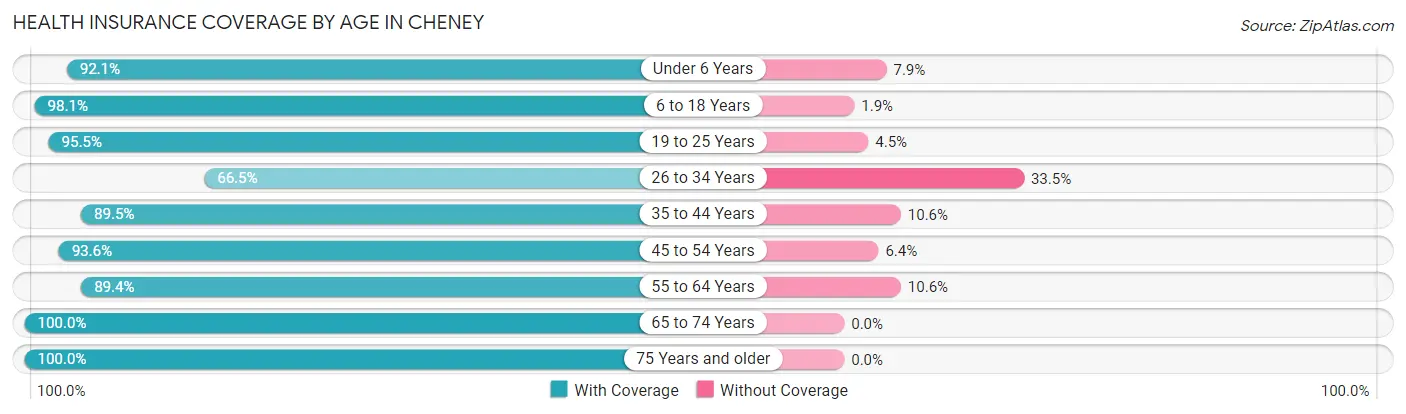
| Age Bracket | With Coverage | Without Coverage |
| Under 6 Years | 187 (92.1%) | 16 (7.9%) |
| 6 to 18 Years | 573 (98.1%) | 11 (1.9%) |
| 19 to 25 Years | 128 (95.5%) | 6 (4.5%) |
| 26 to 34 Years | 123 (66.5%) | 62 (33.5%) |
| 35 to 44 Years | 339 (89.4%) | 40 (10.5%) |
| 45 to 54 Years | 294 (93.6%) | 20 (6.4%) |
| 55 to 64 Years | 161 (89.4%) | 19 (10.6%) |
| 65 to 74 Years | 220 (100.0%) | 0 (0.0%) |
| 75 Years and older | 131 (100.0%) | 0 (0.0%) |
| Total | 2,156 (92.5%) | 174 (7.5%) |
Health Insurance Coverage by Citizenship Status in Cheney
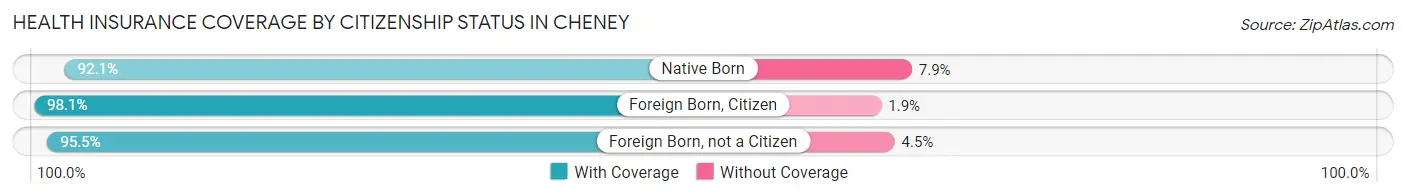
| Citizenship Status | With Coverage | Without Coverage |
| Native Born | 187 (92.1%) | 16 (7.9%) |
| Foreign Born, Citizen | 573 (98.1%) | 11 (1.9%) |
| Foreign Born, not a Citizen | 128 (95.5%) | 6 (4.5%) |
Health Insurance Coverage by Household Income in Cheney
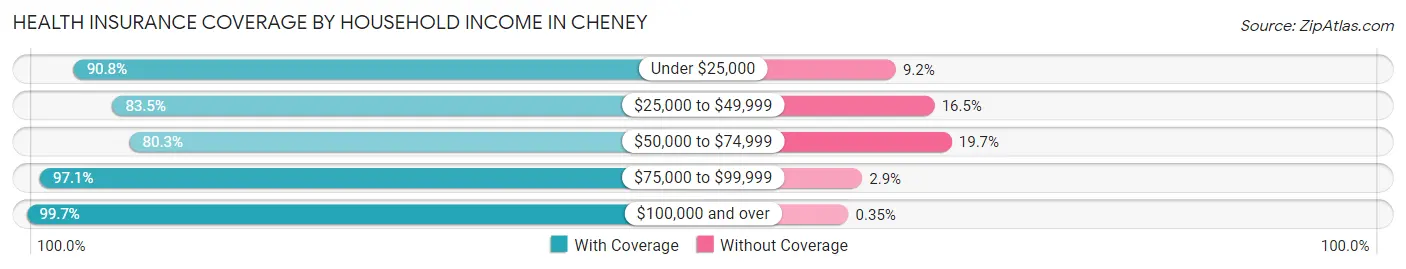
| Household Income | With Coverage | Without Coverage |
| Under $25,000 | 207 (90.8%) | 21 (9.2%) |
| $25,000 to $49,999 | 213 (83.5%) | 42 (16.5%) |
| $50,000 to $74,999 | 416 (80.3%) | 102 (19.7%) |
| $75,000 to $99,999 | 167 (97.1%) | 5 (2.9%) |
| $100,000 and over | 1,153 (99.7%) | 4 (0.4%) |
Public vs Private Health Insurance Coverage by Age in Cheney
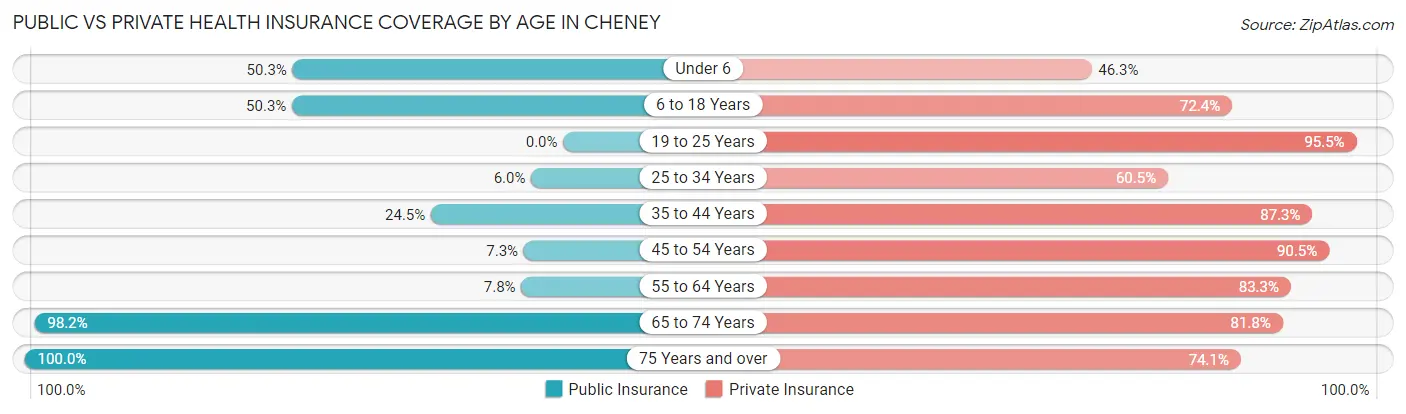
| Age Bracket | Public Insurance | Private Insurance |
| Under 6 | 102 (50.2%) | 94 (46.3%) |
| 6 to 18 Years | 294 (50.3%) | 423 (72.4%) |
| 19 to 25 Years | 0 (0.0%) | 128 (95.5%) |
| 25 to 34 Years | 11 (5.9%) | 112 (60.5%) |
| 35 to 44 Years | 93 (24.5%) | 331 (87.3%) |
| 45 to 54 Years | 23 (7.3%) | 284 (90.4%) |
| 55 to 64 Years | 14 (7.8%) | 150 (83.3%) |
| 65 to 74 Years | 216 (98.2%) | 180 (81.8%) |
| 75 Years and over | 131 (100.0%) | 97 (74.1%) |
| Total | 884 (37.9%) | 1,799 (77.2%) |
Disability Status by Sex by Age in Cheney
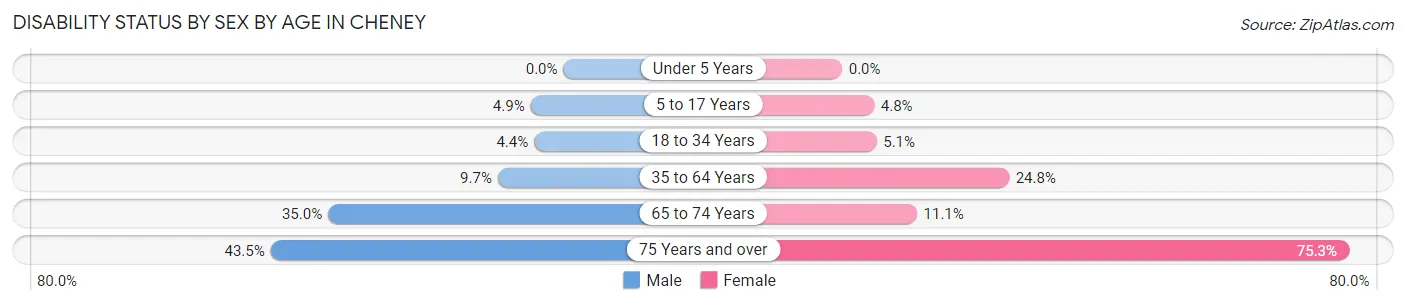
| Age Bracket | Male | Female |
| Under 5 Years | 0 (0.0%) | 0 (0.0%) |
| 5 to 17 Years | 14 (4.9%) | 13 (4.8%) |
| 18 to 34 Years | 8 (4.3%) | 11 (5.1%) |
| 35 to 64 Years | 41 (9.7%) | 112 (24.8%) |
| 65 to 74 Years | 36 (34.9%) | 13 (11.1%) |
| 75 Years and over | 20 (43.5%) | 64 (75.3%) |
Disability Class by Sex by Age in Cheney
Disability Class: Hearing Difficulty
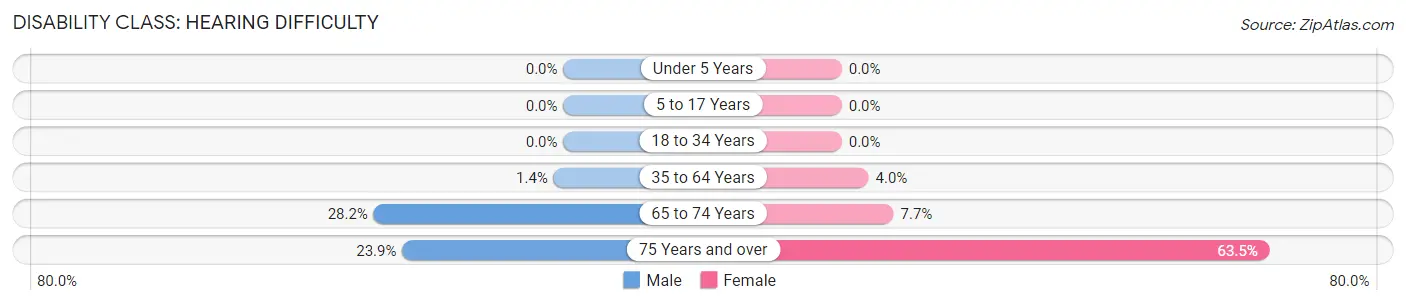
| Age Bracket | Male | Female |
| Under 5 Years | 0 (0.0%) | 0 (0.0%) |
| 5 to 17 Years | 0 (0.0%) | 0 (0.0%) |
| 18 to 34 Years | 0 (0.0%) | 0 (0.0%) |
| 35 to 64 Years | 6 (1.4%) | 18 (4.0%) |
| 65 to 74 Years | 29 (28.2%) | 9 (7.7%) |
| 75 Years and over | 11 (23.9%) | 54 (63.5%) |
Disability Class: Vision Difficulty
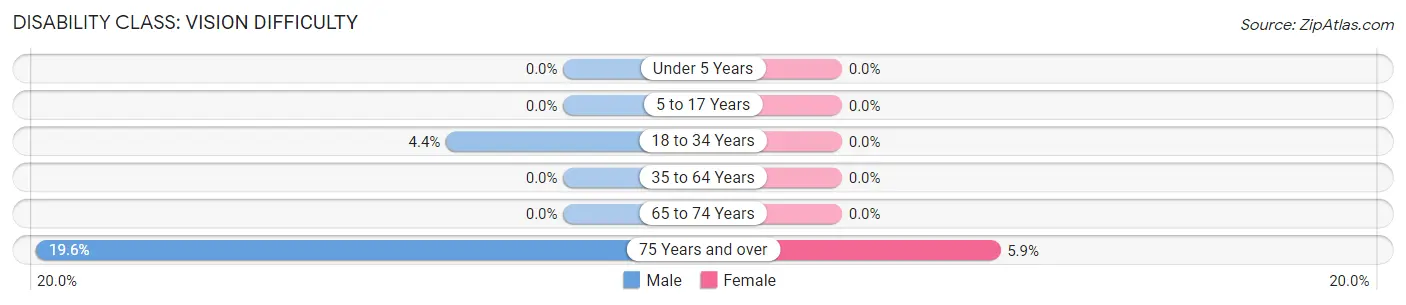
| Age Bracket | Male | Female |
| Under 5 Years | 0 (0.0%) | 0 (0.0%) |
| 5 to 17 Years | 0 (0.0%) | 0 (0.0%) |
| 18 to 34 Years | 8 (4.3%) | 0 (0.0%) |
| 35 to 64 Years | 0 (0.0%) | 0 (0.0%) |
| 65 to 74 Years | 0 (0.0%) | 0 (0.0%) |
| 75 Years and over | 9 (19.6%) | 5 (5.9%) |
Disability Class: Cognitive Difficulty
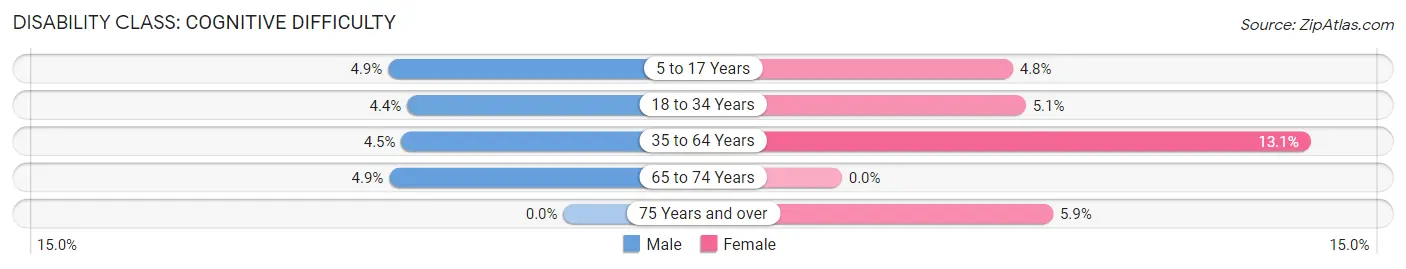
| Age Bracket | Male | Female |
| 5 to 17 Years | 14 (4.9%) | 13 (4.8%) |
| 18 to 34 Years | 8 (4.3%) | 11 (5.1%) |
| 35 to 64 Years | 19 (4.5%) | 59 (13.1%) |
| 65 to 74 Years | 5 (4.9%) | 0 (0.0%) |
| 75 Years and over | 0 (0.0%) | 5 (5.9%) |
Disability Class: Ambulatory Difficulty
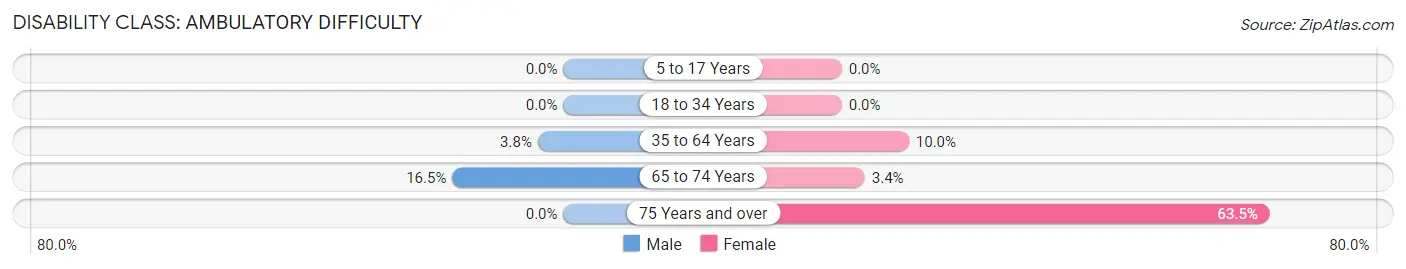
| Age Bracket | Male | Female |
| 5 to 17 Years | 0 (0.0%) | 0 (0.0%) |
| 18 to 34 Years | 0 (0.0%) | 0 (0.0%) |
| 35 to 64 Years | 16 (3.8%) | 45 (10.0%) |
| 65 to 74 Years | 17 (16.5%) | 4 (3.4%) |
| 75 Years and over | 0 (0.0%) | 54 (63.5%) |
Disability Class: Self-Care Difficulty
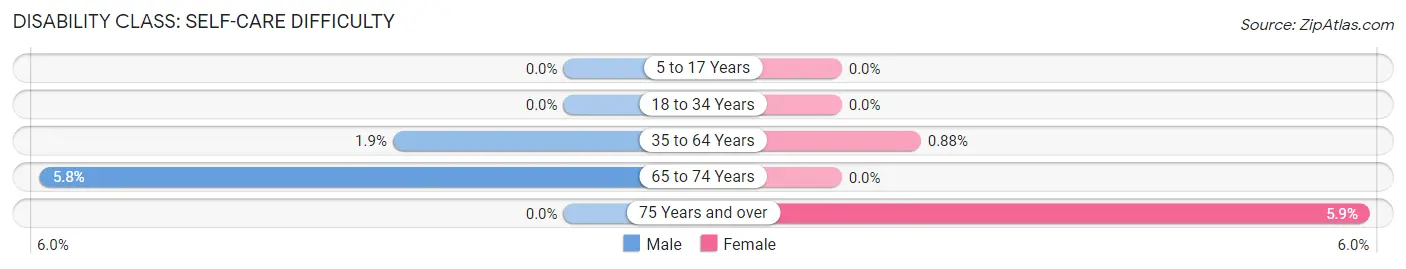
| Age Bracket | Male | Female |
| 5 to 17 Years | 0 (0.0%) | 0 (0.0%) |
| 18 to 34 Years | 0 (0.0%) | 0 (0.0%) |
| 35 to 64 Years | 8 (1.9%) | 4 (0.9%) |
| 65 to 74 Years | 6 (5.8%) | 0 (0.0%) |
| 75 Years and over | 0 (0.0%) | 5 (5.9%) |
Technology Access in Cheney
Computing Device Access in Cheney
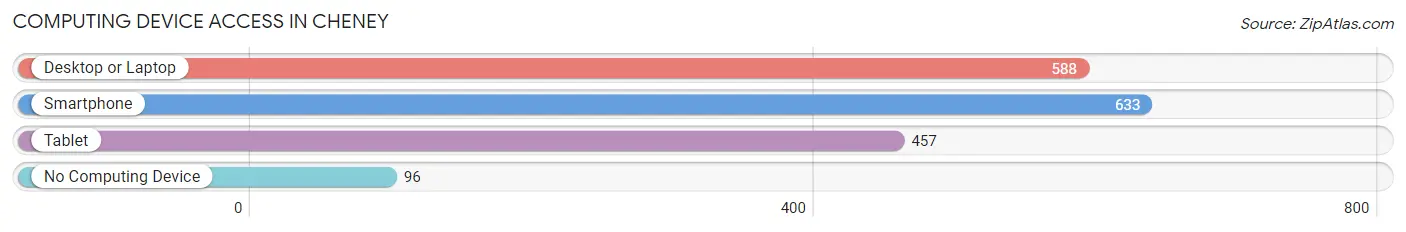
| Device Type | # Households | % Households |
| Desktop or Laptop | 588 | 76.5% |
| Smartphone | 633 | 82.3% |
| Tablet | 457 | 59.4% |
| No Computing Device | 96 | 12.5% |
| Total | 769 | 100.0% |
Internet Access in Cheney
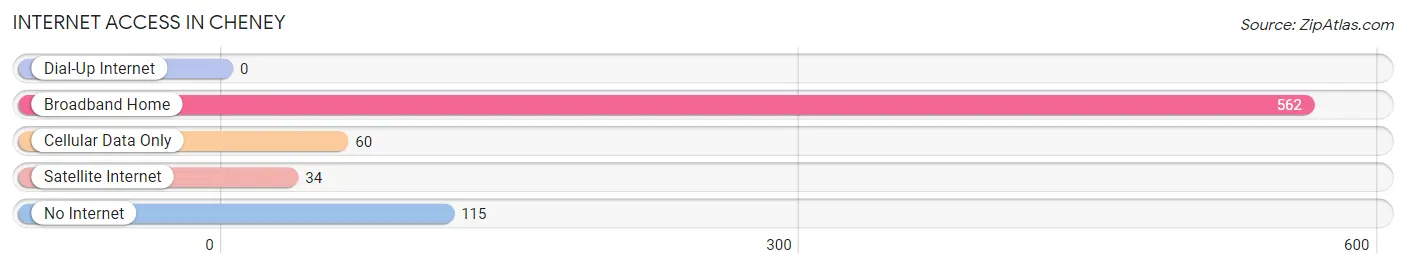
| Internet Type | # Households | % Households |
| Dial-Up Internet | 0 | 0.0% |
| Broadband Home | 562 | 73.1% |
| Cellular Data Only | 60 | 7.8% |
| Satellite Internet | 34 | 4.4% |
| No Internet | 115 | 14.9% |
| Total | 769 | 100.0% |
Cheney Summary
Cheney, Kansas is a small city located in the south-central part of the state, about 20 miles west of Wichita. It is the county seat of Sedgwick County and has a population of just over 2,000 people. The city was founded in 1887 and named after Benjamin P. Cheney, a prominent local businessman.
Geography
Cheney is located in the Arkansas River Valley, which is part of the Great Plains region of the United States. The city is situated on the western edge of the Flint Hills, a region of rolling hills and prairies. The city is located at an elevation of 1,068 feet above sea level. The climate in Cheney is characterized by hot, humid summers and cold, dry winters.
Economy
Cheney’s economy is largely based on agriculture and manufacturing. The city is home to several large agricultural operations, including a large dairy farm and a large hog farm. The city also has several manufacturing plants, including a plant that produces plastic containers and a plant that produces automotive parts.
Demographics
As of the 2010 census, Cheney had a population of 2,039 people. The racial makeup of the city was 94.3% White, 0.7% African American, 0.3% Native American, 0.3% Asian, 0.1% Pacific Islander, and 4.3% from two or more races. Hispanic or Latino of any race were 2.2% of the population.
The median income for a household in Cheney was $41,250, and the median income for a family was $50,000. The per capita income for the city was $20,845. About 8.3% of families and 10.2% of the population were below the poverty line, including 14.3% of those under age 18 and 8.2% of those age 65 or over.
Cheney is served by the Cheney Unified School District, which includes Cheney High School, Cheney Middle School, and Cheney Elementary School. The city also has a public library, a post office, and several churches.
Cheney is a small city with a rich history and a strong sense of community. It is a great place to live and work, and it offers a variety of activities and amenities for its residents. With its strong economy and diverse population, Cheney is a great place to call home.
Common Questions
What is Per Capita Income in Cheney?
Per Capita income in Cheney is $32,664.
What is the Median Family Income in Cheney?
Median Family Income in Cheney is $96,250.
What is the Median Household income in Cheney?
Median Household Income in Cheney is $70,598.
What is Income or Wage Gap in Cheney?
Income or Wage Gap in Cheney is 64.4%.
Women in Cheney earn 35.6 cents for every dollar earned by a man.
What is Family Income Deficit in Cheney?
Family Income Deficit in Cheney is $4,331.
Families that are below poverty line in Cheney earn $4,331 less on average than the poverty threshold level.
What is Inequality or Gini Index in Cheney?
Inequality or Gini Index in Cheney is 0.46.
What is the Total Population of Cheney?
Total Population of Cheney is 2,380.
What is the Total Male Population of Cheney?
Total Male Population of Cheney is 1,136.
What is the Total Female Population of Cheney?
Total Female Population of Cheney is 1,244.
What is the Ratio of Males per 100 Females in Cheney?
There are 91.32 Males per 100 Females in Cheney.
What is the Ratio of Females per 100 Males in Cheney?
There are 109.51 Females per 100 Males in Cheney.
What is the Median Population Age in Cheney?
Median Population Age in Cheney is 37.3 Years.
What is the Average Family Size in Cheney
Average Family Size in Cheney is 3.9 People.
What is the Average Household Size in Cheney
Average Household Size in Cheney is 3.0 People.
How Large is the Labor Force in Cheney?
There are 1,085 People in the Labor Forcein in Cheney.
What is the Percentage of People in the Labor Force in Cheney?
60.8% of People are in the Labor Force in Cheney.
What is the Unemployment Rate in Cheney?
Unemployment Rate in Cheney is 2.5%.