Greensburg, KS Map & Demographics
Greensburg Map
Greensburg Overview
$34,747
PER CAPITA INCOME
$91,406
AVG FAMILY INCOME
$52,083
AVG HOUSEHOLD INCOME
38.9%
WAGE / INCOME GAP [ % ]
61.1¢/ $1
WAGE / INCOME GAP [ $ ]
0.46
INEQUALITY / GINI INDEX
629
TOTAL POPULATION
256
MALE POPULATION
373
FEMALE POPULATION
68.63
MALES / 100 FEMALES
145.70
FEMALES / 100 MALES
52.3
MEDIAN AGE
3.2
AVG FAMILY SIZE
2.1
AVG HOUSEHOLD SIZE
313
LABOR FORCE [ PEOPLE ]
62.1%
PERCENT IN LABOR FORCE
3.5%
UNEMPLOYMENT RATE
Greensburg Zip Codes
Greensburg Area Codes
Income in Greensburg
Income Overview in Greensburg
Per Capita Income in Greensburg is $34,747, while median incomes of families and households are $91,406 and $52,083 respectively.
| Characteristic | Number | Measure |
| Per Capita Income | 629 | $34,747 |
| Median Family Income | 135 | $91,406 |
| Mean Family Income | 135 | $97,841 |
| Median Household Income | 285 | $52,083 |
| Mean Household Income | 285 | $72,539 |
| Income Deficit | 135 | $0 |
| Wage / Income Gap (%) | 629 | 38.88% |
| Wage / Income Gap ($) | 629 | 61.12¢ per $1 |
| Gini / Inequality Index | 629 | 0.46 |
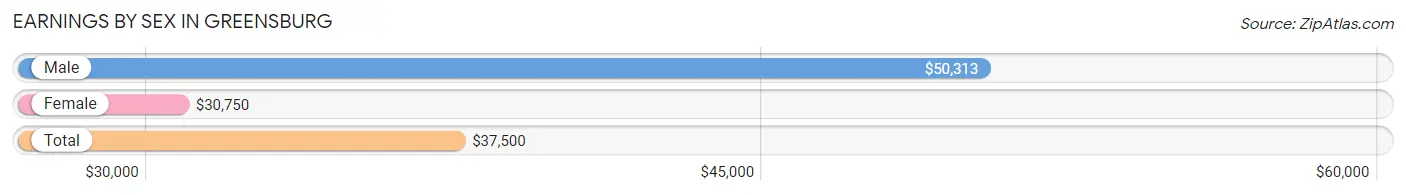
Earnings by Sex in Greensburg
Average Earnings in Greensburg are $37,500, $50,313 for men and $30,750 for women, a difference of 38.9%.
| Sex | Number | Average Earnings |
| Male | 131 (38.8%) | $50,313 |
| Female | 207 (61.2%) | $30,750 |
| Total | 338 (100.0%) | $37,500 |
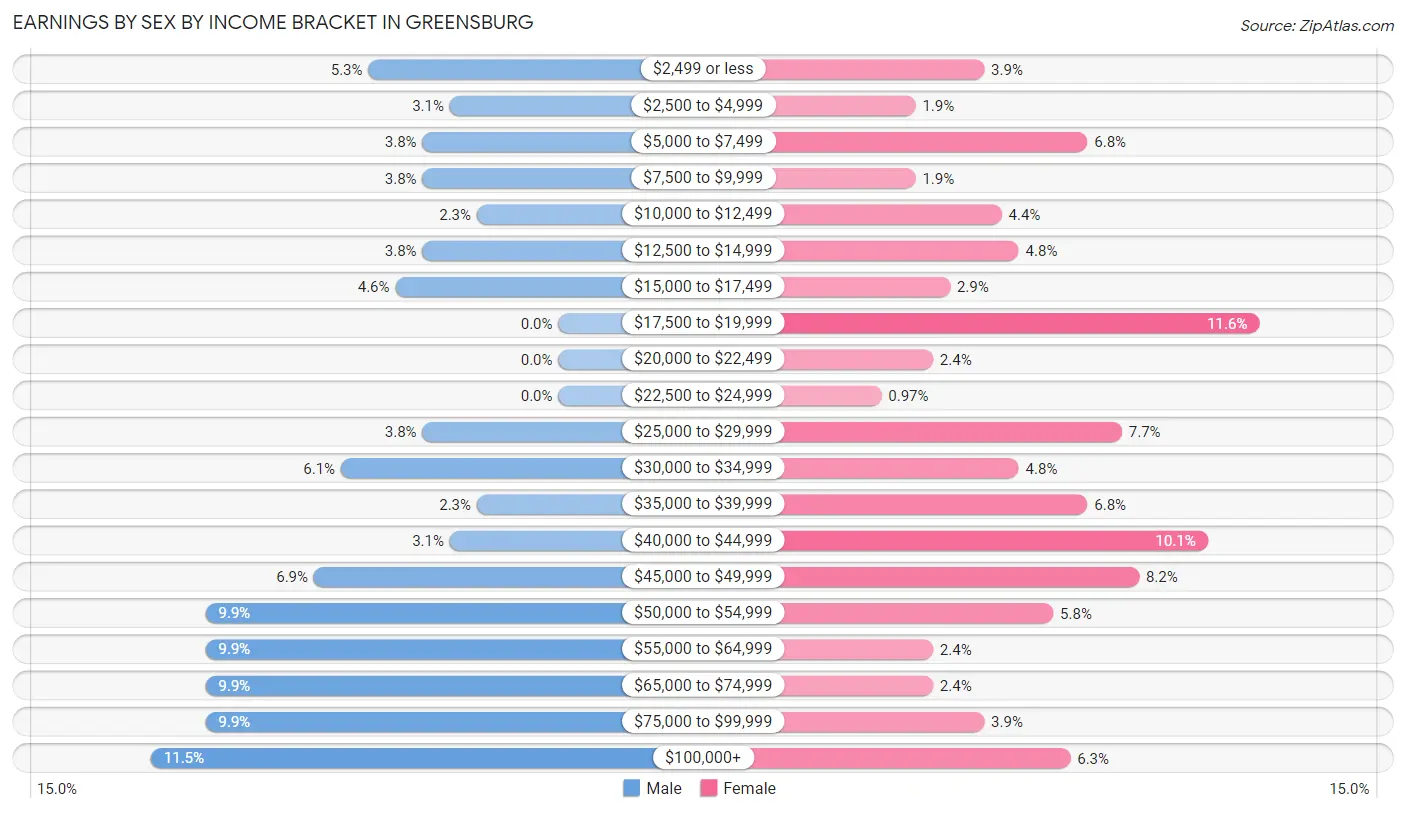
Earnings by Sex by Income Bracket in Greensburg
The most common earnings brackets in Greensburg are $100,000+ for men (15 | 11.5%) and $17,500 to $19,999 for women (24 | 11.6%).
| Income | Male | Female |
| $2,499 or less | 7 (5.3%) | 8 (3.9%) |
| $2,500 to $4,999 | 4 (3.0%) | 4 (1.9%) |
| $5,000 to $7,499 | 5 (3.8%) | 14 (6.8%) |
| $7,500 to $9,999 | 5 (3.8%) | 4 (1.9%) |
| $10,000 to $12,499 | 3 (2.3%) | 9 (4.3%) |
| $12,500 to $14,999 | 5 (3.8%) | 10 (4.8%) |
| $15,000 to $17,499 | 6 (4.6%) | 6 (2.9%) |
| $17,500 to $19,999 | 0 (0.0%) | 24 (11.6%) |
| $20,000 to $22,499 | 0 (0.0%) | 5 (2.4%) |
| $22,500 to $24,999 | 0 (0.0%) | 2 (1.0%) |
| $25,000 to $29,999 | 5 (3.8%) | 16 (7.7%) |
| $30,000 to $34,999 | 8 (6.1%) | 10 (4.8%) |
| $35,000 to $39,999 | 3 (2.3%) | 14 (6.8%) |
| $40,000 to $44,999 | 4 (3.0%) | 21 (10.1%) |
| $45,000 to $49,999 | 9 (6.9%) | 17 (8.2%) |
| $50,000 to $54,999 | 13 (9.9%) | 12 (5.8%) |
| $55,000 to $64,999 | 13 (9.9%) | 5 (2.4%) |
| $65,000 to $74,999 | 13 (9.9%) | 5 (2.4%) |
| $75,000 to $99,999 | 13 (9.9%) | 8 (3.9%) |
| $100,000+ | 15 (11.5%) | 13 (6.3%) |
| Total | 131 (100.0%) | 207 (100.0%) |
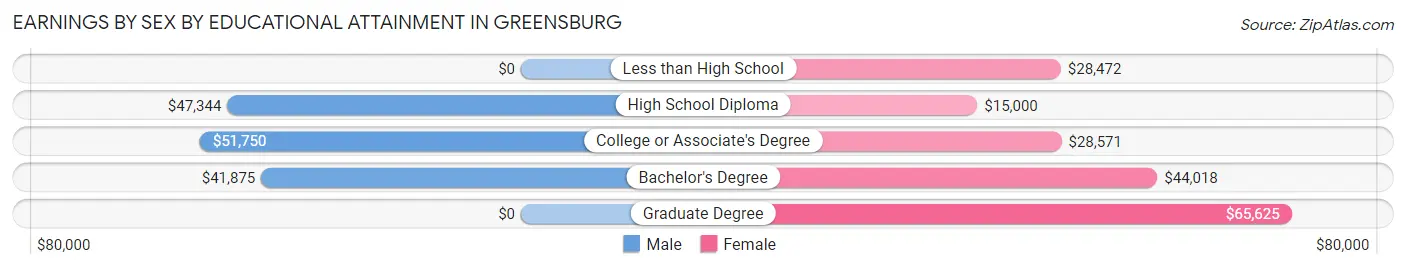
Earnings by Sex by Educational Attainment in Greensburg
Average earnings in Greensburg are $50,417 for men and $33,250 for women, a difference of 34.1%. Men with an educational attainment of college or associate's degree enjoy the highest average annual earnings of $51,750, while those with bachelor's degree education earn the least with $41,875. Women with an educational attainment of graduate degree earn the most with the average annual earnings of $65,625, while those with high school diploma education have the smallest earnings of $15,000.
| Educational Attainment | Male Income | Female Income |
| Less than High School | - | - |
| High School Diploma | $47,344 | $15,000 |
| College or Associate's Degree | $51,750 | $28,571 |
| Bachelor's Degree | $41,875 | $44,018 |
| Graduate Degree | - | - |
| Total | $50,417 | $33,250 |
Family Income in Greensburg
Family Income Brackets in Greensburg
According to the Greensburg family income data, there are 37 families falling into the $100,000 to $149,999 income range, which is the most common income bracket and makes up 27.4% of all families. Conversely, the $25,000 to $34,999 income bracket is the least frequent group with only 2 families (1.5%) belonging to this category.
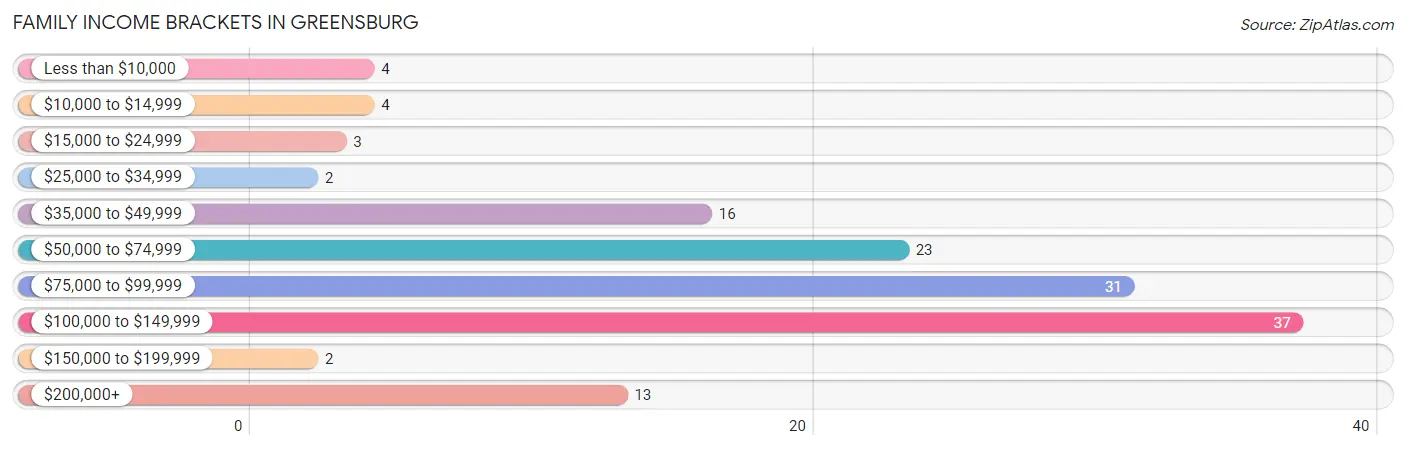
| Income Bracket | # Families | % Families |
| Less than $10,000 | 4 | 3.0% |
| $10,000 to $14,999 | 4 | 3.0% |
| $15,000 to $24,999 | 3 | 2.2% |
| $25,000 to $34,999 | 2 | 1.5% |
| $35,000 to $49,999 | 16 | 11.9% |
| $50,000 to $74,999 | 23 | 17.0% |
| $75,000 to $99,999 | 31 | 23.0% |
| $100,000 to $149,999 | 37 | 27.4% |
| $150,000 to $199,999 | 2 | 1.5% |
| $200,000+ | 13 | 9.6% |
Family Income by Famaliy Size in Greensburg
3-person families (27 | 20.0%) account for the highest median family income in Greensburg with $117,917 per family, while 3-person families (27 | 20.0%) have the highest median income of $39,306 per family member.
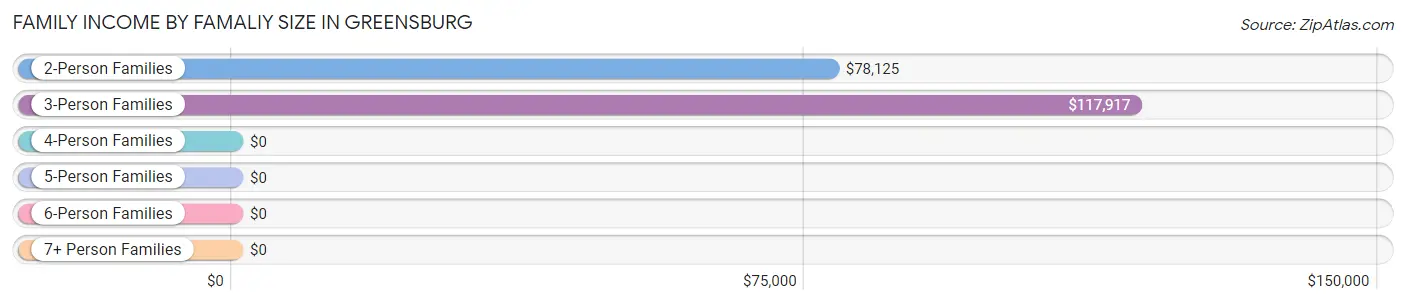
| Income Bracket | # Families | Median Income |
| 2-Person Families | 87 (64.4%) | $78,125 |
| 3-Person Families | 27 (20.0%) | $117,917 |
| 4-Person Families | 8 (5.9%) | $0 |
| 5-Person Families | 12 (8.9%) | $0 |
| 6-Person Families | 0 (0.0%) | $0 |
| 7+ Person Families | 1 (0.7%) | $0 |
| Total | 135 (100.0%) | $91,406 |
Family Income by Number of Earners in Greensburg
The median family income in Greensburg is $91,406, with families comprising 3+ earners (11) having the highest median family income of $129,583, while families with 1 earner (27) have the lowest median family income of $48,125, accounting for 8.2% and 20.0% of families, respectively.
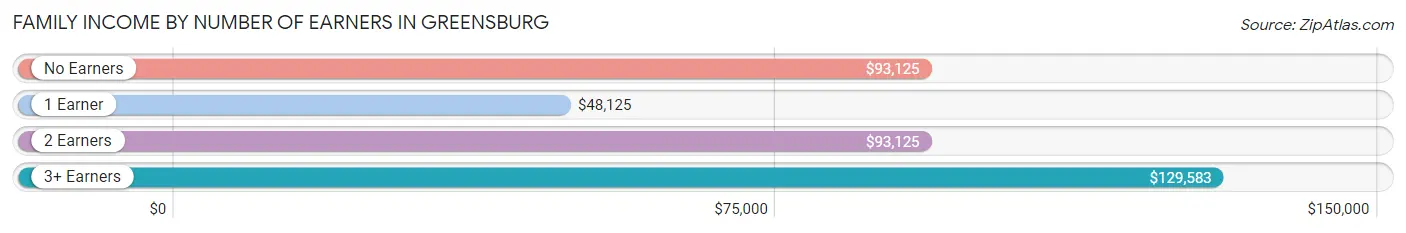
| Number of Earners | # Families | Median Income |
| No Earners | 16 (11.8%) | $93,125 |
| 1 Earner | 27 (20.0%) | $48,125 |
| 2 Earners | 81 (60.0%) | $93,125 |
| 3+ Earners | 11 (8.2%) | $129,583 |
| Total | 135 (100.0%) | $91,406 |
Household Income in Greensburg
Household Income Brackets in Greensburg
With 48 households falling in the category, the $15,000 to $24,999 income range is the most frequent in Greensburg, accounting for 16.8% of all households. In contrast, only 2 households (0.7%) fall into the $150,000 to $199,999 income bracket, making it the least populous group.
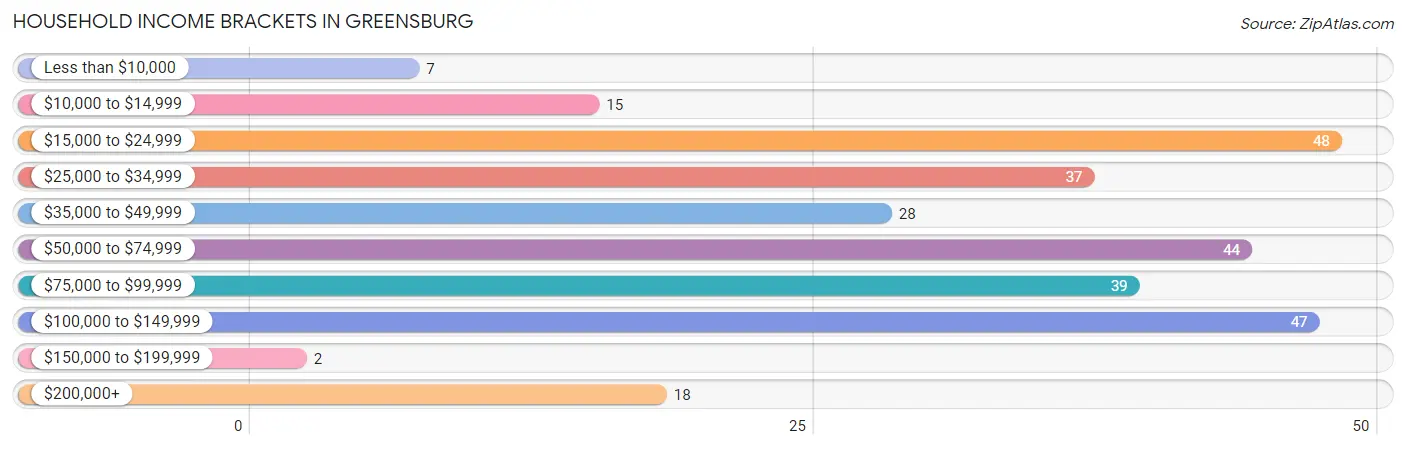
| Income Bracket | # Households | % Households |
| Less than $10,000 | 7 | 2.5% |
| $10,000 to $14,999 | 15 | 5.3% |
| $15,000 to $24,999 | 48 | 16.8% |
| $25,000 to $34,999 | 37 | 13.0% |
| $35,000 to $49,999 | 28 | 9.8% |
| $50,000 to $74,999 | 44 | 15.4% |
| $75,000 to $99,999 | 39 | 13.7% |
| $100,000 to $149,999 | 47 | 16.5% |
| $150,000 to $199,999 | 2 | 0.7% |
| $200,000+ | 18 | 6.3% |
Household Income by Householder Age in Greensburg
The median household income in Greensburg is $52,083, with the highest median household income of $76,667 found in the 45 to 64 years age bracket for the primary householder. A total of 122 households (42.8%) fall into this category. Meanwhile, the 15 to 24 years age bracket for the primary householder has the lowest median household income of $0, with 6 households (2.1%) in this group.
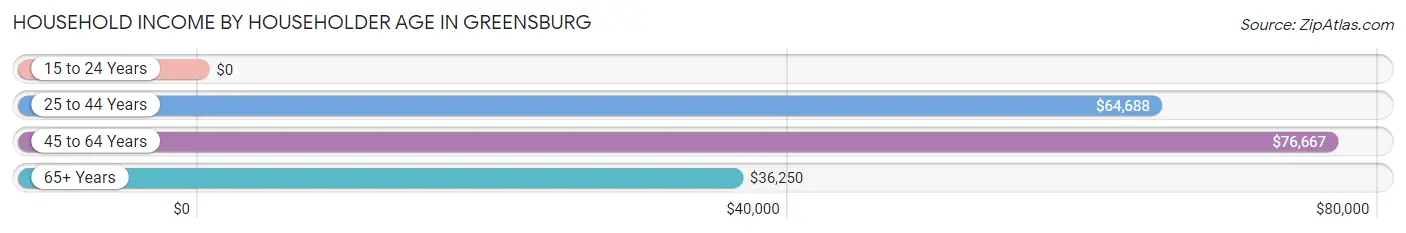
| Income Bracket | # Households | Median Income |
| 15 to 24 Years | 6 (2.1%) | $0 |
| 25 to 44 Years | 51 (17.9%) | $64,688 |
| 45 to 64 Years | 122 (42.8%) | $76,667 |
| 65+ Years | 106 (37.2%) | $36,250 |
| Total | 285 (100.0%) | $52,083 |
Poverty in Greensburg
Income Below Poverty by Sex and Age in Greensburg
With 4.1% poverty level for males and 12.5% for females among the residents of Greensburg, 35 to 44 year old males and 15 year old females are the most vulnerable to poverty, with 6 males (31.6%) and 3 females (100.0%) in their respective age groups living below the poverty level.
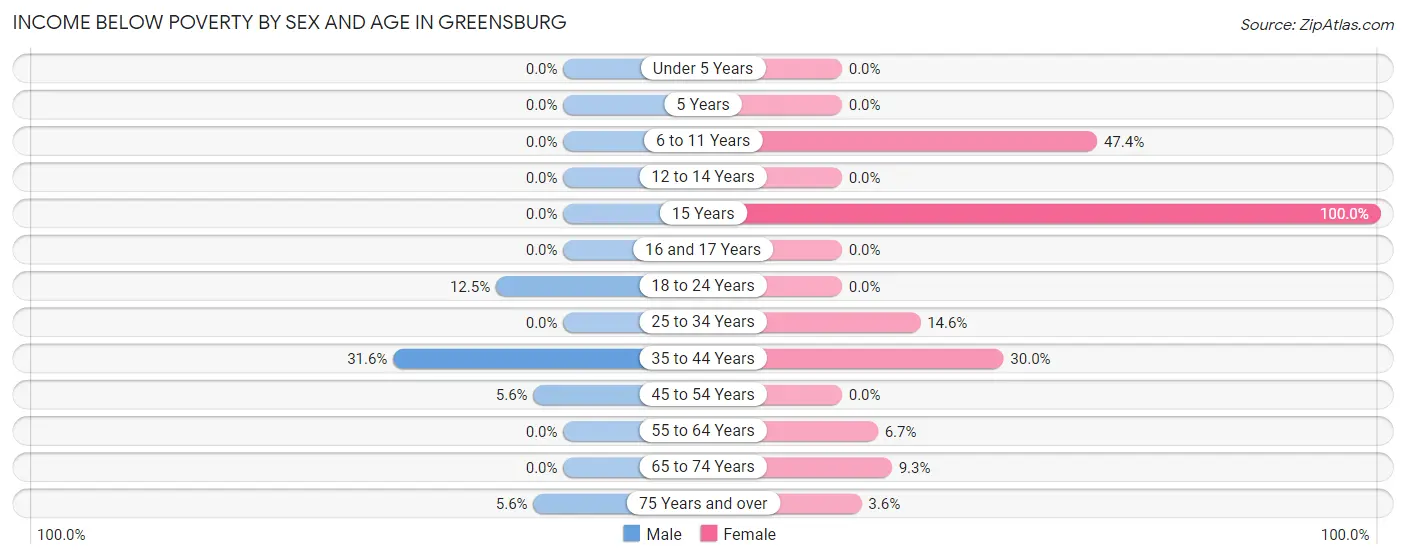
| Age Bracket | Male | Female |
| Under 5 Years | 0 (0.0%) | 0 (0.0%) |
| 5 Years | 0 (0.0%) | 0 (0.0%) |
| 6 to 11 Years | 0 (0.0%) | 18 (47.4%) |
| 12 to 14 Years | 0 (0.0%) | 0 (0.0%) |
| 15 Years | 0 (0.0%) | 3 (100.0%) |
| 16 and 17 Years | 0 (0.0%) | 0 (0.0%) |
| 18 to 24 Years | 1 (12.5%) | 0 (0.0%) |
| 25 to 34 Years | 0 (0.0%) | 8 (14.5%) |
| 35 to 44 Years | 6 (31.6%) | 6 (30.0%) |
| 45 to 54 Years | 2 (5.6%) | 0 (0.0%) |
| 55 to 64 Years | 0 (0.0%) | 4 (6.7%) |
| 65 to 74 Years | 0 (0.0%) | 5 (9.3%) |
| 75 Years and over | 1 (5.6%) | 2 (3.6%) |
| Total | 10 (4.1%) | 46 (12.5%) |
Income Above Poverty by Sex and Age in Greensburg
According to the poverty statistics in Greensburg, males aged under 5 years and females aged under 5 years are the age groups that are most secure financially, with 100.0% of males and 100.0% of females in these age groups living above the poverty line.
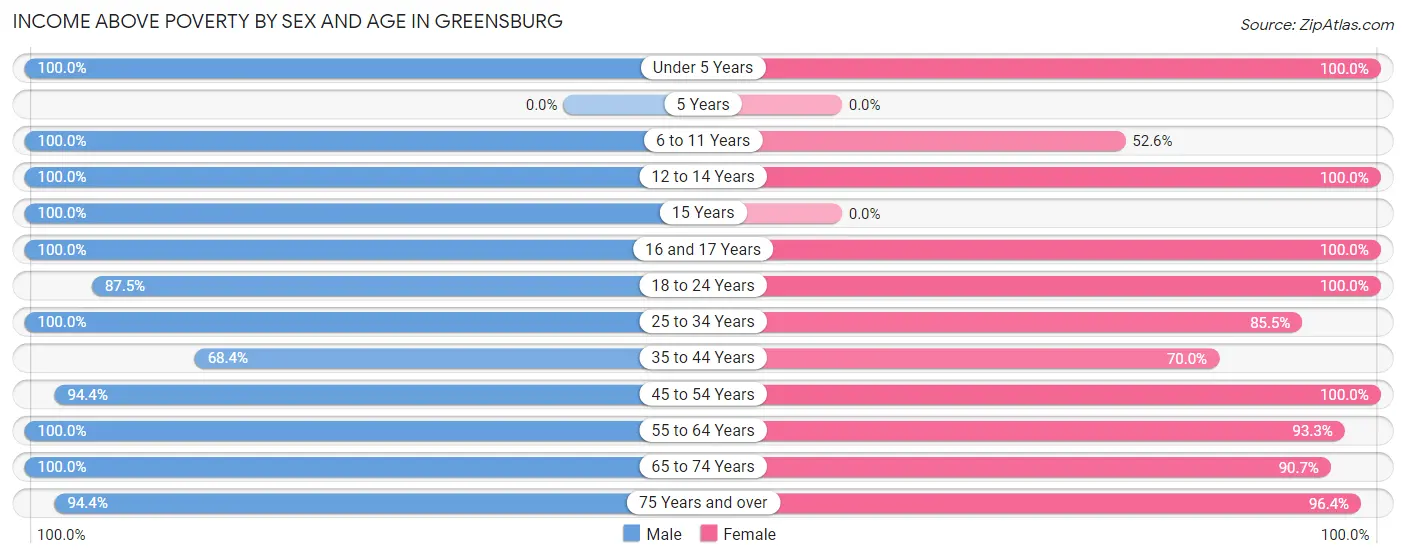
| Age Bracket | Male | Female |
| Under 5 Years | 35 (100.0%) | 15 (100.0%) |
| 5 Years | 0 (0.0%) | 0 (0.0%) |
| 6 to 11 Years | 21 (100.0%) | 20 (52.6%) |
| 12 to 14 Years | 5 (100.0%) | 5 (100.0%) |
| 15 Years | 2 (100.0%) | 0 (0.0%) |
| 16 and 17 Years | 7 (100.0%) | 7 (100.0%) |
| 18 to 24 Years | 7 (87.5%) | 3 (100.0%) |
| 25 to 34 Years | 5 (100.0%) | 47 (85.5%) |
| 35 to 44 Years | 13 (68.4%) | 14 (70.0%) |
| 45 to 54 Years | 34 (94.4%) | 52 (100.0%) |
| 55 to 64 Years | 48 (100.0%) | 56 (93.3%) |
| 65 to 74 Years | 38 (100.0%) | 49 (90.7%) |
| 75 Years and over | 17 (94.4%) | 53 (96.4%) |
| Total | 232 (95.9%) | 321 (87.5%) |
Income Below Poverty Among Married-Couple Families in Greensburg
The poverty statistics for married-couple families in Greensburg show that 1.8% or 2 of the total 113 families live below the poverty line. Families with 1 or 2 children have the highest poverty rate of 7.7%, comprising of 2 families. On the other hand, families with no children have the lowest poverty rate of 0.0%, which includes 0 families.
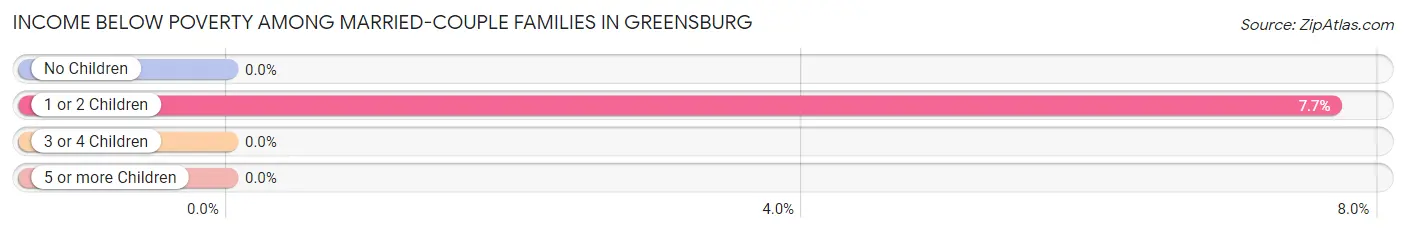
| Children | Above Poverty | Below Poverty |
| No Children | 74 (100.0%) | 0 (0.0%) |
| 1 or 2 Children | 24 (92.3%) | 2 (7.7%) |
| 3 or 4 Children | 12 (100.0%) | 0 (0.0%) |
| 5 or more Children | 1 (100.0%) | 0 (0.0%) |
| Total | 111 (98.2%) | 2 (1.8%) |
Income Below Poverty Among Single-Parent Households in Greensburg
According to the poverty data in Greensburg, 66.7% or 2 single-father households and 31.6% or 6 single-mother households are living below the poverty line. Among single-father households, those with 1 or 2 children have the highest poverty rate, with 2 households (100.0%) experiencing poverty. Likewise, among single-mother households, those with 1 or 2 children have the highest poverty rate, with 4 households (57.1%) falling below the poverty line.
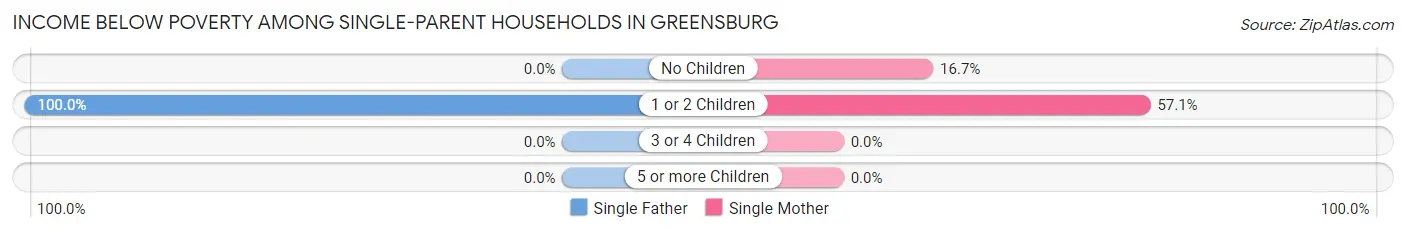
| Children | Single Father | Single Mother |
| No Children | 0 (0.0%) | 2 (16.7%) |
| 1 or 2 Children | 2 (100.0%) | 4 (57.1%) |
| 3 or 4 Children | 0 (0.0%) | 0 (0.0%) |
| 5 or more Children | 0 (0.0%) | 0 (0.0%) |
| Total | 2 (66.7%) | 6 (31.6%) |
Income Below Poverty Among Married-Couple vs Single-Parent Households in Greensburg
The poverty data for Greensburg shows that 2 of the married-couple family households (1.8%) and 8 of the single-parent households (36.4%) are living below the poverty level. Within the married-couple family households, those with 1 or 2 children have the highest poverty rate, with 2 households (7.7%) falling below the poverty line. Among the single-parent households, those with 1 or 2 children have the highest poverty rate, with 6 household (66.7%) living below poverty.
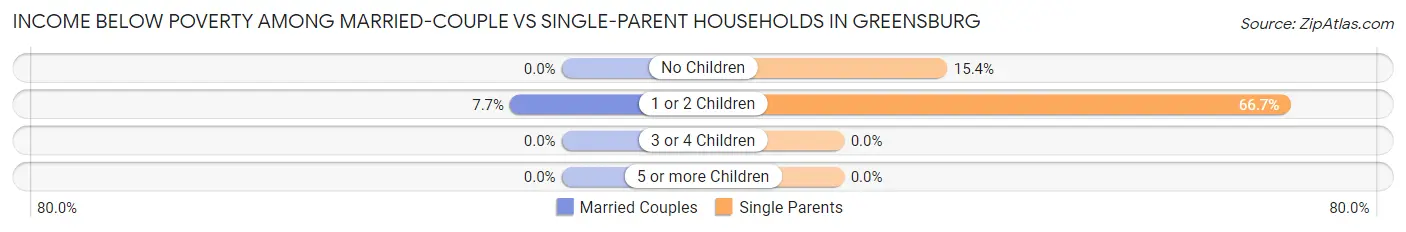
| Children | Married-Couple Families | Single-Parent Households |
| No Children | 0 (0.0%) | 2 (15.4%) |
| 1 or 2 Children | 2 (7.7%) | 6 (66.7%) |
| 3 or 4 Children | 0 (0.0%) | 0 (0.0%) |
| 5 or more Children | 0 (0.0%) | 0 (0.0%) |
| Total | 2 (1.8%) | 8 (36.4%) |
Race in Greensburg
The most populous races in Greensburg are White / Caucasian (574 | 91.3%), Hispanic or Latino (50 | 8.0%), and Two or more Races (32 | 5.1%).
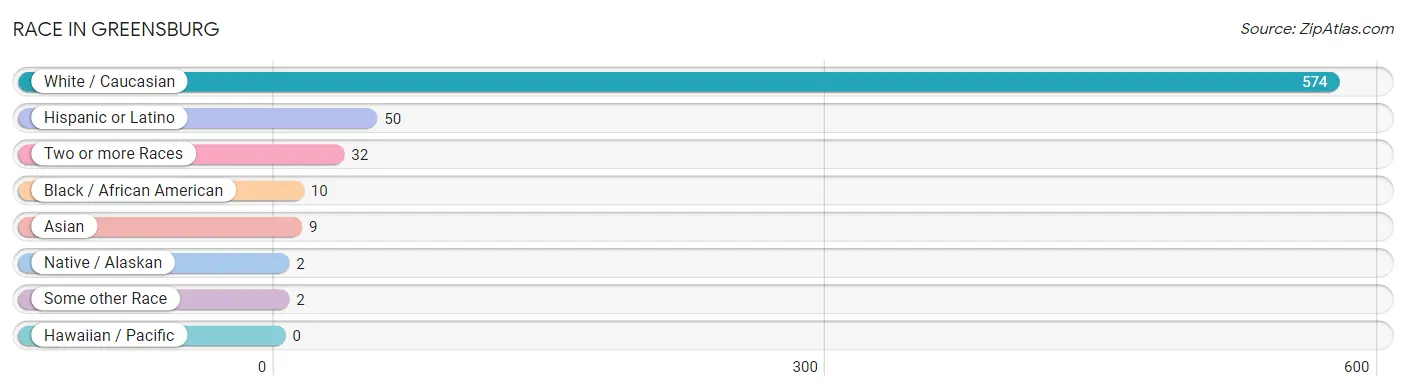
| Race | # Population | % Population |
| Asian | 9 | 1.4% |
| Black / African American | 10 | 1.6% |
| Hawaiian / Pacific | 0 | 0.0% |
| Hispanic or Latino | 50 | 8.0% |
| Native / Alaskan | 2 | 0.3% |
| White / Caucasian | 574 | 91.3% |
| Two or more Races | 32 | 5.1% |
| Some other Race | 2 | 0.3% |
| Total | 629 | 100.0% |
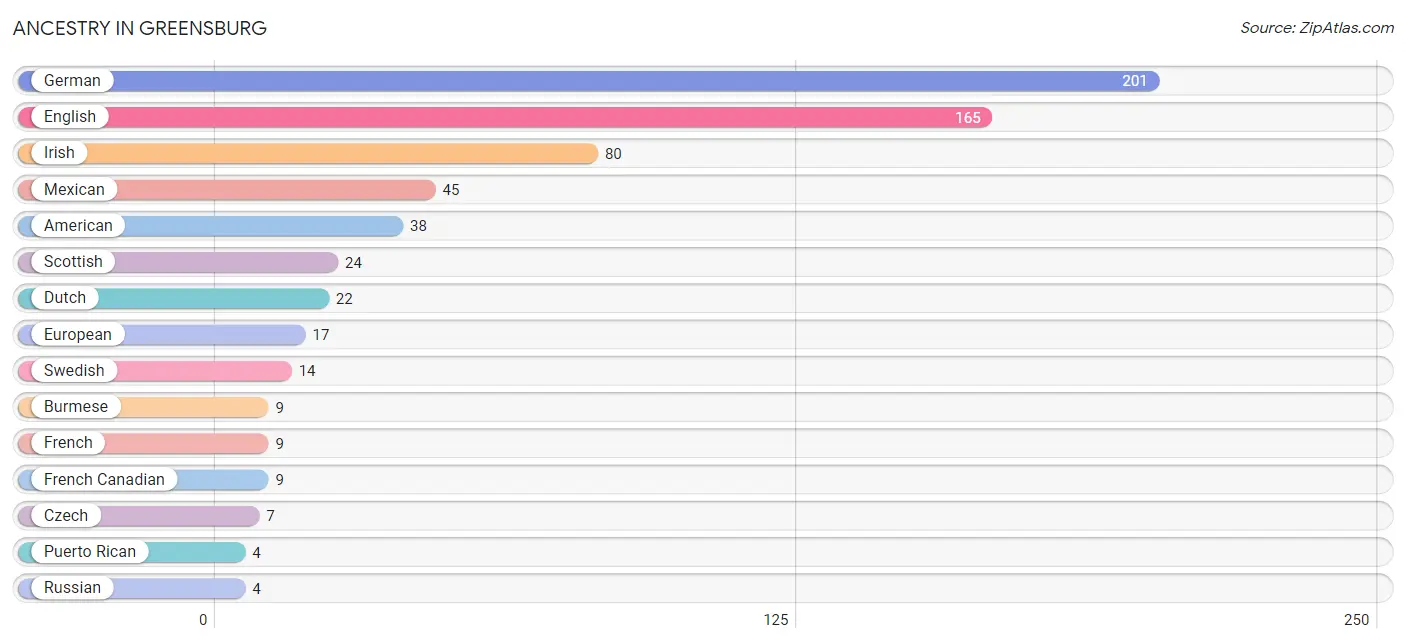
Ancestry in Greensburg
The most populous ancestries reported in Greensburg are German (201 | 32.0%), English (165 | 26.2%), Irish (80 | 12.7%), Mexican (45 | 7.1%), and American (38 | 6.0%), together accounting for 84.1% of all Greensburg residents.
| Ancestry | # Population | % Population |
| American | 38 | 6.0% |
| Austrian | 3 | 0.5% |
| Bhutanese | 1 | 0.2% |
| Burmese | 9 | 1.4% |
| Cajun | 1 | 0.2% |
| Central American | 1 | 0.2% |
| Cherokee | 1 | 0.2% |
| Choctaw | 1 | 0.2% |
| Croatian | 2 | 0.3% |
| Czech | 7 | 1.1% |
| Dutch | 22 | 3.5% |
| Eastern European | 2 | 0.3% |
| English | 165 | 26.2% |
| European | 17 | 2.7% |
| French | 9 | 1.4% |
| French Canadian | 9 | 1.4% |
| German | 201 | 32.0% |
| Guatemalan | 1 | 0.2% |
| Irish | 80 | 12.7% |
| Italian | 2 | 0.3% |
| Mexican | 45 | 7.1% |
| Norwegian | 2 | 0.3% |
| Puerto Rican | 4 | 0.6% |
| Russian | 4 | 0.6% |
| Scandinavian | 2 | 0.3% |
| Scotch-Irish | 4 | 0.6% |
| Scottish | 24 | 3.8% |
| Swedish | 14 | 2.2% |
| Thai | 1 | 0.2% |
| Ukrainian | 2 | 0.3% | View All 30 Rows |
Immigrants in Greensburg
The most numerous immigrant groups reported in Greensburg came from Central America (12 | 1.9%), Latin America (12 | 1.9%), Mexico (11 | 1.8%), Asia (9 | 1.4%), and Eastern Asia (9 | 1.4%), together accounting for 8.4% of all Greensburg residents.
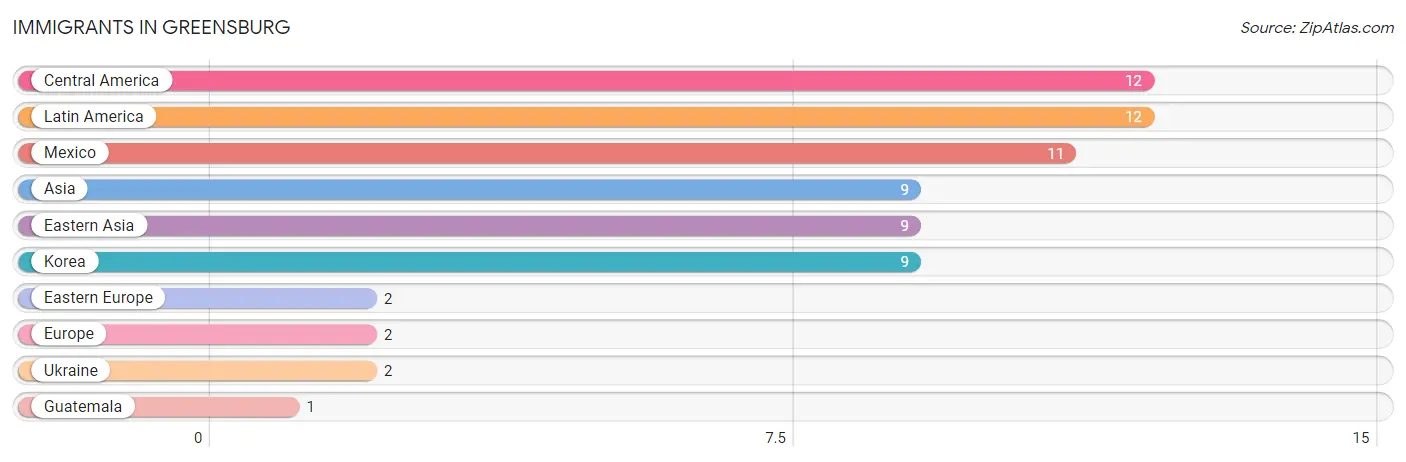
| Immigration Origin | # Population | % Population |
| Asia | 9 | 1.4% |
| Central America | 12 | 1.9% |
| Eastern Asia | 9 | 1.4% |
| Eastern Europe | 2 | 0.3% |
| Europe | 2 | 0.3% |
| Guatemala | 1 | 0.2% |
| Korea | 9 | 1.4% |
| Latin America | 12 | 1.9% |
| Mexico | 11 | 1.8% |
| Ukraine | 2 | 0.3% | View All 10 Rows |
Sex and Age in Greensburg
Sex and Age in Greensburg
The most populous age groups in Greensburg are Under 5 Years (35 | 13.7%) for men and 60 to 64 Years (43 | 11.5%) for women.
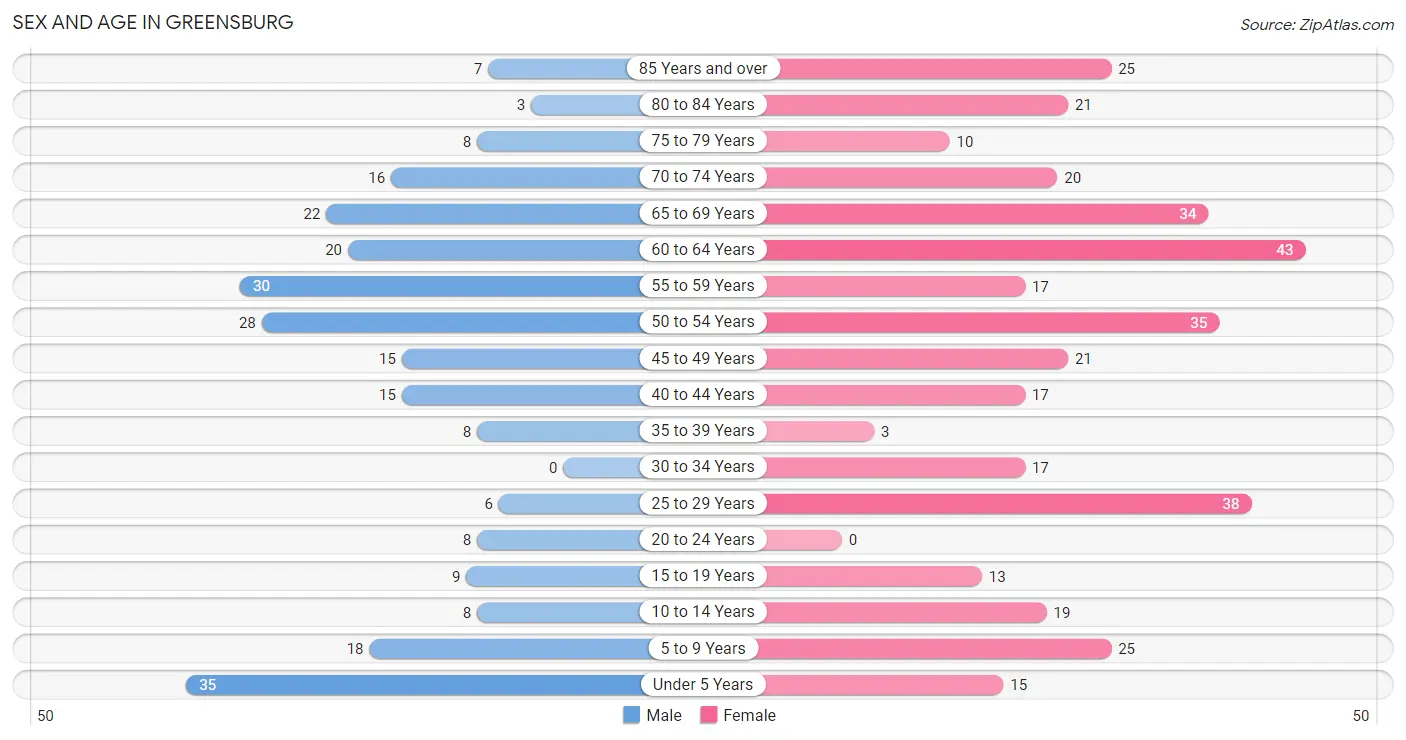
| Age Bracket | Male | Female |
| Under 5 Years | 35 (13.7%) | 15 (4.0%) |
| 5 to 9 Years | 18 (7.0%) | 25 (6.7%) |
| 10 to 14 Years | 8 (3.1%) | 19 (5.1%) |
| 15 to 19 Years | 9 (3.5%) | 13 (3.5%) |
| 20 to 24 Years | 8 (3.1%) | 0 (0.0%) |
| 25 to 29 Years | 6 (2.3%) | 38 (10.2%) |
| 30 to 34 Years | 0 (0.0%) | 17 (4.6%) |
| 35 to 39 Years | 8 (3.1%) | 3 (0.8%) |
| 40 to 44 Years | 15 (5.9%) | 17 (4.6%) |
| 45 to 49 Years | 15 (5.9%) | 21 (5.6%) |
| 50 to 54 Years | 28 (10.9%) | 35 (9.4%) |
| 55 to 59 Years | 30 (11.7%) | 17 (4.6%) |
| 60 to 64 Years | 20 (7.8%) | 43 (11.5%) |
| 65 to 69 Years | 22 (8.6%) | 34 (9.1%) |
| 70 to 74 Years | 16 (6.2%) | 20 (5.4%) |
| 75 to 79 Years | 8 (3.1%) | 10 (2.7%) |
| 80 to 84 Years | 3 (1.2%) | 21 (5.6%) |
| 85 Years and over | 7 (2.7%) | 25 (6.7%) |
| Total | 256 (100.0%) | 373 (100.0%) |
Families and Households in Greensburg
Median Family Size in Greensburg
The median family size in Greensburg is 3.21 persons per family, with single male/father families (3 | 2.2%) accounting for the largest median family size of 5 persons per family. On the other hand, single female/mother families (19 | 14.1%) represent the smallest median family size with 2.42 persons per family.
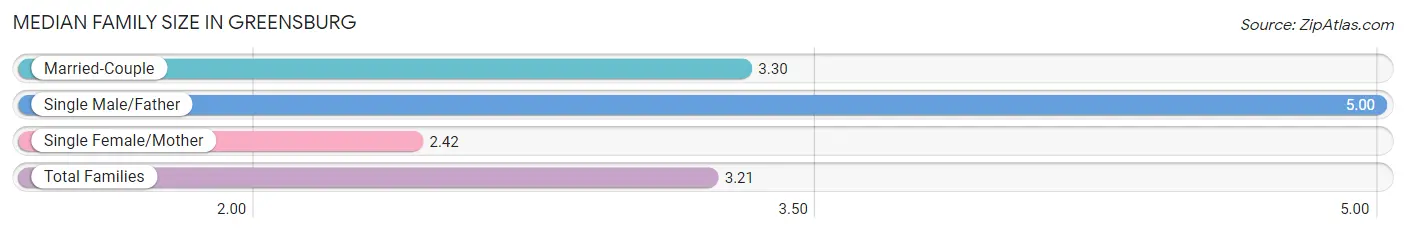
| Family Type | # Families | Family Size |
| Married-Couple | 113 (83.7%) | 3.30 |
| Single Male/Father | 3 (2.2%) | 5.00 |
| Single Female/Mother | 19 (14.1%) | 2.42 |
| Total Families | 135 (100.0%) | 3.21 |
Median Household Size in Greensburg
The median household size in Greensburg is 2.11 persons per household, with single male/father households (3 | 1.1%) accounting for the largest median household size of 5.33 persons per household. non-family households (150 | 52.6%) represent the smallest median household size with 1.11 persons per household.
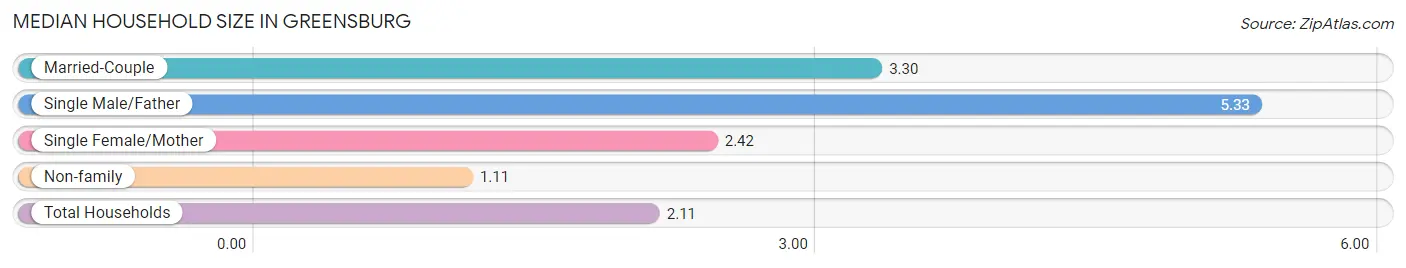
| Household Type | # Households | Household Size |
| Married-Couple | 113 (39.7%) | 3.30 |
| Single Male/Father | 3 (1.1%) | 5.33 |
| Single Female/Mother | 19 (6.7%) | 2.42 |
| Non-family | 150 (52.6%) | 1.11 |
| Total Households | 285 (100.0%) | 2.11 |
Household Size by Marriage Status in Greensburg
Out of a total of 285 households in Greensburg, 135 (47.4%) are family households, while 150 (52.6%) are nonfamily households. The most numerous type of family households are 2-person households, comprising 86, and the most common type of nonfamily households are 1-person households, comprising 137.
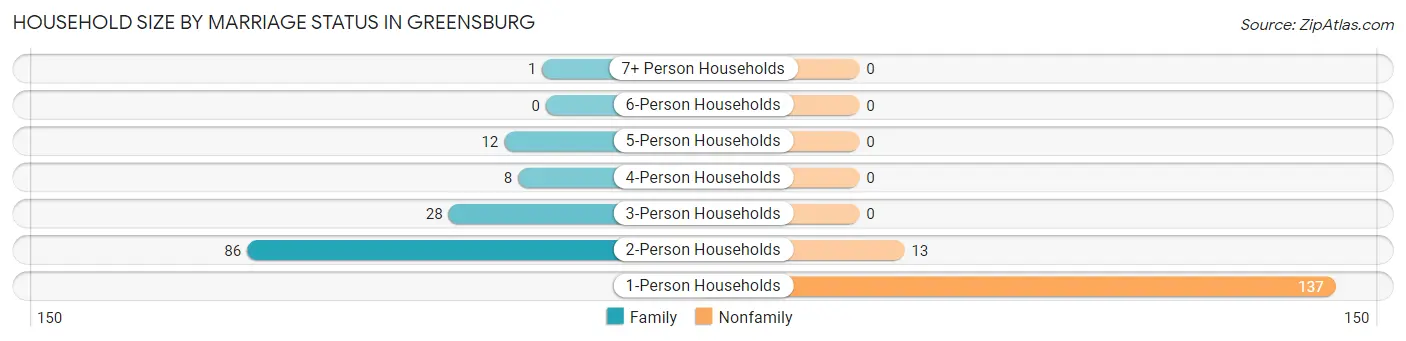
| Household Size | Family Households | Nonfamily Households |
| 1-Person Households | - | 137 (48.1%) |
| 2-Person Households | 86 (30.2%) | 13 (4.6%) |
| 3-Person Households | 28 (9.8%) | 0 (0.0%) |
| 4-Person Households | 8 (2.8%) | 0 (0.0%) |
| 5-Person Households | 12 (4.2%) | 0 (0.0%) |
| 6-Person Households | 0 (0.0%) | 0 (0.0%) |
| 7+ Person Households | 1 (0.4%) | 0 (0.0%) |
| Total | 135 (47.4%) | 150 (52.6%) |
Female Fertility in Greensburg
Fertility by Age in Greensburg
Average fertility rate in Greensburg is 35.0 births per 1,000 women. Women in the age bracket of 20 to 34 years have the highest fertility rate with 73.0 births per 1,000 women. Women in the age bracket of 20 to 34 years acount for 100.0% of all women with births.
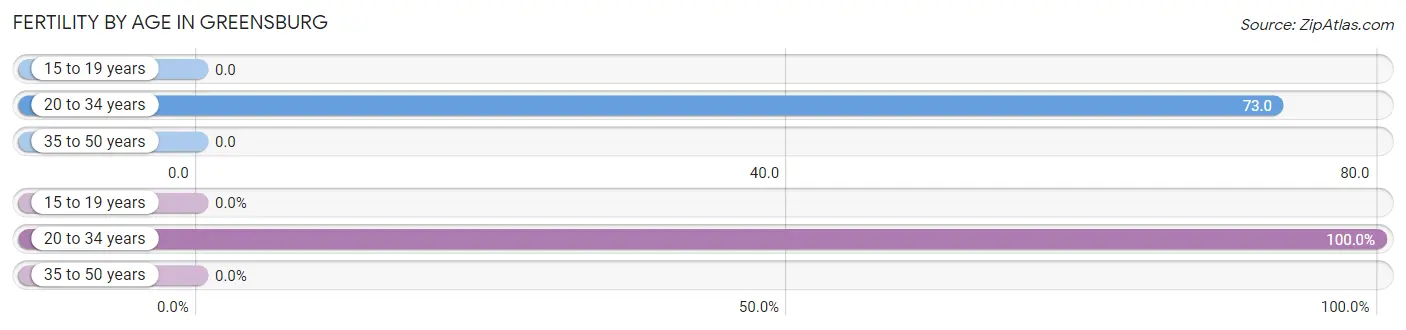
| Age Bracket | Women with Births | Births / 1,000 Women |
| 15 to 19 years | 0 (0.0%) | 0.0 |
| 20 to 34 years | 4 (100.0%) | 73.0 |
| 35 to 50 years | 0 (0.0%) | 0.0 |
| Total | 4 (100.0%) | 35.0 |
Fertility by Age by Marriage Status in Greensburg
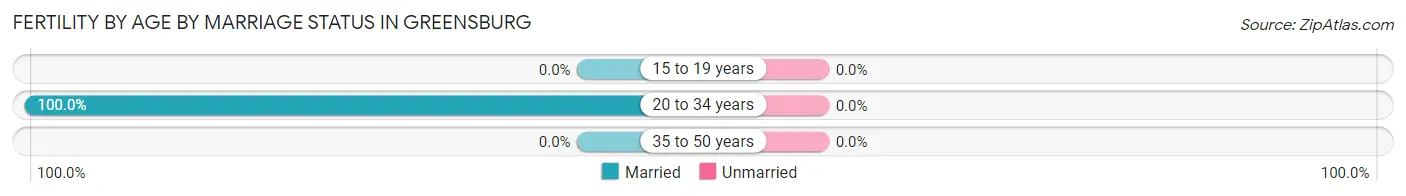
| Age Bracket | Married | Unmarried |
| 15 to 19 years | 0 (0.0%) | 0 (0.0%) |
| 20 to 34 years | 4 (100.0%) | 0 (0.0%) |
| 35 to 50 years | 0 (0.0%) | 0 (0.0%) |
| Total | 4 (100.0%) | 0 (0.0%) |
Fertility by Education in Greensburg
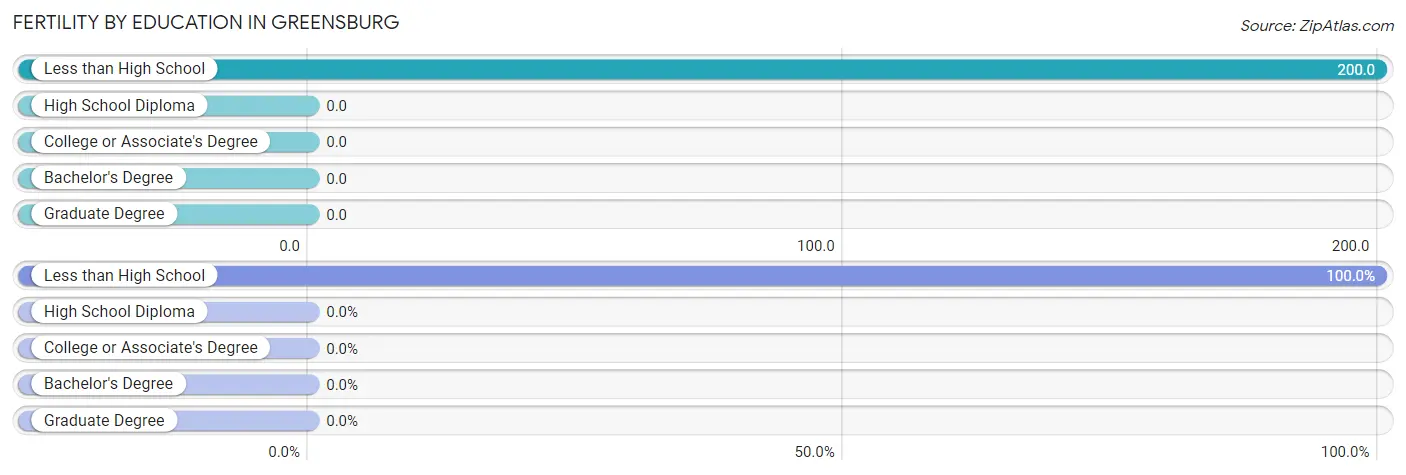
| Educational Attainment | Women with Births | Births / 1,000 Women |
| Less than High School | 4 (100.0%) | 200.0 |
| High School Diploma | 0 (0.0%) | 0.0 |
| College or Associate's Degree | 0 (0.0%) | 0.0 |
| Bachelor's Degree | 0 (0.0%) | 0.0 |
| Graduate Degree | 0 (0.0%) | 0.0 |
| Total | 4 (100.0%) | 35.0 |
Fertility by Education by Marriage Status in Greensburg
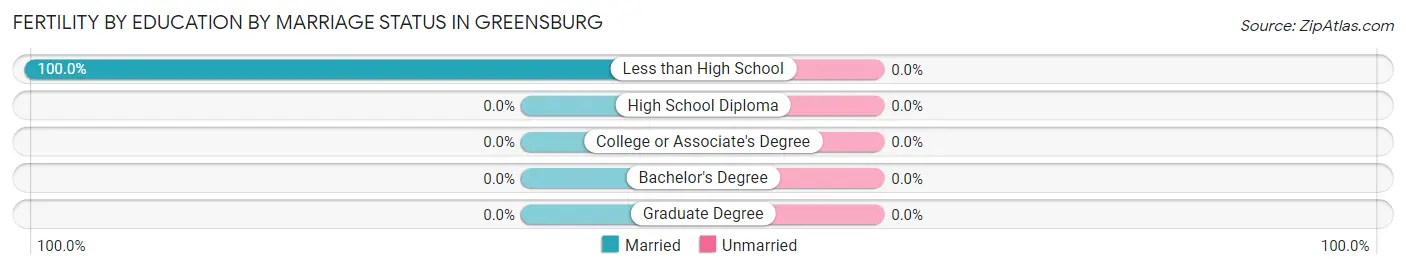
| Educational Attainment | Married | Unmarried |
| Less than High School | 4 (100.0%) | 0 (0.0%) |
| High School Diploma | 0 (0.0%) | 0 (0.0%) |
| College or Associate's Degree | 0 (0.0%) | 0 (0.0%) |
| Bachelor's Degree | 0 (0.0%) | 0 (0.0%) |
| Graduate Degree | 0 (0.0%) | 0 (0.0%) |
| Total | 4 (100.0%) | 0 (0.0%) |
Employment Characteristics in Greensburg
Employment by Class of Employer in Greensburg
Among the 297 employed individuals in Greensburg, private company employees (153 | 51.5%), local government employees (69 | 23.2%), and self-employed (not incorporated) (31 | 10.4%) make up the most common classes of employment.
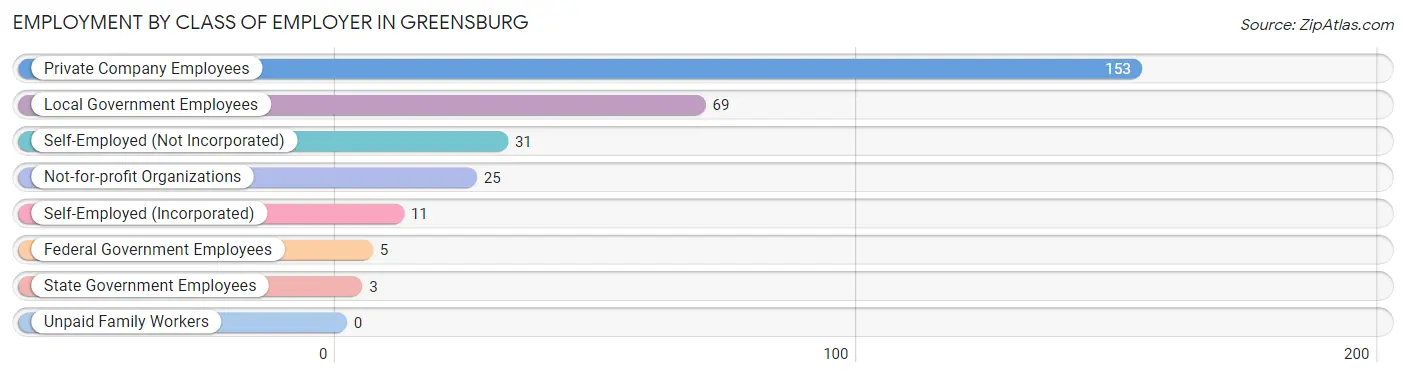
| Employer Class | # Employees | % Employees |
| Private Company Employees | 153 | 51.5% |
| Self-Employed (Incorporated) | 11 | 3.7% |
| Self-Employed (Not Incorporated) | 31 | 10.4% |
| Not-for-profit Organizations | 25 | 8.4% |
| Local Government Employees | 69 | 23.2% |
| State Government Employees | 3 | 1.0% |
| Federal Government Employees | 5 | 1.7% |
| Unpaid Family Workers | 0 | 0.0% |
| Total | 297 | 100.0% |
Employment Status by Age in Greensburg
According to the labor force statistics for Greensburg, out of the total population over 16 years of age (504), 62.1% or 313 individuals are in the labor force, with 3.5% or 11 of them unemployed. The age group with the highest labor force participation rate is 60 to 64 years, with 95.2% or 60 individuals in the labor force. Within the labor force, the 30 to 34 years age range has the highest percentage of unemployed individuals, with 26.7% or 4 of them being unemployed.

| Age Bracket | In Labor Force | Unemployed |
| 16 to 19 Years | 12 (70.6%) | 0 (0.0%) |
| 20 to 24 Years | 7 (87.5%) | 0 (0.0%) |
| 25 to 29 Years | 39 (88.6%) | 0 (0.0%) |
| 30 to 34 Years | 15 (88.2%) | 4 (26.7%) |
| 35 to 44 Years | 29 (67.4%) | 2 (6.9%) |
| 45 to 54 Years | 83 (83.8%) | 0 (0.0%) |
| 55 to 59 Years | 34 (72.3%) | 0 (0.0%) |
| 60 to 64 Years | 60 (95.2%) | 0 (0.0%) |
| 65 to 74 Years | 30 (32.6%) | 5 (16.7%) |
| 75 Years and over | 4 (5.4%) | 0 (0.0%) |
| Total | 313 (62.1%) | 11 (3.5%) |
Employment Status by Educational Attainment in Greensburg
According to labor force statistics for Greensburg, 83.1% of individuals (260) out of the total population between 25 and 64 years of age (313) are in the labor force, with 2.3% or 6 of them being unemployed. The group with the highest labor force participation rate are those with the educational attainment of bachelor's degree or higher, with 97.3% or 72 individuals in the labor force. Within the labor force, individuals with college / associate degree education have the highest percentage of unemployment, with 5.6% or 6 of them being unemployed.
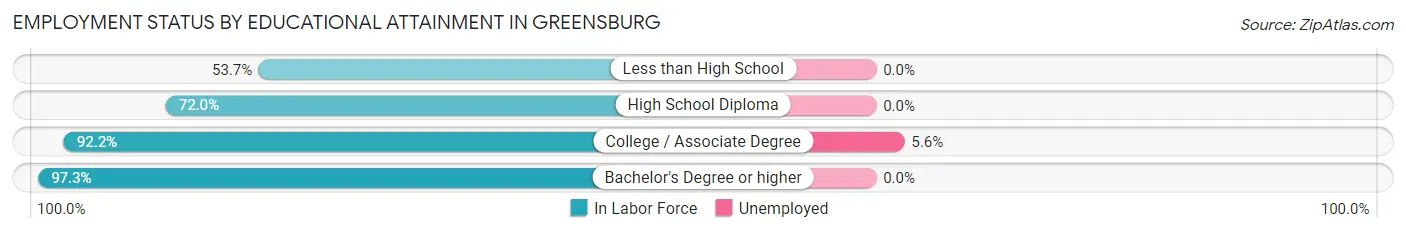
| Educational Attainment | In Labor Force | Unemployed |
| Less than High School | 22 (53.7%) | 0 (0.0%) |
| High School Diploma | 59 (72.0%) | 0 (0.0%) |
| College / Associate Degree | 107 (92.2%) | 6 (5.6%) |
| Bachelor's Degree or higher | 72 (97.3%) | 0 (0.0%) |
| Total | 260 (83.1%) | 7 (2.3%) |
Employment Occupations by Sex in Greensburg
Management, Business, Science and Arts Occupations
The most common Management, Business, Science and Arts occupations in Greensburg are Community & Social Service (49 | 16.2%), Education Instruction & Library (41 | 13.6%), Management (28 | 9.3%), Health Diagnosing & Treating (22 | 7.3%), and Business & Financial (15 | 5.0%).
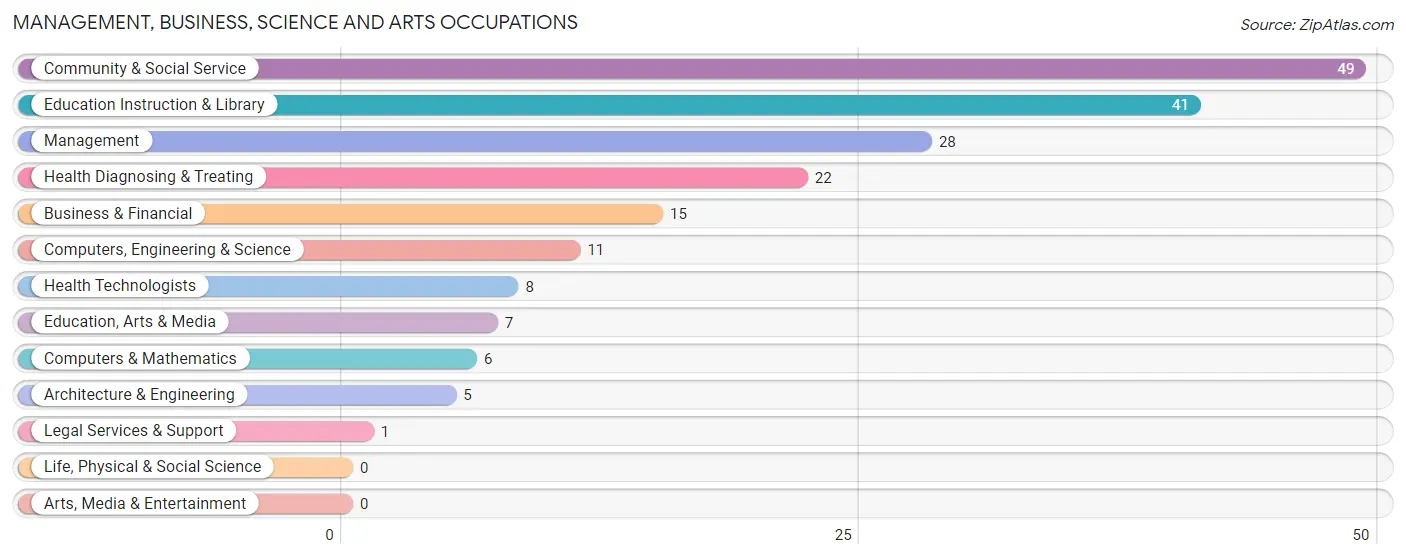
Management, Business, Science and Arts Occupations by Sex
Within the Management, Business, Science and Arts occupations in Greensburg, the most male-oriented occupations are Legal Services & Support (100.0%), Management (67.9%), and Business & Financial (60.0%), while the most female-oriented occupations are Health Technologists (100.0%), Health Diagnosing & Treating (95.5%), and Education Instruction & Library (90.2%).
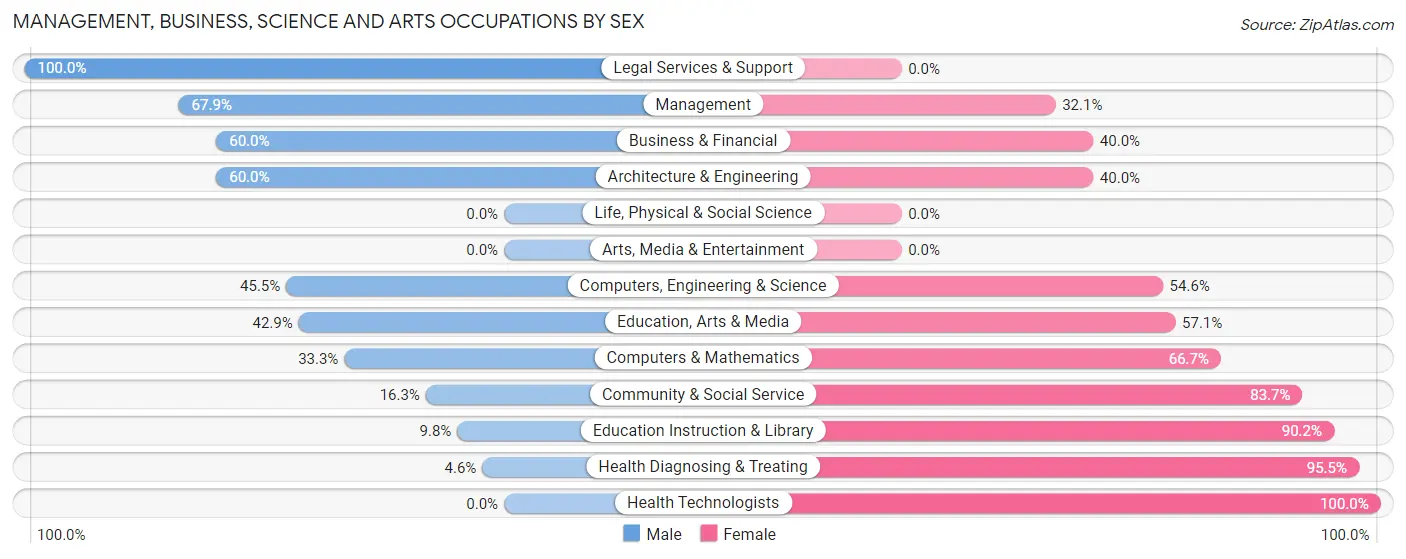
| Occupation | Male | Female |
| Management | 19 (67.9%) | 9 (32.1%) |
| Business & Financial | 9 (60.0%) | 6 (40.0%) |
| Computers, Engineering & Science | 5 (45.5%) | 6 (54.5%) |
| Computers & Mathematics | 2 (33.3%) | 4 (66.7%) |
| Architecture & Engineering | 3 (60.0%) | 2 (40.0%) |
| Life, Physical & Social Science | 0 (0.0%) | 0 (0.0%) |
| Community & Social Service | 8 (16.3%) | 41 (83.7%) |
| Education, Arts & Media | 3 (42.9%) | 4 (57.1%) |
| Legal Services & Support | 1 (100.0%) | 0 (0.0%) |
| Education Instruction & Library | 4 (9.8%) | 37 (90.2%) |
| Arts, Media & Entertainment | 0 (0.0%) | 0 (0.0%) |
| Health Diagnosing & Treating | 1 (4.5%) | 21 (95.5%) |
| Health Technologists | 0 (0.0%) | 8 (100.0%) |
| Total (Category) | 42 (33.6%) | 83 (66.4%) |
| Total (Overall) | 113 (37.4%) | 189 (62.6%) |
Services Occupations
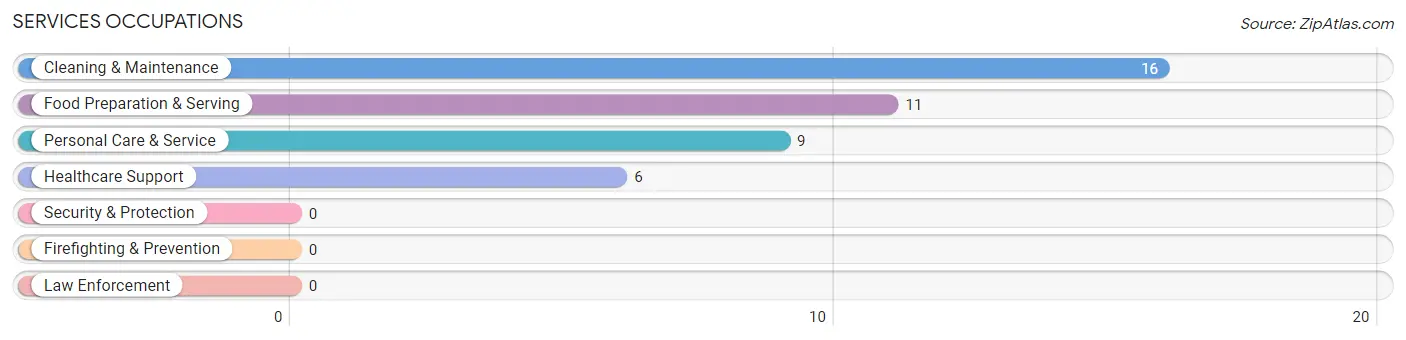
The most common Services occupations in Greensburg are Cleaning & Maintenance (16 | 5.3%), Food Preparation & Serving (11 | 3.6%), Personal Care & Service (9 | 3.0%), and Healthcare Support (6 | 2.0%).
Services Occupations by Sex
Within the Services occupations in Greensburg, the most male-oriented occupations are Personal Care & Service (22.2%), and Cleaning & Maintenance (18.8%), while the most female-oriented occupations are Healthcare Support (100.0%), Food Preparation & Serving (100.0%), and Cleaning & Maintenance (81.2%).
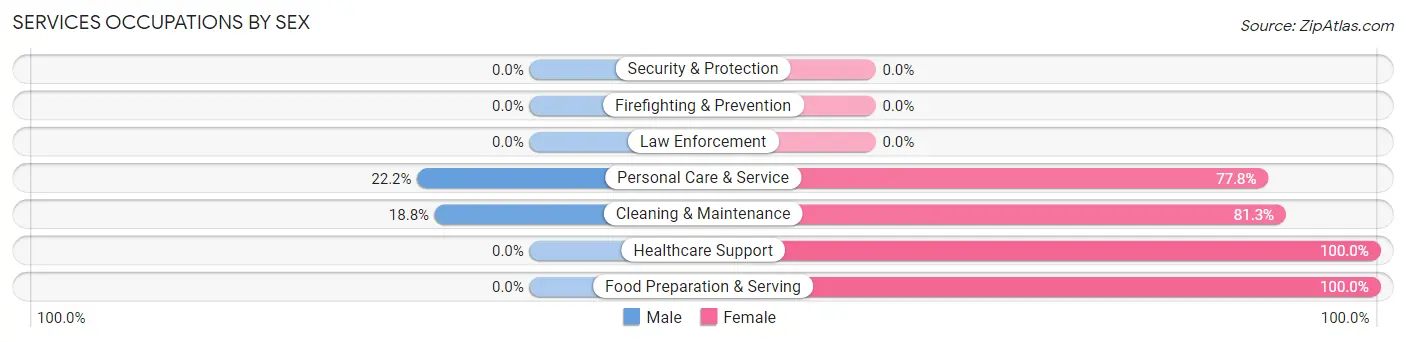
| Occupation | Male | Female |
| Healthcare Support | 0 (0.0%) | 6 (100.0%) |
| Security & Protection | 0 (0.0%) | 0 (0.0%) |
| Firefighting & Prevention | 0 (0.0%) | 0 (0.0%) |
| Law Enforcement | 0 (0.0%) | 0 (0.0%) |
| Food Preparation & Serving | 0 (0.0%) | 11 (100.0%) |
| Cleaning & Maintenance | 3 (18.8%) | 13 (81.2%) |
| Personal Care & Service | 2 (22.2%) | 7 (77.8%) |
| Total (Category) | 5 (11.9%) | 37 (88.1%) |
| Total (Overall) | 113 (37.4%) | 189 (62.6%) |
Sales and Office Occupations
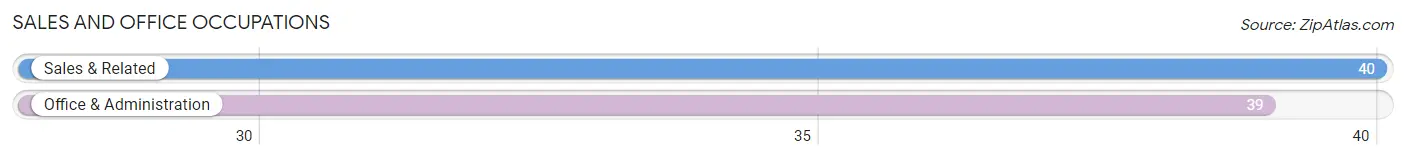
The most common Sales and Office occupations in Greensburg are Sales & Related (40 | 13.3%), and Office & Administration (39 | 12.9%).
Sales and Office Occupations by Sex
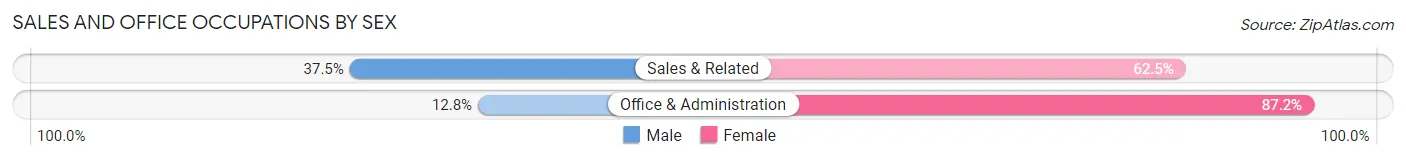
| Occupation | Male | Female |
| Sales & Related | 15 (37.5%) | 25 (62.5%) |
| Office & Administration | 5 (12.8%) | 34 (87.2%) |
| Total (Category) | 20 (25.3%) | 59 (74.7%) |
| Total (Overall) | 113 (37.4%) | 189 (62.6%) |
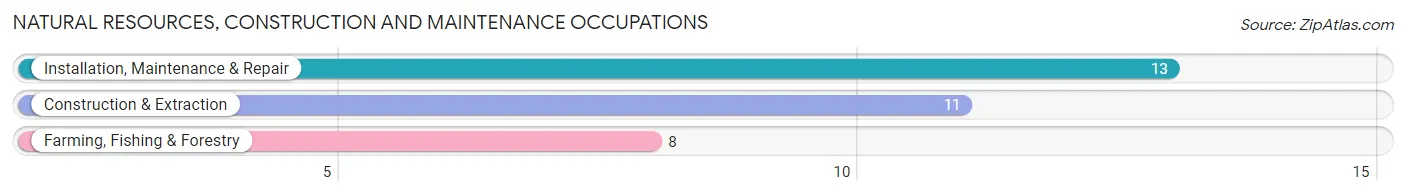
Natural Resources, Construction and Maintenance Occupations
The most common Natural Resources, Construction and Maintenance occupations in Greensburg are Installation, Maintenance & Repair (13 | 4.3%), Construction & Extraction (11 | 3.6%), and Farming, Fishing & Forestry (8 | 2.6%).
Natural Resources, Construction and Maintenance Occupations by Sex
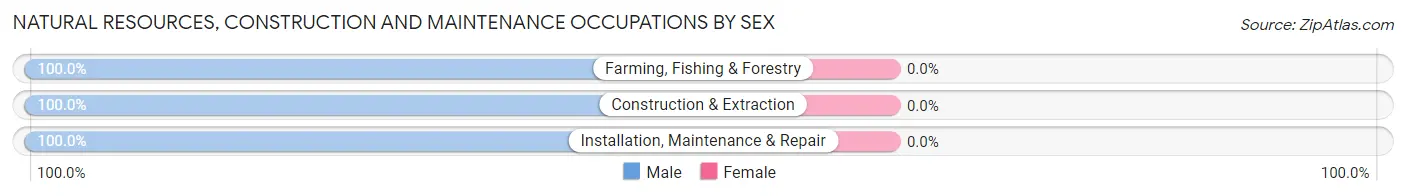
| Occupation | Male | Female |
| Farming, Fishing & Forestry | 8 (100.0%) | 0 (0.0%) |
| Construction & Extraction | 11 (100.0%) | 0 (0.0%) |
| Installation, Maintenance & Repair | 13 (100.0%) | 0 (0.0%) |
| Total (Category) | 32 (100.0%) | 0 (0.0%) |
| Total (Overall) | 113 (37.4%) | 189 (62.6%) |
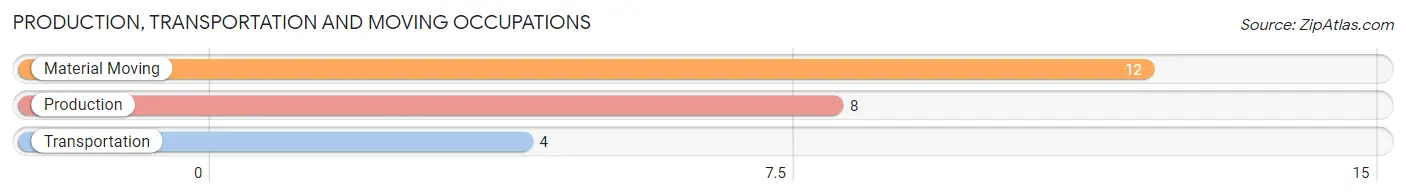
Production, Transportation and Moving Occupations
The most common Production, Transportation and Moving occupations in Greensburg are Material Moving (12 | 4.0%), Production (8 | 2.6%), and Transportation (4 | 1.3%).
Production, Transportation and Moving Occupations by Sex
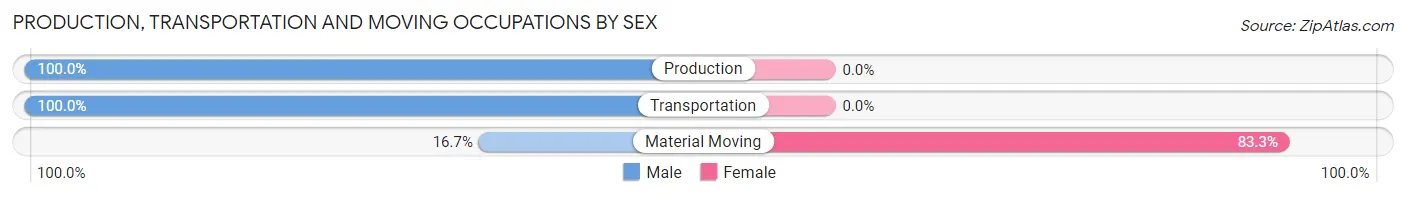
| Occupation | Male | Female |
| Production | 8 (100.0%) | 0 (0.0%) |
| Transportation | 4 (100.0%) | 0 (0.0%) |
| Material Moving | 2 (16.7%) | 10 (83.3%) |
| Total (Category) | 14 (58.3%) | 10 (41.7%) |
| Total (Overall) | 113 (37.4%) | 189 (62.6%) |
Employment Industries by Sex in Greensburg
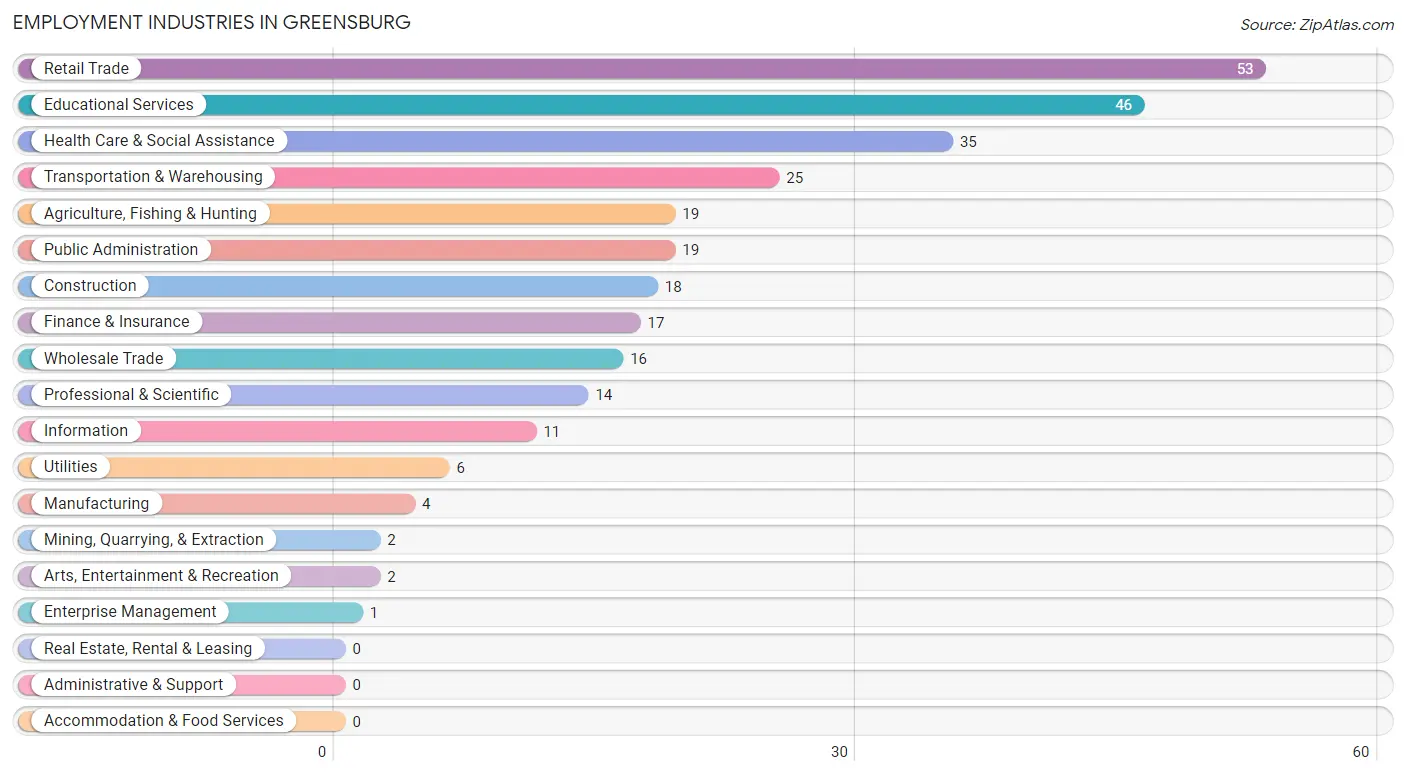
Employment Industries in Greensburg
The major employment industries in Greensburg include Retail Trade (53 | 17.5%), Educational Services (46 | 15.2%), Health Care & Social Assistance (35 | 11.6%), Transportation & Warehousing (25 | 8.3%), and Agriculture, Fishing & Hunting (19 | 6.3%).
Employment Industries by Sex in Greensburg
The Greensburg industries that see more men than women are Agriculture, Fishing & Hunting (100.0%), Mining, Quarrying, & Extraction (100.0%), and Manufacturing (100.0%), whereas the industries that tend to have a higher number of women are Finance & Insurance (100.0%), Professional & Scientific (100.0%), and Enterprise Management (100.0%).
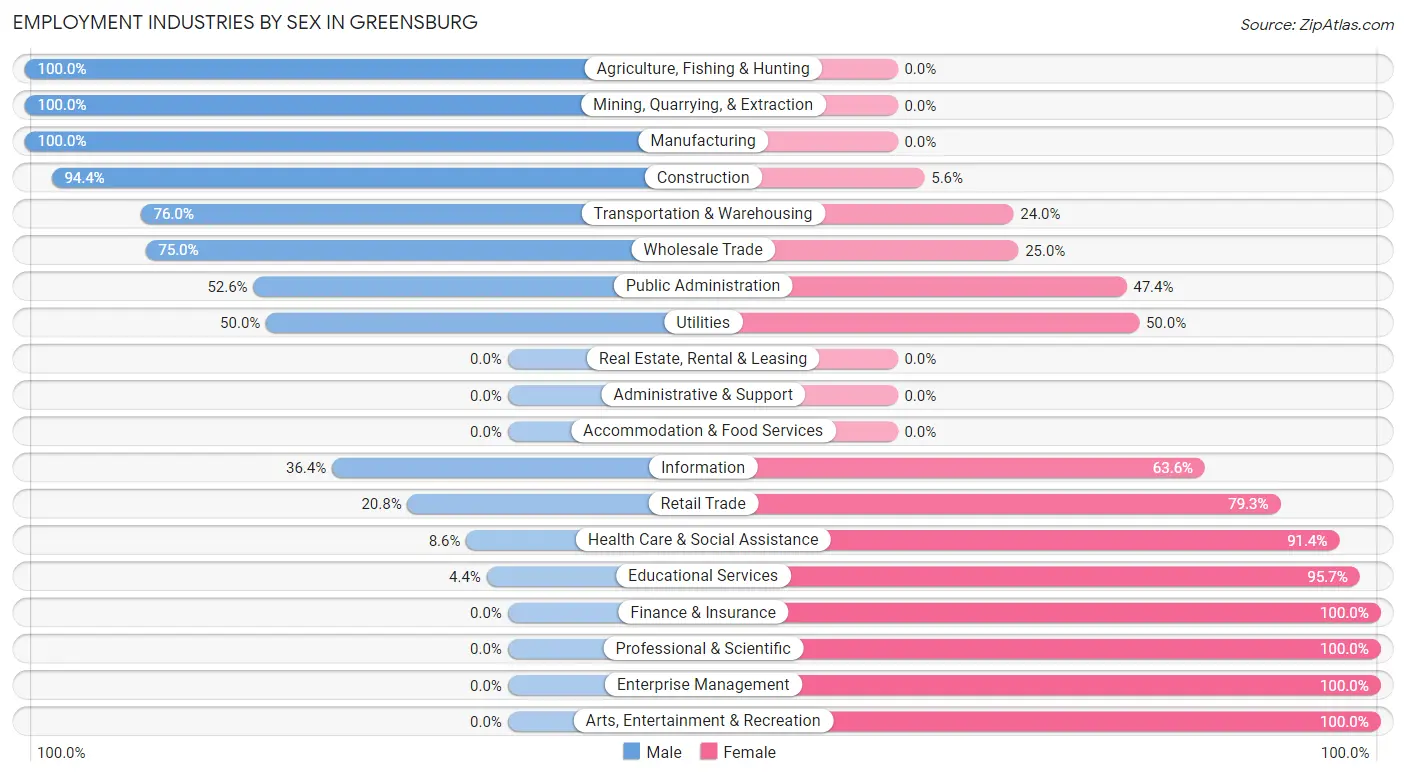
| Industry | Male | Female |
| Agriculture, Fishing & Hunting | 19 (100.0%) | 0 (0.0%) |
| Mining, Quarrying, & Extraction | 2 (100.0%) | 0 (0.0%) |
| Construction | 17 (94.4%) | 1 (5.6%) |
| Manufacturing | 4 (100.0%) | 0 (0.0%) |
| Wholesale Trade | 12 (75.0%) | 4 (25.0%) |
| Retail Trade | 11 (20.7%) | 42 (79.2%) |
| Transportation & Warehousing | 19 (76.0%) | 6 (24.0%) |
| Utilities | 3 (50.0%) | 3 (50.0%) |
| Information | 4 (36.4%) | 7 (63.6%) |
| Finance & Insurance | 0 (0.0%) | 17 (100.0%) |
| Real Estate, Rental & Leasing | 0 (0.0%) | 0 (0.0%) |
| Professional & Scientific | 0 (0.0%) | 14 (100.0%) |
| Enterprise Management | 0 (0.0%) | 1 (100.0%) |
| Administrative & Support | 0 (0.0%) | 0 (0.0%) |
| Educational Services | 2 (4.3%) | 44 (95.7%) |
| Health Care & Social Assistance | 3 (8.6%) | 32 (91.4%) |
| Arts, Entertainment & Recreation | 0 (0.0%) | 2 (100.0%) |
| Accommodation & Food Services | 0 (0.0%) | 0 (0.0%) |
| Public Administration | 10 (52.6%) | 9 (47.4%) |
| Total | 113 (37.4%) | 189 (62.6%) |
Education in Greensburg
School Enrollment in Greensburg
The most common levels of schooling among the 98 students in Greensburg are elementary school (44 | 44.9%), high school (22 | 22.5%), and middle school (18 | 18.4%).
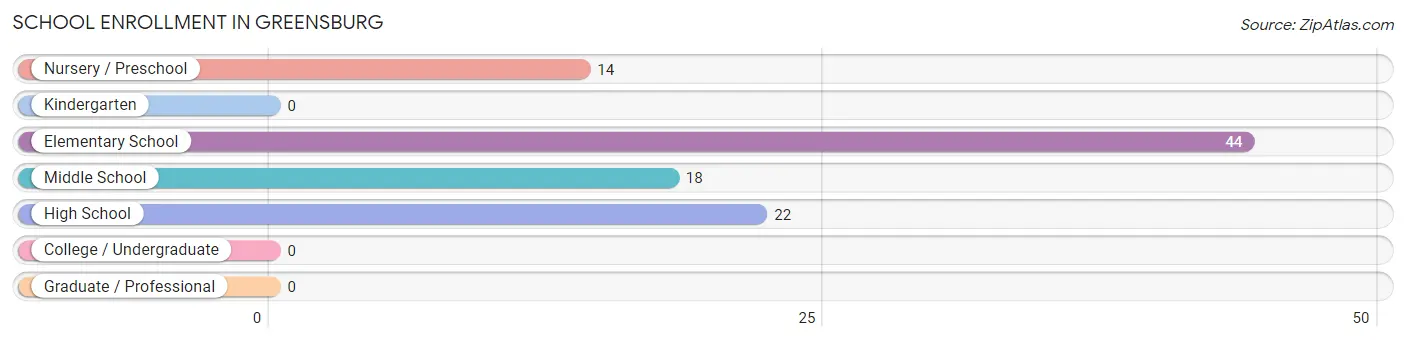
| School Level | # Students | % Students |
| Nursery / Preschool | 14 | 14.3% |
| Kindergarten | 0 | 0.0% |
| Elementary School | 44 | 44.9% |
| Middle School | 18 | 18.4% |
| High School | 22 | 22.5% |
| College / Undergraduate | 0 | 0.0% |
| Graduate / Professional | 0 | 0.0% |
| Total | 98 | 100.0% |
School Enrollment by Age by Funding Source in Greensburg
Out of a total of 98 students who are enrolled in schools in Greensburg, 1 (1.0%) attend a private institution, while the remaining 97 (99.0%) are enrolled in public schools. The age group of 10 to 14 year olds has the highest likelihood of being enrolled in private schools, with 1 (3.7% in the age bracket) enrolled. Conversely, the age group of 3 to 4 year olds has the lowest likelihood of being enrolled in a private school, with 14 (100.0% in the age bracket) attending a public institution.
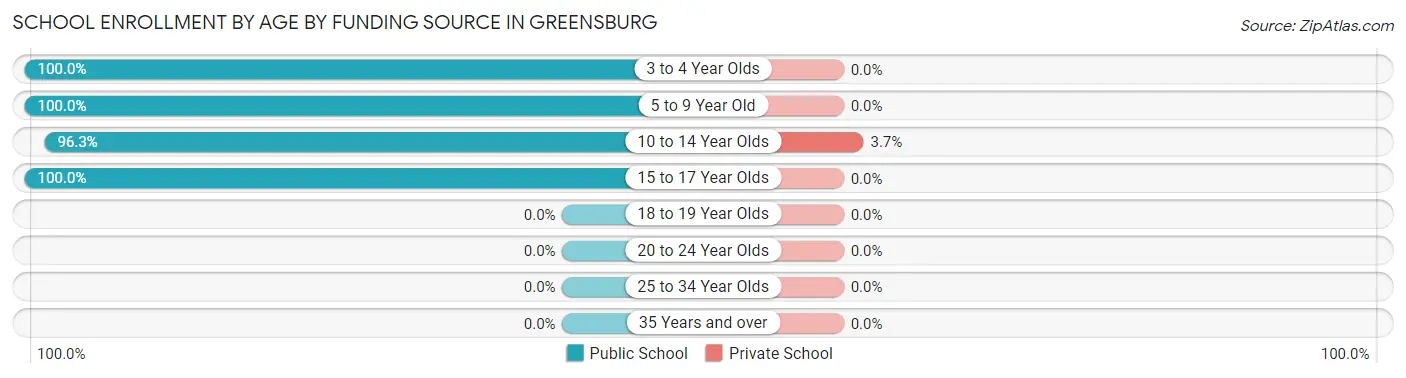
| Age Bracket | Public School | Private School |
| 3 to 4 Year Olds | 14 (100.0%) | 0 (0.0%) |
| 5 to 9 Year Old | 38 (100.0%) | 0 (0.0%) |
| 10 to 14 Year Olds | 26 (96.3%) | 1 (3.7%) |
| 15 to 17 Year Olds | 19 (100.0%) | 0 (0.0%) |
| 18 to 19 Year Olds | 0 (0.0%) | 0 (0.0%) |
| 20 to 24 Year Olds | 0 (0.0%) | 0 (0.0%) |
| 25 to 34 Year Olds | 0 (0.0%) | 0 (0.0%) |
| 35 Years and over | 0 (0.0%) | 0 (0.0%) |
| Total | 97 (99.0%) | 1 (1.0%) |
Educational Attainment by Field of Study in Greensburg
Education (46 | 30.9%), bio, nature & agricultural (28 | 18.8%), business (18 | 12.1%), liberal arts & history (18 | 12.1%), and science & technology (13 | 8.7%) are the most common fields of study among 149 individuals in Greensburg who have obtained a bachelor's degree or higher.
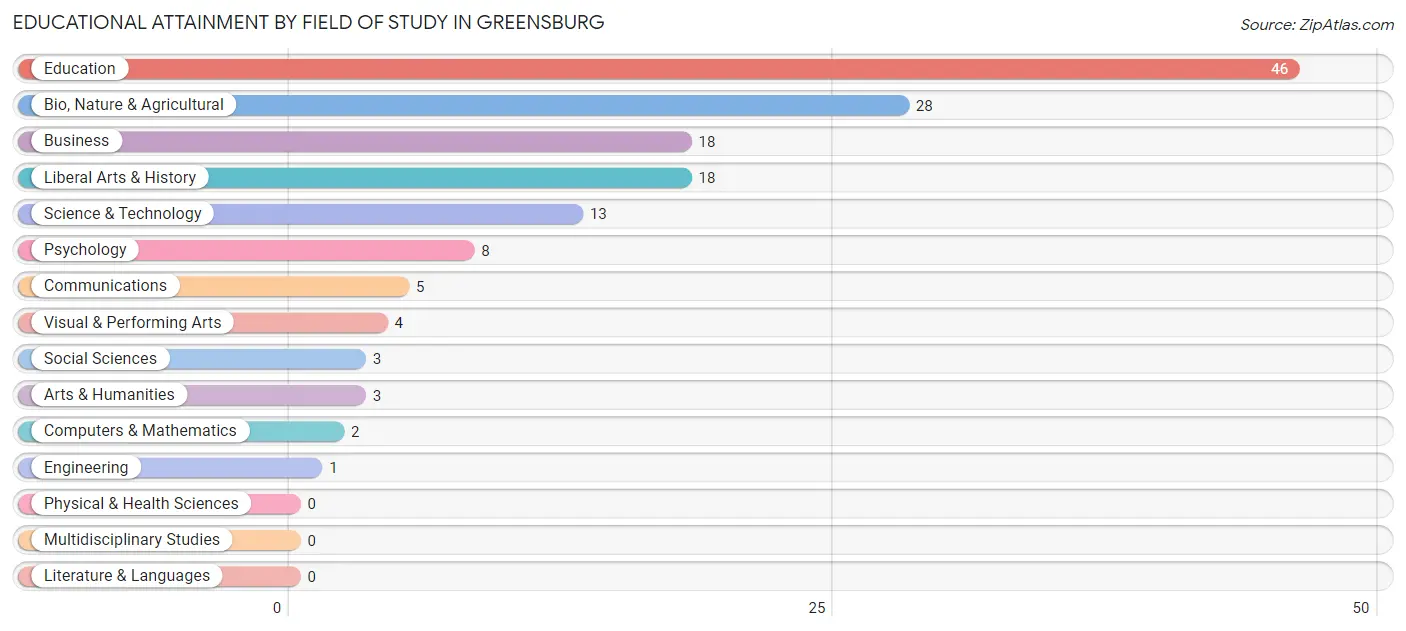
| Field of Study | # Graduates | % Graduates |
| Computers & Mathematics | 2 | 1.3% |
| Bio, Nature & Agricultural | 28 | 18.8% |
| Physical & Health Sciences | 0 | 0.0% |
| Psychology | 8 | 5.4% |
| Social Sciences | 3 | 2.0% |
| Engineering | 1 | 0.7% |
| Multidisciplinary Studies | 0 | 0.0% |
| Science & Technology | 13 | 8.7% |
| Business | 18 | 12.1% |
| Education | 46 | 30.9% |
| Literature & Languages | 0 | 0.0% |
| Liberal Arts & History | 18 | 12.1% |
| Visual & Performing Arts | 4 | 2.7% |
| Communications | 5 | 3.4% |
| Arts & Humanities | 3 | 2.0% |
| Total | 149 | 100.0% |
Transportation & Commute in Greensburg
Vehicle Availability by Sex in Greensburg
The most prevalent vehicle ownership categories in Greensburg are males with 2 vehicles (43, accounting for 39.8%) and females with 2 vehicles (40, making up 23.5%).
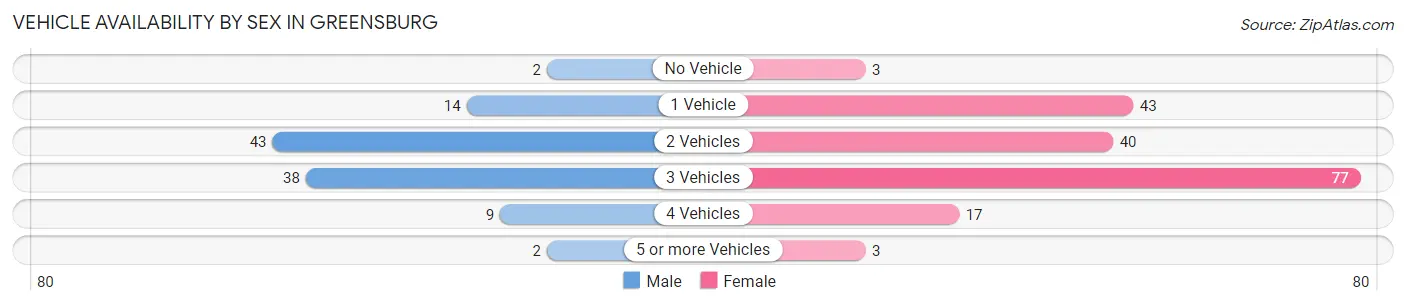
| Vehicles Available | Male | Female |
| No Vehicle | 2 (1.8%) | 3 (1.6%) |
| 1 Vehicle | 14 (13.0%) | 43 (23.5%) |
| 2 Vehicles | 43 (39.8%) | 40 (21.9%) |
| 3 Vehicles | 38 (35.2%) | 77 (42.1%) |
| 4 Vehicles | 9 (8.3%) | 17 (9.3%) |
| 5 or more Vehicles | 2 (1.8%) | 3 (1.6%) |
| Total | 108 (100.0%) | 183 (100.0%) |
Commute Time in Greensburg
The most frequently occuring commute durations in Greensburg are less than 5 minutes (100 commuters, 36.1%), 5 to 9 minutes (83 commuters, 30.0%), and 10 to 14 minutes (28 commuters, 10.1%).
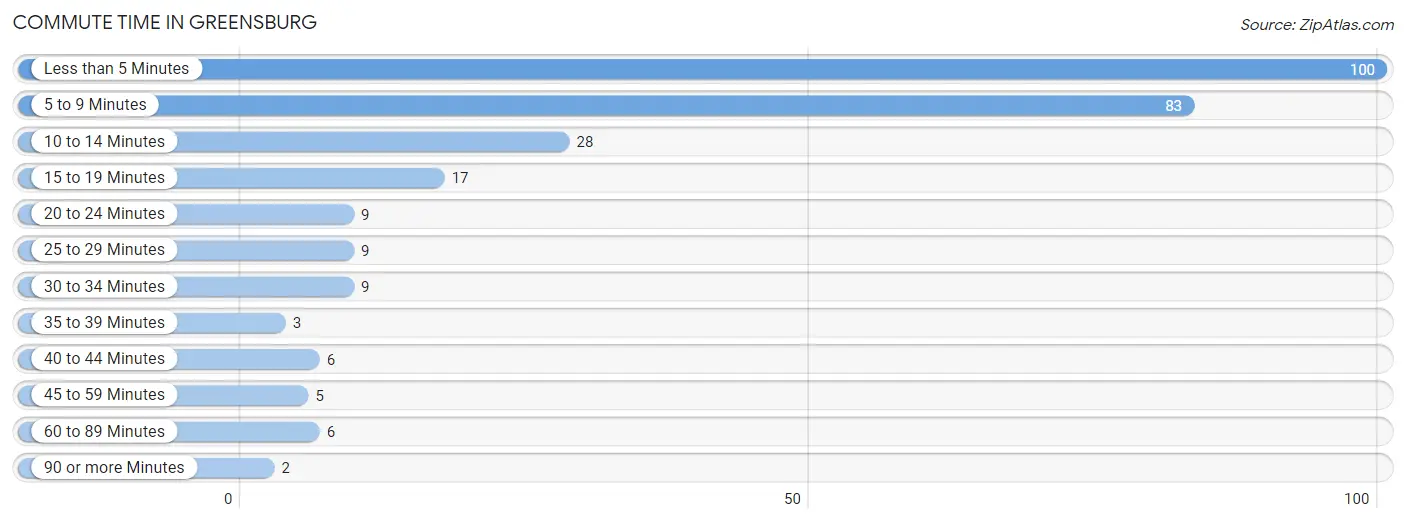
| Commute Time | # Commuters | % Commuters |
| Less than 5 Minutes | 100 | 36.1% |
| 5 to 9 Minutes | 83 | 30.0% |
| 10 to 14 Minutes | 28 | 10.1% |
| 15 to 19 Minutes | 17 | 6.1% |
| 20 to 24 Minutes | 9 | 3.3% |
| 25 to 29 Minutes | 9 | 3.3% |
| 30 to 34 Minutes | 9 | 3.3% |
| 35 to 39 Minutes | 3 | 1.1% |
| 40 to 44 Minutes | 6 | 2.2% |
| 45 to 59 Minutes | 5 | 1.8% |
| 60 to 89 Minutes | 6 | 2.2% |
| 90 or more Minutes | 2 | 0.7% |
Commute Time by Sex in Greensburg
The most common commute times in Greensburg are 5 to 9 minutes (25 commuters, 24.3%) for males and less than 5 minutes (77 commuters, 44.3%) for females.
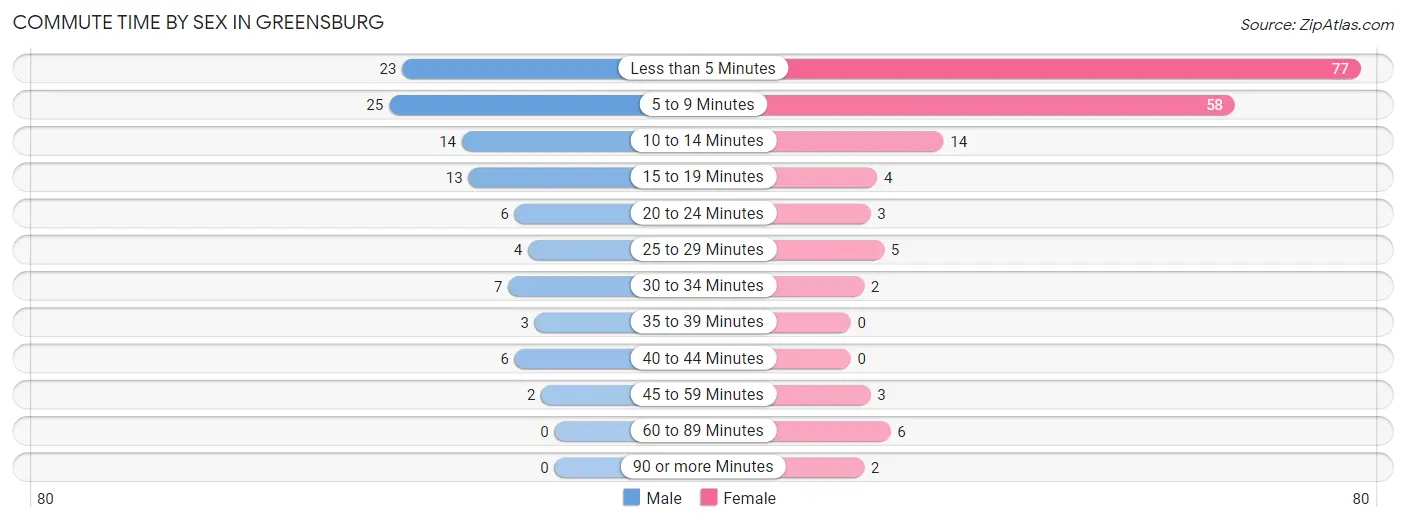
| Commute Time | Male | Female |
| Less than 5 Minutes | 23 (22.3%) | 77 (44.3%) |
| 5 to 9 Minutes | 25 (24.3%) | 58 (33.3%) |
| 10 to 14 Minutes | 14 (13.6%) | 14 (8.1%) |
| 15 to 19 Minutes | 13 (12.6%) | 4 (2.3%) |
| 20 to 24 Minutes | 6 (5.8%) | 3 (1.7%) |
| 25 to 29 Minutes | 4 (3.9%) | 5 (2.9%) |
| 30 to 34 Minutes | 7 (6.8%) | 2 (1.1%) |
| 35 to 39 Minutes | 3 (2.9%) | 0 (0.0%) |
| 40 to 44 Minutes | 6 (5.8%) | 0 (0.0%) |
| 45 to 59 Minutes | 2 (1.9%) | 3 (1.7%) |
| 60 to 89 Minutes | 0 (0.0%) | 6 (3.5%) |
| 90 or more Minutes | 0 (0.0%) | 2 (1.1%) |
Time of Departure to Work by Sex in Greensburg
The most frequent times of departure to work in Greensburg are 7:00 AM to 7:29 AM (32, 31.1%) for males and 7:30 AM to 7:59 AM (48, 27.6%) for females.
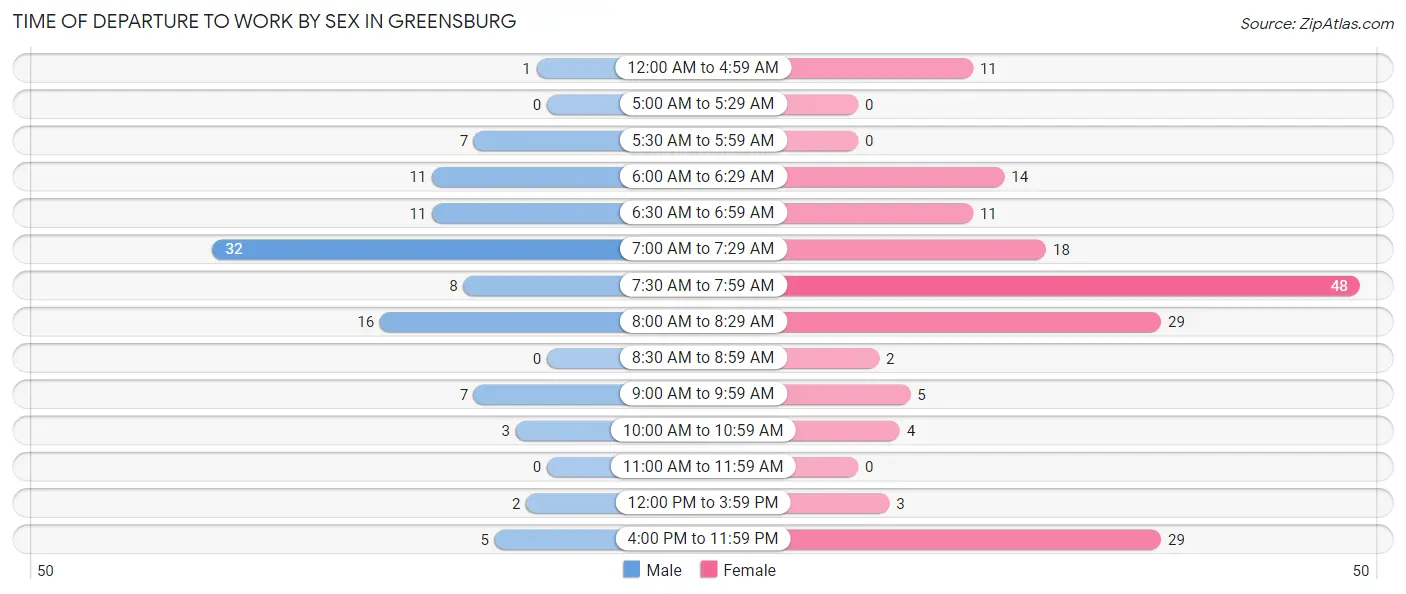
| Time of Departure | Male | Female |
| 12:00 AM to 4:59 AM | 1 (1.0%) | 11 (6.3%) |
| 5:00 AM to 5:29 AM | 0 (0.0%) | 0 (0.0%) |
| 5:30 AM to 5:59 AM | 7 (6.8%) | 0 (0.0%) |
| 6:00 AM to 6:29 AM | 11 (10.7%) | 14 (8.1%) |
| 6:30 AM to 6:59 AM | 11 (10.7%) | 11 (6.3%) |
| 7:00 AM to 7:29 AM | 32 (31.1%) | 18 (10.3%) |
| 7:30 AM to 7:59 AM | 8 (7.8%) | 48 (27.6%) |
| 8:00 AM to 8:29 AM | 16 (15.5%) | 29 (16.7%) |
| 8:30 AM to 8:59 AM | 0 (0.0%) | 2 (1.1%) |
| 9:00 AM to 9:59 AM | 7 (6.8%) | 5 (2.9%) |
| 10:00 AM to 10:59 AM | 3 (2.9%) | 4 (2.3%) |
| 11:00 AM to 11:59 AM | 0 (0.0%) | 0 (0.0%) |
| 12:00 PM to 3:59 PM | 2 (1.9%) | 3 (1.7%) |
| 4:00 PM to 11:59 PM | 5 (4.9%) | 29 (16.7%) |
| Total | 103 (100.0%) | 174 (100.0%) |
Housing Occupancy in Greensburg
Occupancy by Ownership in Greensburg
Of the total 285 dwellings in Greensburg, owner-occupied units account for 175 (61.4%), while renter-occupied units make up 110 (38.6%).
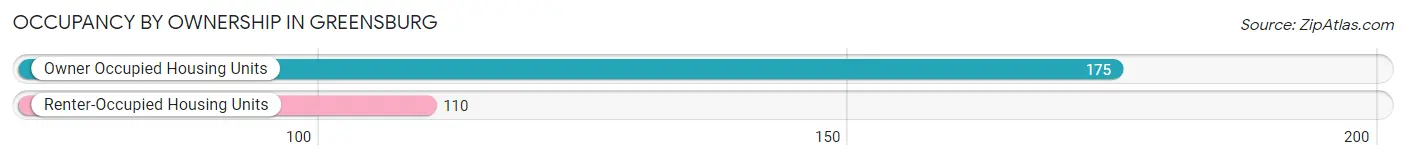
| Occupancy | # Housing Units | % Housing Units |
| Owner Occupied Housing Units | 175 | 61.4% |
| Renter-Occupied Housing Units | 110 | 38.6% |
| Total Occupied Housing Units | 285 | 100.0% |
Occupancy by Household Size in Greensburg
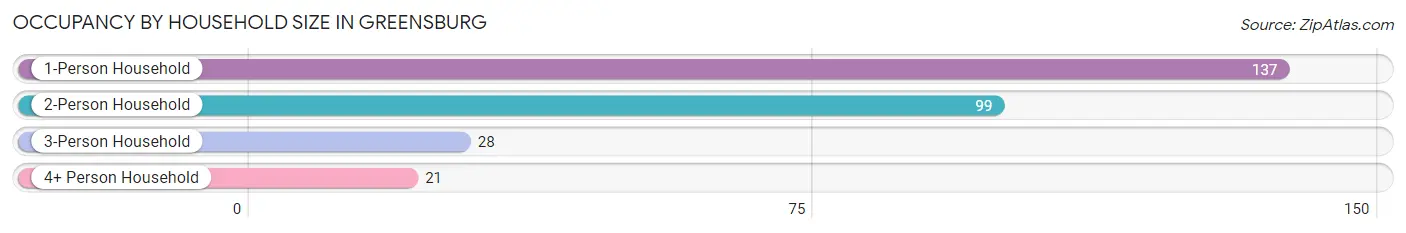
| Household Size | # Housing Units | % Housing Units |
| 1-Person Household | 137 | 48.1% |
| 2-Person Household | 99 | 34.7% |
| 3-Person Household | 28 | 9.8% |
| 4+ Person Household | 21 | 7.4% |
| Total Housing Units | 285 | 100.0% |
Occupancy by Ownership by Household Size in Greensburg
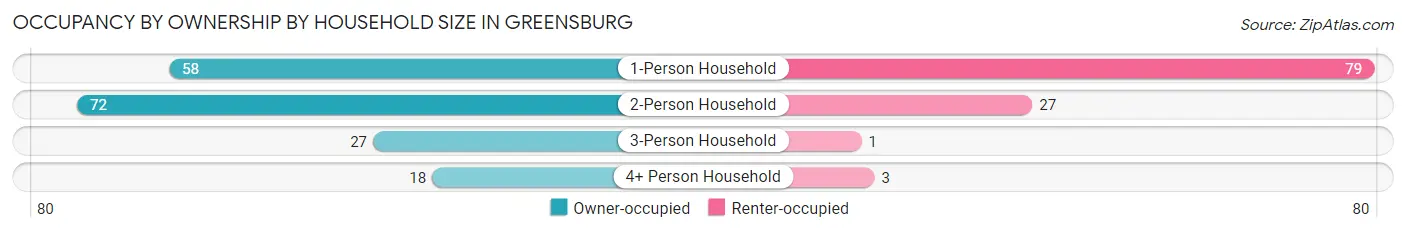
| Household Size | Owner-occupied | Renter-occupied |
| 1-Person Household | 58 (42.3%) | 79 (57.7%) |
| 2-Person Household | 72 (72.7%) | 27 (27.3%) |
| 3-Person Household | 27 (96.4%) | 1 (3.6%) |
| 4+ Person Household | 18 (85.7%) | 3 (14.3%) |
| Total Housing Units | 175 (61.4%) | 110 (38.6%) |
Occupancy by Educational Attainment in Greensburg
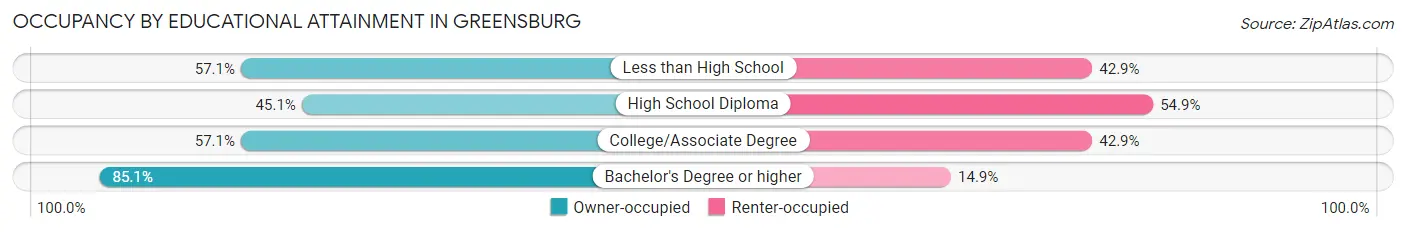
| Household Size | Owner-occupied | Renter-occupied |
| Less than High School | 16 (57.1%) | 12 (42.9%) |
| High School Diploma | 32 (45.1%) | 39 (54.9%) |
| College/Associate Degree | 64 (57.1%) | 48 (42.9%) |
| Bachelor's Degree or higher | 63 (85.1%) | 11 (14.9%) |
Occupancy by Age of Householder in Greensburg
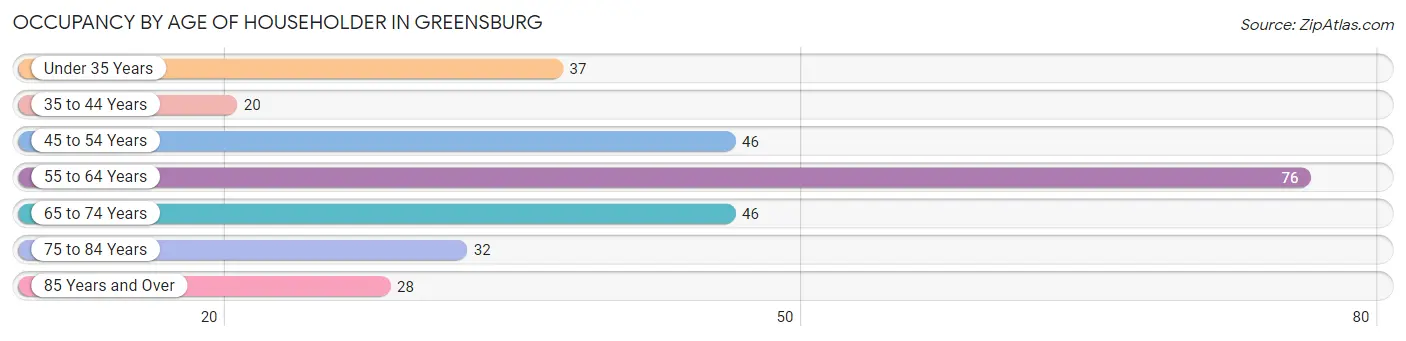
| Age Bracket | # Households | % Households |
| Under 35 Years | 37 | 13.0% |
| 35 to 44 Years | 20 | 7.0% |
| 45 to 54 Years | 46 | 16.1% |
| 55 to 64 Years | 76 | 26.7% |
| 65 to 74 Years | 46 | 16.1% |
| 75 to 84 Years | 32 | 11.2% |
| 85 Years and Over | 28 | 9.8% |
| Total | 285 | 100.0% |
Housing Finances in Greensburg
Median Income by Occupancy in Greensburg
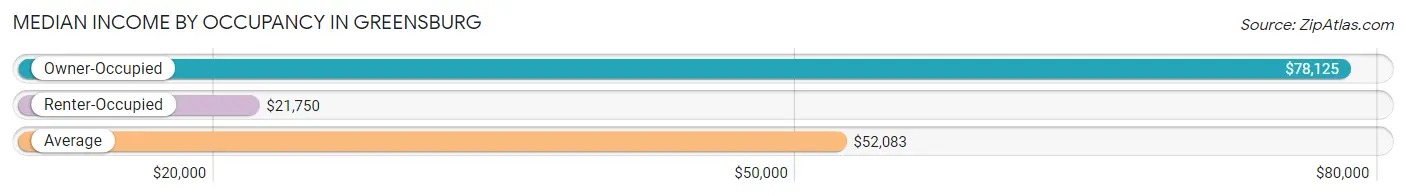
| Occupancy Type | # Households | Median Income |
| Owner-Occupied | 175 (61.4%) | $78,125 |
| Renter-Occupied | 110 (38.6%) | $21,750 |
| Average | 285 (100.0%) | $52,083 |
Occupancy by Householder Income Bracket in Greensburg
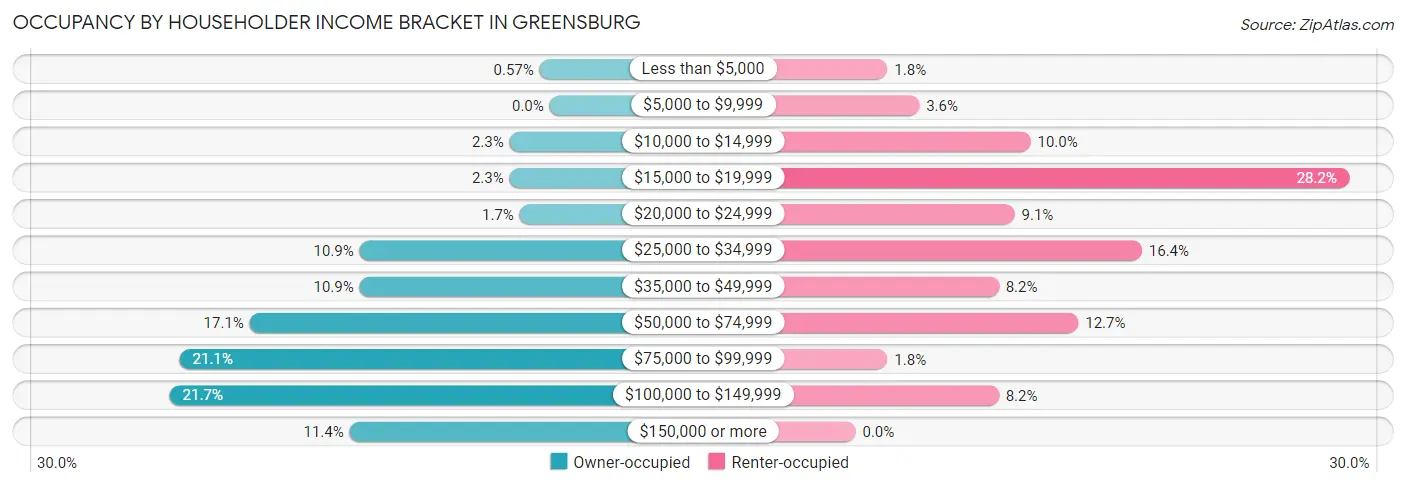
| Income Bracket | Owner-occupied | Renter-occupied |
| Less than $5,000 | 1 (0.6%) | 2 (1.8%) |
| $5,000 to $9,999 | 0 (0.0%) | 4 (3.6%) |
| $10,000 to $14,999 | 4 (2.3%) | 11 (10.0%) |
| $15,000 to $19,999 | 4 (2.3%) | 31 (28.2%) |
| $20,000 to $24,999 | 3 (1.7%) | 10 (9.1%) |
| $25,000 to $34,999 | 19 (10.9%) | 18 (16.4%) |
| $35,000 to $49,999 | 19 (10.9%) | 9 (8.2%) |
| $50,000 to $74,999 | 30 (17.1%) | 14 (12.7%) |
| $75,000 to $99,999 | 37 (21.1%) | 2 (1.8%) |
| $100,000 to $149,999 | 38 (21.7%) | 9 (8.2%) |
| $150,000 or more | 20 (11.4%) | 0 (0.0%) |
| Total | 175 (100.0%) | 110 (100.0%) |
Monthly Housing Cost Tiers in Greensburg
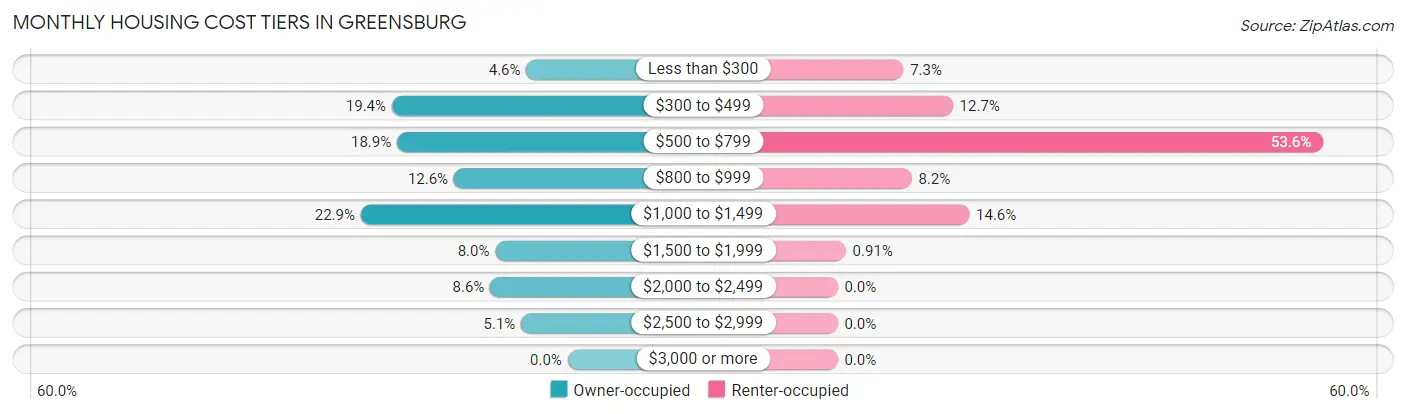
| Monthly Cost | Owner-occupied | Renter-occupied |
| Less than $300 | 8 (4.6%) | 8 (7.3%) |
| $300 to $499 | 34 (19.4%) | 14 (12.7%) |
| $500 to $799 | 33 (18.9%) | 59 (53.6%) |
| $800 to $999 | 22 (12.6%) | 9 (8.2%) |
| $1,000 to $1,499 | 40 (22.9%) | 16 (14.5%) |
| $1,500 to $1,999 | 14 (8.0%) | 1 (0.9%) |
| $2,000 to $2,499 | 15 (8.6%) | 0 (0.0%) |
| $2,500 to $2,999 | 9 (5.1%) | 0 (0.0%) |
| $3,000 or more | 0 (0.0%) | 0 (0.0%) |
| Total | 175 (100.0%) | 110 (100.0%) |
Physical Housing Characteristics in Greensburg
Housing Structures in Greensburg
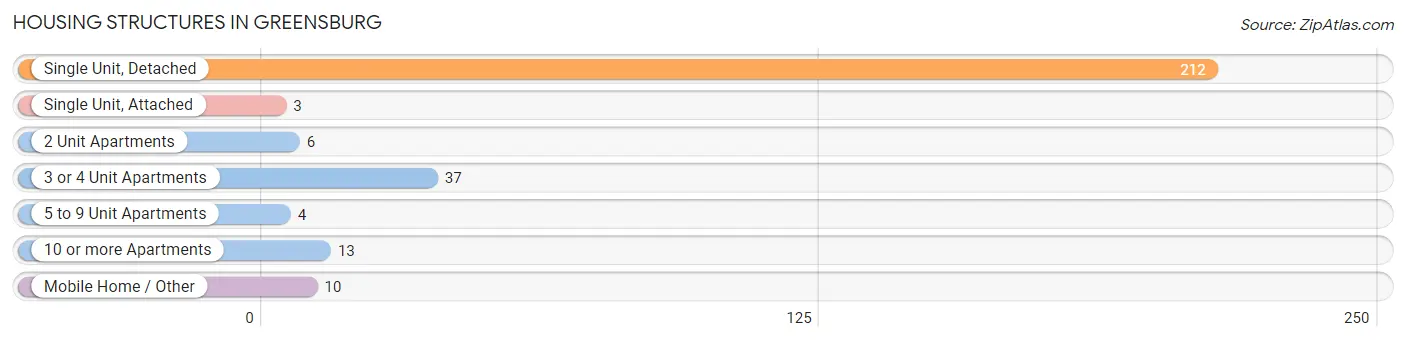
| Structure Type | # Housing Units | % Housing Units |
| Single Unit, Detached | 212 | 74.4% |
| Single Unit, Attached | 3 | 1.1% |
| 2 Unit Apartments | 6 | 2.1% |
| 3 or 4 Unit Apartments | 37 | 13.0% |
| 5 to 9 Unit Apartments | 4 | 1.4% |
| 10 or more Apartments | 13 | 4.6% |
| Mobile Home / Other | 10 | 3.5% |
| Total | 285 | 100.0% |
Housing Structures by Occupancy in Greensburg
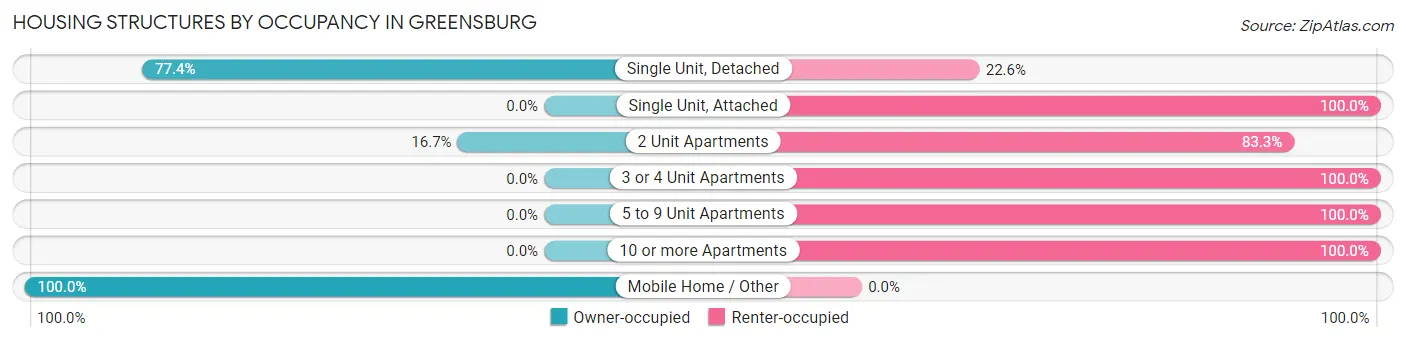
| Structure Type | Owner-occupied | Renter-occupied |
| Single Unit, Detached | 164 (77.4%) | 48 (22.6%) |
| Single Unit, Attached | 0 (0.0%) | 3 (100.0%) |
| 2 Unit Apartments | 1 (16.7%) | 5 (83.3%) |
| 3 or 4 Unit Apartments | 0 (0.0%) | 37 (100.0%) |
| 5 to 9 Unit Apartments | 0 (0.0%) | 4 (100.0%) |
| 10 or more Apartments | 0 (0.0%) | 13 (100.0%) |
| Mobile Home / Other | 10 (100.0%) | 0 (0.0%) |
| Total | 175 (61.4%) | 110 (38.6%) |
Housing Structures by Number of Rooms in Greensburg
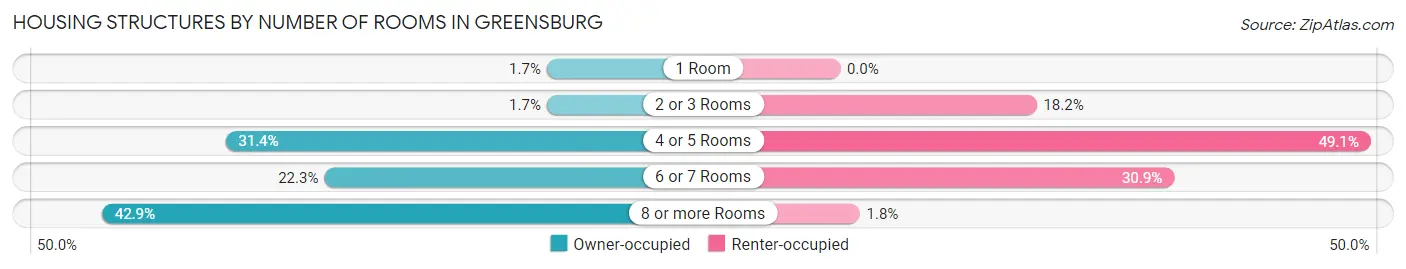
| Number of Rooms | Owner-occupied | Renter-occupied |
| 1 Room | 3 (1.7%) | 0 (0.0%) |
| 2 or 3 Rooms | 3 (1.7%) | 20 (18.2%) |
| 4 or 5 Rooms | 55 (31.4%) | 54 (49.1%) |
| 6 or 7 Rooms | 39 (22.3%) | 34 (30.9%) |
| 8 or more Rooms | 75 (42.9%) | 2 (1.8%) |
| Total | 175 (100.0%) | 110 (100.0%) |
Housing Structure by Heating Type in Greensburg
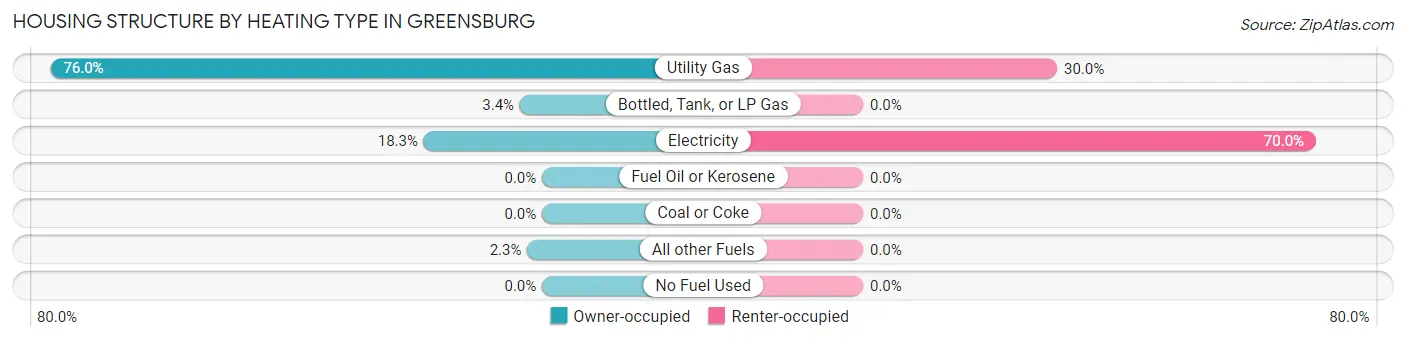
| Heating Type | Owner-occupied | Renter-occupied |
| Utility Gas | 133 (76.0%) | 33 (30.0%) |
| Bottled, Tank, or LP Gas | 6 (3.4%) | 0 (0.0%) |
| Electricity | 32 (18.3%) | 77 (70.0%) |
| Fuel Oil or Kerosene | 0 (0.0%) | 0 (0.0%) |
| Coal or Coke | 0 (0.0%) | 0 (0.0%) |
| All other Fuels | 4 (2.3%) | 0 (0.0%) |
| No Fuel Used | 0 (0.0%) | 0 (0.0%) |
| Total | 175 (100.0%) | 110 (100.0%) |
Household Vehicle Usage in Greensburg
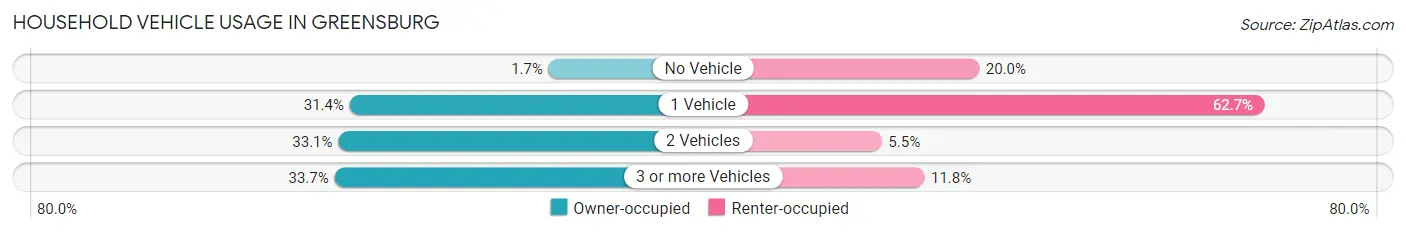
| Vehicles per Household | Owner-occupied | Renter-occupied |
| No Vehicle | 3 (1.7%) | 22 (20.0%) |
| 1 Vehicle | 55 (31.4%) | 69 (62.7%) |
| 2 Vehicles | 58 (33.1%) | 6 (5.4%) |
| 3 or more Vehicles | 59 (33.7%) | 13 (11.8%) |
| Total | 175 (100.0%) | 110 (100.0%) |
Real Estate & Mortgages in Greensburg
Real Estate and Mortgage Overview in Greensburg
| Characteristic | Without Mortgage | With Mortgage |
| Housing Units | 92 | 83 |
| Median Property Value | $132,500 | $205,700 |
| Median Household Income | $63,750 | $14 |
| Monthly Housing Costs | $600 | $0 |
| Real Estate Taxes | $2,313 | $0 |
Property Value by Mortgage Status in Greensburg
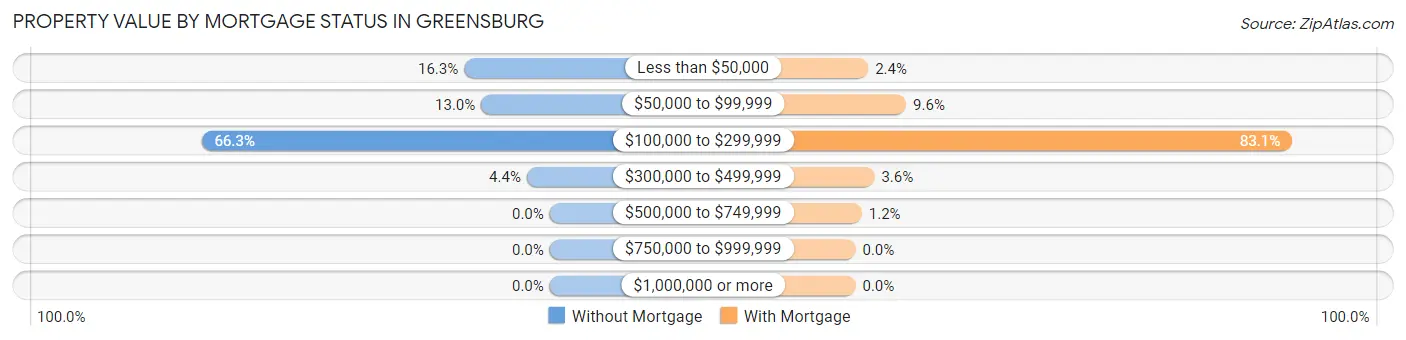
| Property Value | Without Mortgage | With Mortgage |
| Less than $50,000 | 15 (16.3%) | 2 (2.4%) |
| $50,000 to $99,999 | 12 (13.0%) | 8 (9.6%) |
| $100,000 to $299,999 | 61 (66.3%) | 69 (83.1%) |
| $300,000 to $499,999 | 4 (4.3%) | 3 (3.6%) |
| $500,000 to $749,999 | 0 (0.0%) | 1 (1.2%) |
| $750,000 to $999,999 | 0 (0.0%) | 0 (0.0%) |
| $1,000,000 or more | 0 (0.0%) | 0 (0.0%) |
| Total | 92 (100.0%) | 83 (100.0%) |
Household Income by Mortgage Status in Greensburg
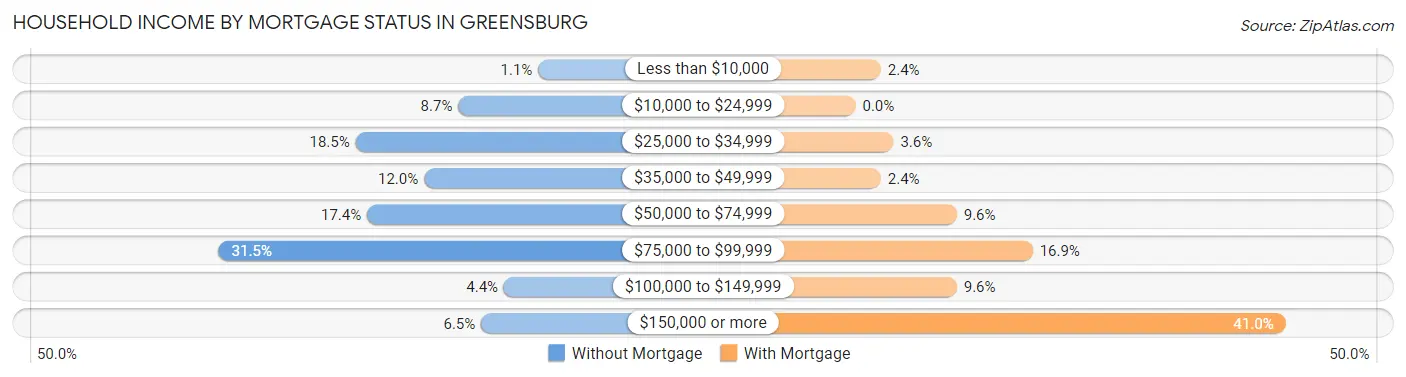
| Household Income | Without Mortgage | With Mortgage |
| Less than $10,000 | 1 (1.1%) | 2 (2.4%) |
| $10,000 to $24,999 | 8 (8.7%) | 0 (0.0%) |
| $25,000 to $34,999 | 17 (18.5%) | 3 (3.6%) |
| $35,000 to $49,999 | 11 (12.0%) | 2 (2.4%) |
| $50,000 to $74,999 | 16 (17.4%) | 8 (9.6%) |
| $75,000 to $99,999 | 29 (31.5%) | 14 (16.9%) |
| $100,000 to $149,999 | 4 (4.3%) | 8 (9.6%) |
| $150,000 or more | 6 (6.5%) | 34 (41.0%) |
| Total | 92 (100.0%) | 83 (100.0%) |
Property Value to Household Income Ratio in Greensburg
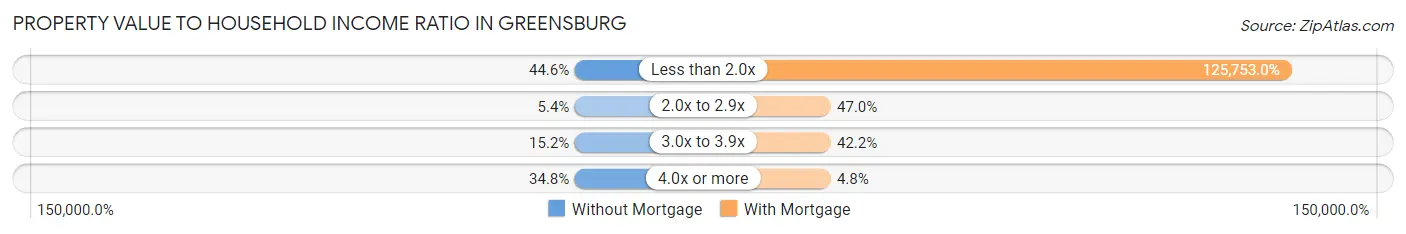
| Value-to-Income Ratio | Without Mortgage | With Mortgage |
| Less than 2.0x | 41 (44.6%) | 104,375 (125,753.0%) |
| 2.0x to 2.9x | 5 (5.4%) | 39 (47.0%) |
| 3.0x to 3.9x | 14 (15.2%) | 35 (42.2%) |
| 4.0x or more | 32 (34.8%) | 4 (4.8%) |
| Total | 92 (100.0%) | 83 (100.0%) |
Real Estate Taxes by Mortgage Status in Greensburg
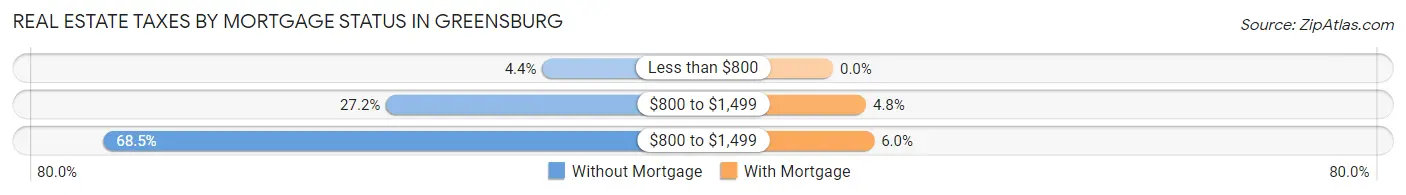
| Property Taxes | Without Mortgage | With Mortgage |
| Less than $800 | 4 (4.3%) | 0 (0.0%) |
| $800 to $1,499 | 25 (27.2%) | 4 (4.8%) |
| $800 to $1,499 | 63 (68.5%) | 5 (6.0%) |
| Total | 92 (100.0%) | 83 (100.0%) |
Health & Disability in Greensburg
Health Insurance Coverage by Age in Greensburg
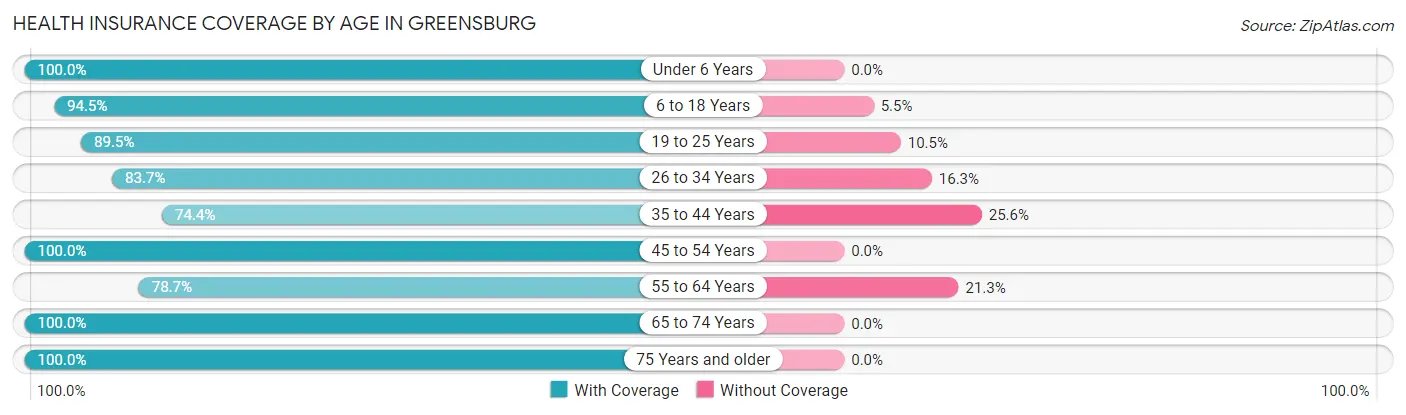
| Age Bracket | With Coverage | Without Coverage |
| Under 6 Years | 50 (100.0%) | 0 (0.0%) |
| 6 to 18 Years | 86 (94.5%) | 5 (5.5%) |
| 19 to 25 Years | 17 (89.5%) | 2 (10.5%) |
| 26 to 34 Years | 41 (83.7%) | 8 (16.3%) |
| 35 to 44 Years | 29 (74.4%) | 10 (25.6%) |
| 45 to 54 Years | 88 (100.0%) | 0 (0.0%) |
| 55 to 64 Years | 85 (78.7%) | 23 (21.3%) |
| 65 to 74 Years | 92 (100.0%) | 0 (0.0%) |
| 75 Years and older | 73 (100.0%) | 0 (0.0%) |
| Total | 561 (92.1%) | 48 (7.9%) |
Health Insurance Coverage by Citizenship Status in Greensburg
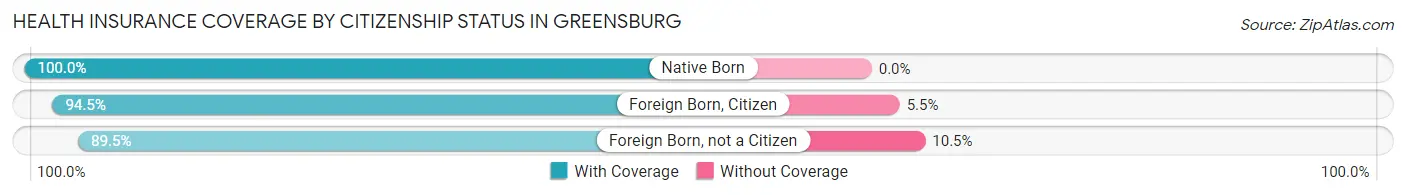
| Citizenship Status | With Coverage | Without Coverage |
| Native Born | 50 (100.0%) | 0 (0.0%) |
| Foreign Born, Citizen | 86 (94.5%) | 5 (5.5%) |
| Foreign Born, not a Citizen | 17 (89.5%) | 2 (10.5%) |
Health Insurance Coverage by Household Income in Greensburg
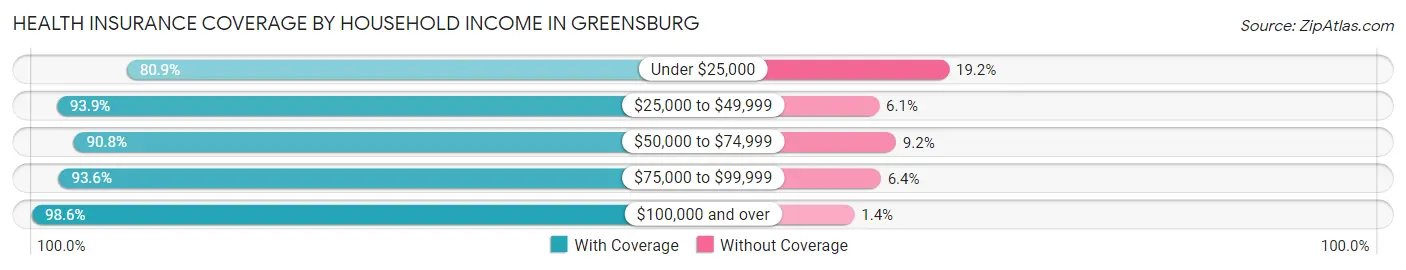
| Household Income | With Coverage | Without Coverage |
| Under $25,000 | 76 (80.8%) | 18 (19.2%) |
| $25,000 to $49,999 | 93 (93.9%) | 6 (6.1%) |
| $50,000 to $74,999 | 79 (90.8%) | 8 (9.2%) |
| $75,000 to $99,999 | 103 (93.6%) | 7 (6.4%) |
| $100,000 and over | 209 (98.6%) | 3 (1.4%) |
Public vs Private Health Insurance Coverage by Age in Greensburg
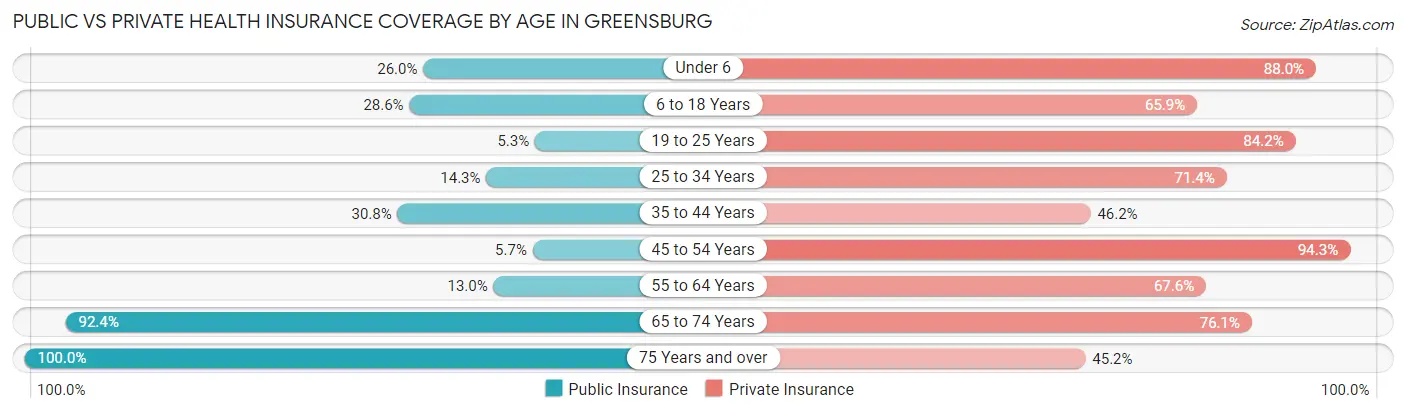
| Age Bracket | Public Insurance | Private Insurance |
| Under 6 | 13 (26.0%) | 44 (88.0%) |
| 6 to 18 Years | 26 (28.6%) | 60 (65.9%) |
| 19 to 25 Years | 1 (5.3%) | 16 (84.2%) |
| 25 to 34 Years | 7 (14.3%) | 35 (71.4%) |
| 35 to 44 Years | 12 (30.8%) | 18 (46.2%) |
| 45 to 54 Years | 5 (5.7%) | 83 (94.3%) |
| 55 to 64 Years | 14 (13.0%) | 73 (67.6%) |
| 65 to 74 Years | 85 (92.4%) | 70 (76.1%) |
| 75 Years and over | 73 (100.0%) | 33 (45.2%) |
| Total | 236 (38.8%) | 432 (70.9%) |
Disability Status by Sex by Age in Greensburg
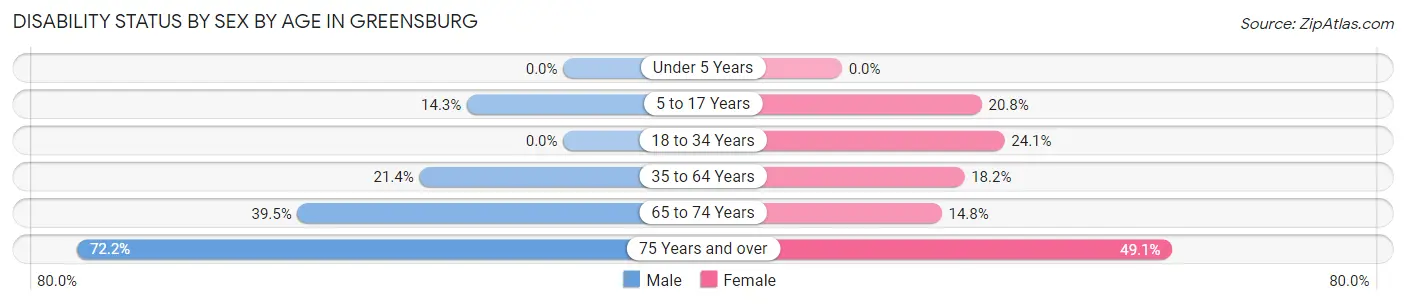
| Age Bracket | Male | Female |
| Under 5 Years | 0 (0.0%) | 0 (0.0%) |
| 5 to 17 Years | 5 (14.3%) | 11 (20.7%) |
| 18 to 34 Years | 0 (0.0%) | 14 (24.1%) |
| 35 to 64 Years | 22 (21.4%) | 24 (18.2%) |
| 65 to 74 Years | 15 (39.5%) | 8 (14.8%) |
| 75 Years and over | 13 (72.2%) | 27 (49.1%) |
Disability Class by Sex by Age in Greensburg
Disability Class: Hearing Difficulty
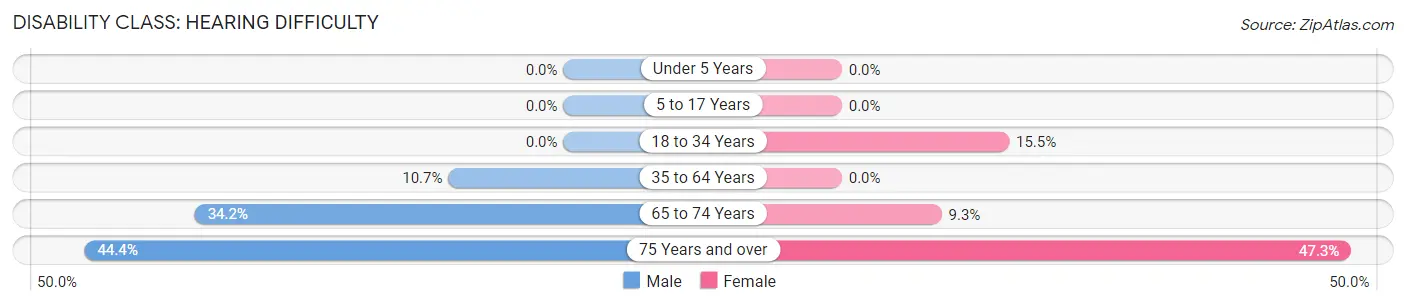
| Age Bracket | Male | Female |
| Under 5 Years | 0 (0.0%) | 0 (0.0%) |
| 5 to 17 Years | 0 (0.0%) | 0 (0.0%) |
| 18 to 34 Years | 0 (0.0%) | 9 (15.5%) |
| 35 to 64 Years | 11 (10.7%) | 0 (0.0%) |
| 65 to 74 Years | 13 (34.2%) | 5 (9.3%) |
| 75 Years and over | 8 (44.4%) | 26 (47.3%) |
Disability Class: Vision Difficulty
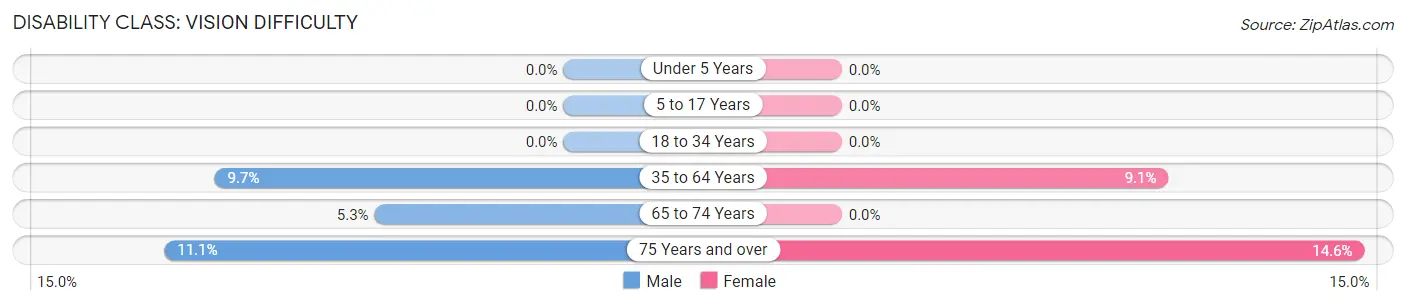
| Age Bracket | Male | Female |
| Under 5 Years | 0 (0.0%) | 0 (0.0%) |
| 5 to 17 Years | 0 (0.0%) | 0 (0.0%) |
| 18 to 34 Years | 0 (0.0%) | 0 (0.0%) |
| 35 to 64 Years | 10 (9.7%) | 12 (9.1%) |
| 65 to 74 Years | 2 (5.3%) | 0 (0.0%) |
| 75 Years and over | 2 (11.1%) | 8 (14.5%) |
Disability Class: Cognitive Difficulty
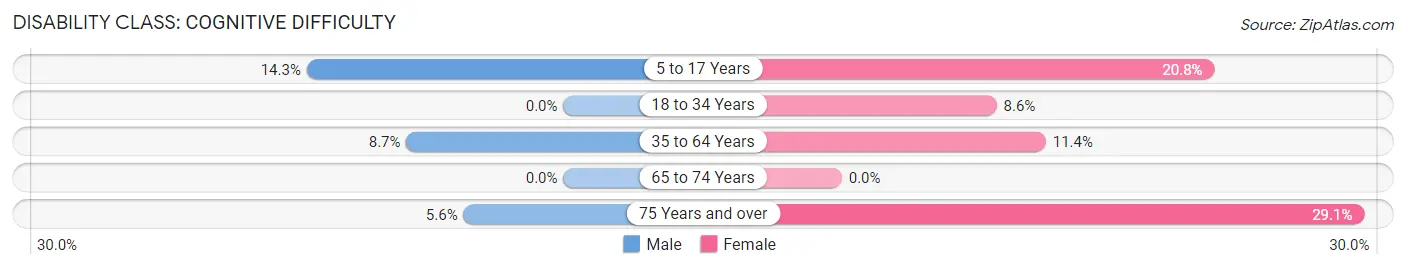
| Age Bracket | Male | Female |
| 5 to 17 Years | 5 (14.3%) | 11 (20.7%) |
| 18 to 34 Years | 0 (0.0%) | 5 (8.6%) |
| 35 to 64 Years | 9 (8.7%) | 15 (11.4%) |
| 65 to 74 Years | 0 (0.0%) | 0 (0.0%) |
| 75 Years and over | 1 (5.6%) | 16 (29.1%) |
Disability Class: Ambulatory Difficulty
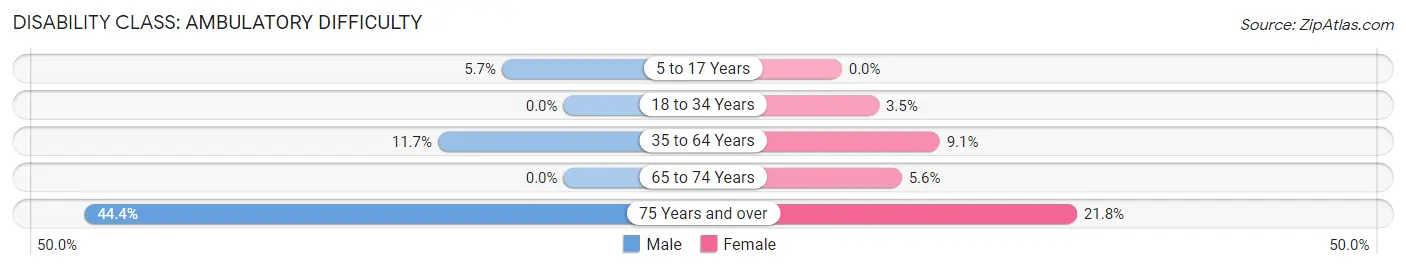
| Age Bracket | Male | Female |
| 5 to 17 Years | 2 (5.7%) | 0 (0.0%) |
| 18 to 34 Years | 0 (0.0%) | 2 (3.5%) |
| 35 to 64 Years | 12 (11.7%) | 12 (9.1%) |
| 65 to 74 Years | 0 (0.0%) | 3 (5.6%) |
| 75 Years and over | 8 (44.4%) | 12 (21.8%) |
Disability Class: Self-Care Difficulty
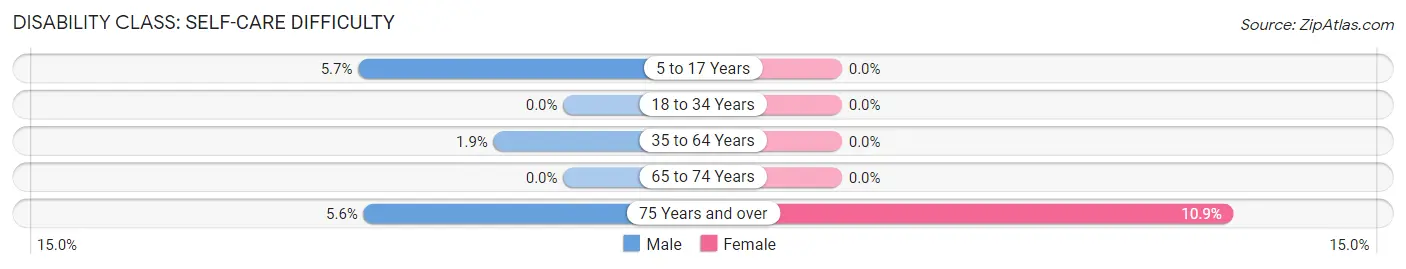
| Age Bracket | Male | Female |
| 5 to 17 Years | 2 (5.7%) | 0 (0.0%) |
| 18 to 34 Years | 0 (0.0%) | 0 (0.0%) |
| 35 to 64 Years | 2 (1.9%) | 0 (0.0%) |
| 65 to 74 Years | 0 (0.0%) | 0 (0.0%) |
| 75 Years and over | 1 (5.6%) | 6 (10.9%) |
Technology Access in Greensburg
Computing Device Access in Greensburg
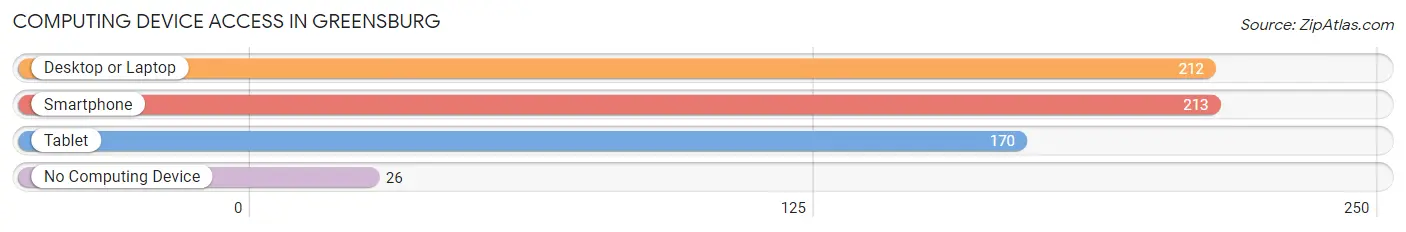
| Device Type | # Households | % Households |
| Desktop or Laptop | 212 | 74.4% |
| Smartphone | 213 | 74.7% |
| Tablet | 170 | 59.7% |
| No Computing Device | 26 | 9.1% |
| Total | 285 | 100.0% |
Internet Access in Greensburg
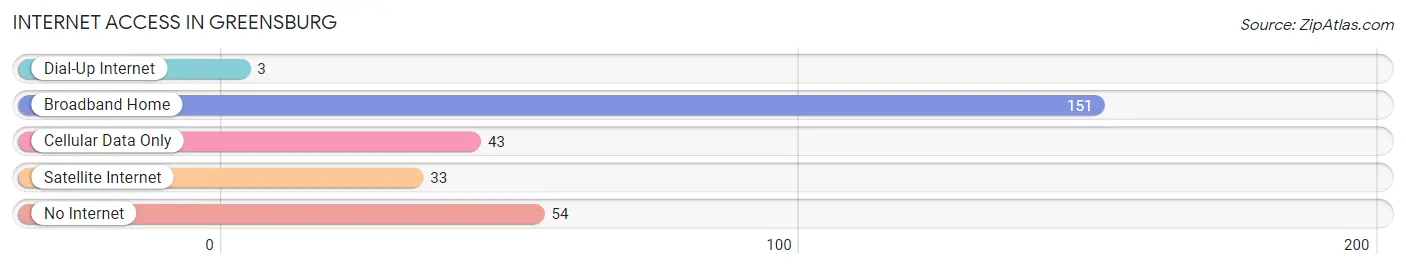
| Internet Type | # Households | % Households |
| Dial-Up Internet | 3 | 1.1% |
| Broadband Home | 151 | 53.0% |
| Cellular Data Only | 43 | 15.1% |
| Satellite Internet | 33 | 11.6% |
| No Internet | 54 | 19.0% |
| Total | 285 | 100.0% |
Greensburg Summary
Greensburg, Kansas is a small town located in Kiowa County in the southwestern part of the state. It is situated on the edge of the Great Plains, and is surrounded by rolling hills and prairies. The town was founded in 1885 and has a population of approximately 775 people.
Greensburg is located in the heart of the Great Plains, and is surrounded by rolling hills and prairies. The town is situated on the edge of the Arkansas River, and is located about 50 miles south of Wichita. The town is also located near the Cimarron National Grassland, which is a popular destination for outdoor recreation.
Greensburg has a rich history that dates back to the late 1800s. The town was founded in 1885 by a group of settlers from the nearby town of Kiowa. The settlers were looking for a place to settle and start a new life, and they chose the area around Greensburg. The town was named after the nearby creek, which was named after a local settler named Green.
The town quickly grew and prospered, and by the early 1900s it had become a thriving agricultural center. The town was home to several businesses, including a flour mill, a creamery, and a general store. The town also had a school, a post office, and a bank.
Greensburg has a diverse economy, with a variety of industries. The town is home to several manufacturing companies, including a plastics plant, a metal fabrication plant, and a printing company. The town also has a number of retail stores, including a grocery store, a hardware store, and a clothing store.
The town is also home to a number of agricultural businesses, including a dairy farm, a feedlot, and a grain elevator. The town is also home to a number of small businesses, including a restaurant, a barber shop, and a beauty salon.
Greensburg has a population of approximately 775 people, according to the 2010 census. The town is predominantly white, with a small percentage of African Americans, Hispanics, and Native Americans. The median household income in Greensburg is $37,000, and the median home value is $90,000.
Greensburg is a small town with a rich history and a diverse economy. The town is home to a variety of businesses, and is a popular destination for outdoor recreation. The town is also home to a number of small businesses, and is a great place to live and work.
Common Questions
What is Per Capita Income in Greensburg?
Per Capita income in Greensburg is $34,747.
What is the Median Family Income in Greensburg?
Median Family Income in Greensburg is $91,406.
What is the Median Household income in Greensburg?
Median Household Income in Greensburg is $52,083.
What is Income or Wage Gap in Greensburg?
Income or Wage Gap in Greensburg is 38.9%.
Women in Greensburg earn 61.1 cents for every dollar earned by a man.
What is Inequality or Gini Index in Greensburg?
Inequality or Gini Index in Greensburg is 0.46.
What is the Total Population of Greensburg?
Total Population of Greensburg is 629.
What is the Total Male Population of Greensburg?
Total Male Population of Greensburg is 256.
What is the Total Female Population of Greensburg?
Total Female Population of Greensburg is 373.
What is the Ratio of Males per 100 Females in Greensburg?
There are 68.63 Males per 100 Females in Greensburg.
What is the Ratio of Females per 100 Males in Greensburg?
There are 145.70 Females per 100 Males in Greensburg.
What is the Median Population Age in Greensburg?
Median Population Age in Greensburg is 52.3 Years.
What is the Average Family Size in Greensburg
Average Family Size in Greensburg is 3.2 People.
What is the Average Household Size in Greensburg
Average Household Size in Greensburg is 2.1 People.
How Large is the Labor Force in Greensburg?
There are 313 People in the Labor Forcein in Greensburg.
What is the Percentage of People in the Labor Force in Greensburg?
62.1% of People are in the Labor Force in Greensburg.
What is the Unemployment Rate in Greensburg?
Unemployment Rate in Greensburg is 3.5%.