Clearwater, KS Map & Demographics
Clearwater Map
Clearwater Overview
$29,737
PER CAPITA INCOME
$84,506
AVG FAMILY INCOME
$78,472
AVG HOUSEHOLD INCOME
31.1%
WAGE / INCOME GAP [ % ]
68.9¢/ $1
WAGE / INCOME GAP [ $ ]
0.41
INEQUALITY / GINI INDEX
2,544
TOTAL POPULATION
1,346
MALE POPULATION
1,198
FEMALE POPULATION
112.35
MALES / 100 FEMALES
89.00
FEMALES / 100 MALES
36.7
MEDIAN AGE
3.4
AVG FAMILY SIZE
3.0
AVG HOUSEHOLD SIZE
1,168
LABOR FORCE [ PEOPLE ]
64.4%
PERCENT IN LABOR FORCE
2.9%
UNEMPLOYMENT RATE
Clearwater Zip Codes
Clearwater Area Codes
Income in Clearwater
Income Overview in Clearwater
Per Capita Income in Clearwater is $29,737, while median incomes of families and households are $84,506 and $78,472 respectively.
| Characteristic | Number | Measure |
| Per Capita Income | 2,544 | $29,737 |
| Median Family Income | 613 | $84,506 |
| Mean Family Income | 613 | $97,999 |
| Median Household Income | 830 | $78,472 |
| Mean Household Income | 830 | $85,488 |
| Income Deficit | 613 | $0 |
| Wage / Income Gap (%) | 2,544 | 31.07% |
| Wage / Income Gap ($) | 2,544 | 68.93¢ per $1 |
| Gini / Inequality Index | 2,544 | 0.41 |
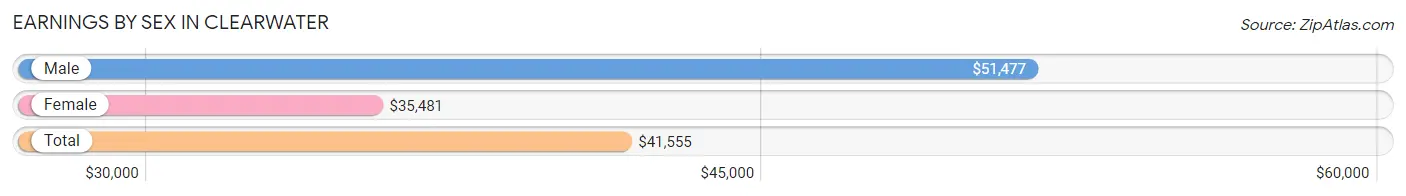
Earnings by Sex in Clearwater
Average Earnings in Clearwater are $41,555, $51,477 for men and $35,481 for women, a difference of 31.1%.
| Sex | Number | Average Earnings |
| Male | 638 (53.5%) | $51,477 |
| Female | 555 (46.5%) | $35,481 |
| Total | 1,193 (100.0%) | $41,555 |
Earnings by Sex by Income Bracket in Clearwater
The most common earnings brackets in Clearwater are $75,000 to $99,999 for men (115 | 18.0%) and $55,000 to $64,999 for women (58 | 10.4%).
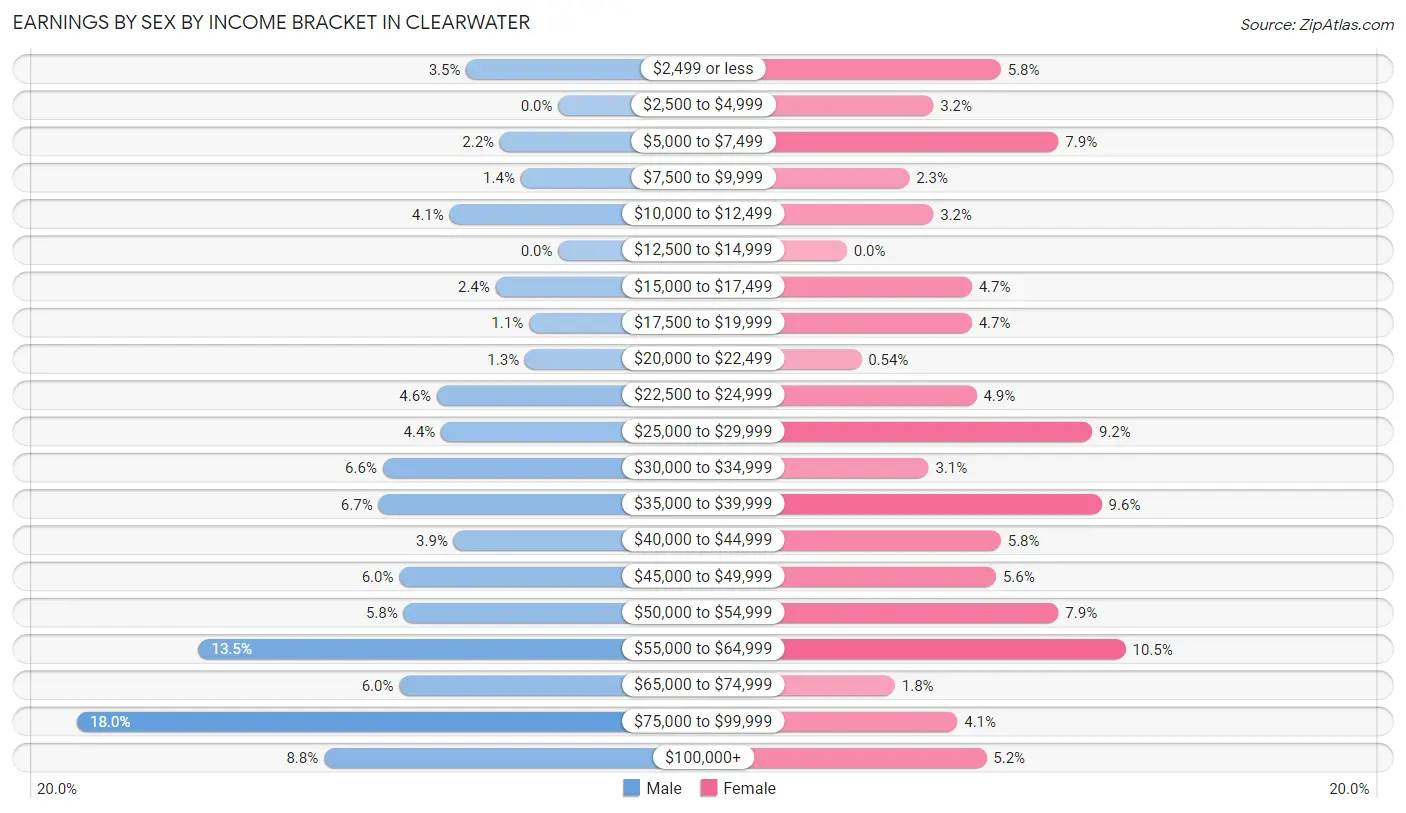
| Income | Male | Female |
| $2,499 or less | 22 (3.5%) | 32 (5.8%) |
| $2,500 to $4,999 | 0 (0.0%) | 18 (3.2%) |
| $5,000 to $7,499 | 14 (2.2%) | 44 (7.9%) |
| $7,500 to $9,999 | 9 (1.4%) | 13 (2.3%) |
| $10,000 to $12,499 | 26 (4.1%) | 18 (3.2%) |
| $12,500 to $14,999 | 0 (0.0%) | 0 (0.0%) |
| $15,000 to $17,499 | 15 (2.4%) | 26 (4.7%) |
| $17,500 to $19,999 | 7 (1.1%) | 26 (4.7%) |
| $20,000 to $22,499 | 8 (1.3%) | 3 (0.5%) |
| $22,500 to $24,999 | 29 (4.5%) | 27 (4.9%) |
| $25,000 to $29,999 | 28 (4.4%) | 51 (9.2%) |
| $30,000 to $34,999 | 42 (6.6%) | 17 (3.1%) |
| $35,000 to $39,999 | 43 (6.7%) | 53 (9.6%) |
| $40,000 to $44,999 | 25 (3.9%) | 32 (5.8%) |
| $45,000 to $49,999 | 38 (6.0%) | 31 (5.6%) |
| $50,000 to $54,999 | 37 (5.8%) | 44 (7.9%) |
| $55,000 to $64,999 | 86 (13.5%) | 58 (10.4%) |
| $65,000 to $74,999 | 38 (6.0%) | 10 (1.8%) |
| $75,000 to $99,999 | 115 (18.0%) | 23 (4.1%) |
| $100,000+ | 56 (8.8%) | 29 (5.2%) |
| Total | 638 (100.0%) | 555 (100.0%) |
Earnings by Sex by Educational Attainment in Clearwater
Average earnings in Clearwater are $55,545 for men and $38,563 for women, a difference of 30.6%. Men with an educational attainment of graduate degree enjoy the highest average annual earnings of $94,688, while those with less than high school education earn the least with $36,944. Women with an educational attainment of bachelor's degree earn the most with the average annual earnings of $47,031, while those with college or associate's degree education have the smallest earnings of $30,536.
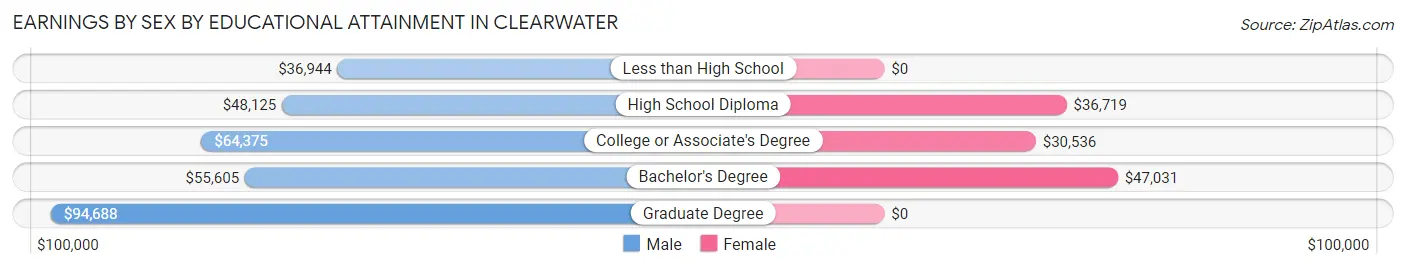
| Educational Attainment | Male Income | Female Income |
| Less than High School | $36,944 | $0 |
| High School Diploma | $48,125 | $36,719 |
| College or Associate's Degree | $64,375 | $30,536 |
| Bachelor's Degree | $55,605 | $47,031 |
| Graduate Degree | $94,688 | $0 |
| Total | $55,545 | $38,563 |
Family Income in Clearwater
Family Income Brackets in Clearwater
According to the Clearwater family income data, there are 149 families falling into the $75,000 to $99,999 income range, which is the most common income bracket and makes up 24.3% of all families. Conversely, the $10,000 to $14,999 income bracket is the least frequent group with only 5 families (0.8%) belonging to this category.
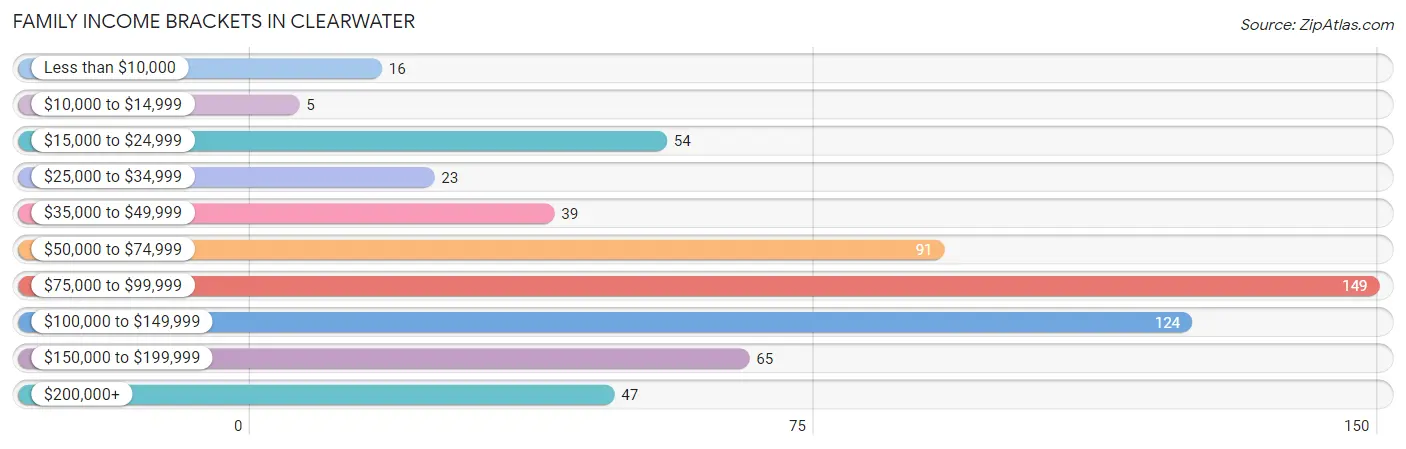
| Income Bracket | # Families | % Families |
| Less than $10,000 | 16 | 2.6% |
| $10,000 to $14,999 | 5 | 0.8% |
| $15,000 to $24,999 | 54 | 8.8% |
| $25,000 to $34,999 | 23 | 3.8% |
| $35,000 to $49,999 | 39 | 6.4% |
| $50,000 to $74,999 | 91 | 14.8% |
| $75,000 to $99,999 | 149 | 24.3% |
| $100,000 to $149,999 | 124 | 20.2% |
| $150,000 to $199,999 | 65 | 10.6% |
| $200,000+ | 47 | 7.7% |
Family Income by Famaliy Size in Clearwater
4-person families (83 | 13.5%) account for the highest median family income in Clearwater with $107,679 per family, while 2-person families (302 | 49.3%) have the highest median income of $40,312 per family member.
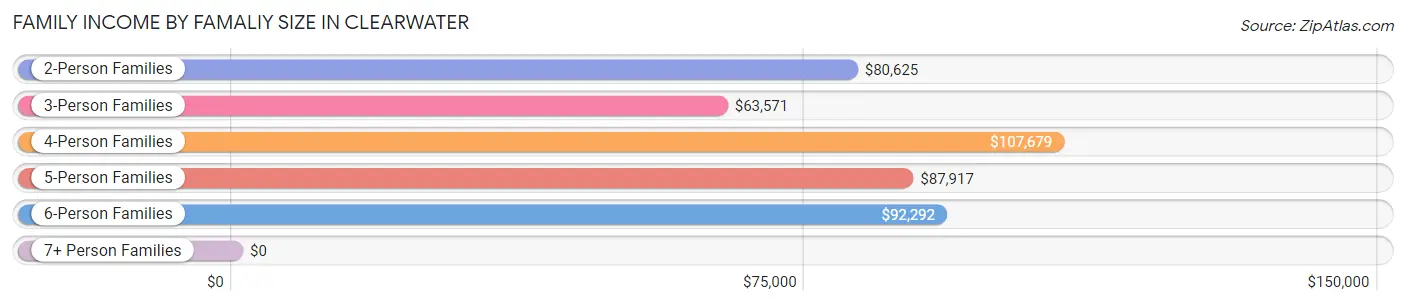
| Income Bracket | # Families | Median Income |
| 2-Person Families | 302 (49.3%) | $80,625 |
| 3-Person Families | 60 (9.8%) | $63,571 |
| 4-Person Families | 83 (13.5%) | $107,679 |
| 5-Person Families | 124 (20.2%) | $87,917 |
| 6-Person Families | 41 (6.7%) | $92,292 |
| 7+ Person Families | 3 (0.5%) | $0 |
| Total | 613 (100.0%) | $84,506 |
Family Income by Number of Earners in Clearwater
The median family income in Clearwater is $84,506, with families comprising 3+ earners (63) having the highest median family income of $143,036, while families with 1 earner (169) have the lowest median family income of $37,396, accounting for 10.3% and 27.6% of families, respectively.
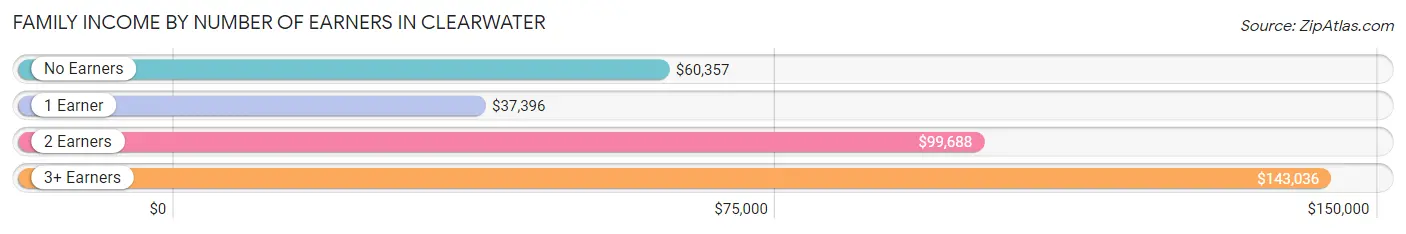
| Number of Earners | # Families | Median Income |
| No Earners | 60 (9.8%) | $60,357 |
| 1 Earner | 169 (27.6%) | $37,396 |
| 2 Earners | 321 (52.4%) | $99,688 |
| 3+ Earners | 63 (10.3%) | $143,036 |
| Total | 613 (100.0%) | $84,506 |
Household Income in Clearwater
Household Income Brackets in Clearwater
With 171 households falling in the category, the $75,000 to $99,999 income range is the most frequent in Clearwater, accounting for 20.6% of all households. In contrast, only 31 households (3.7%) fall into the less than $10,000 income bracket, making it the least populous group.
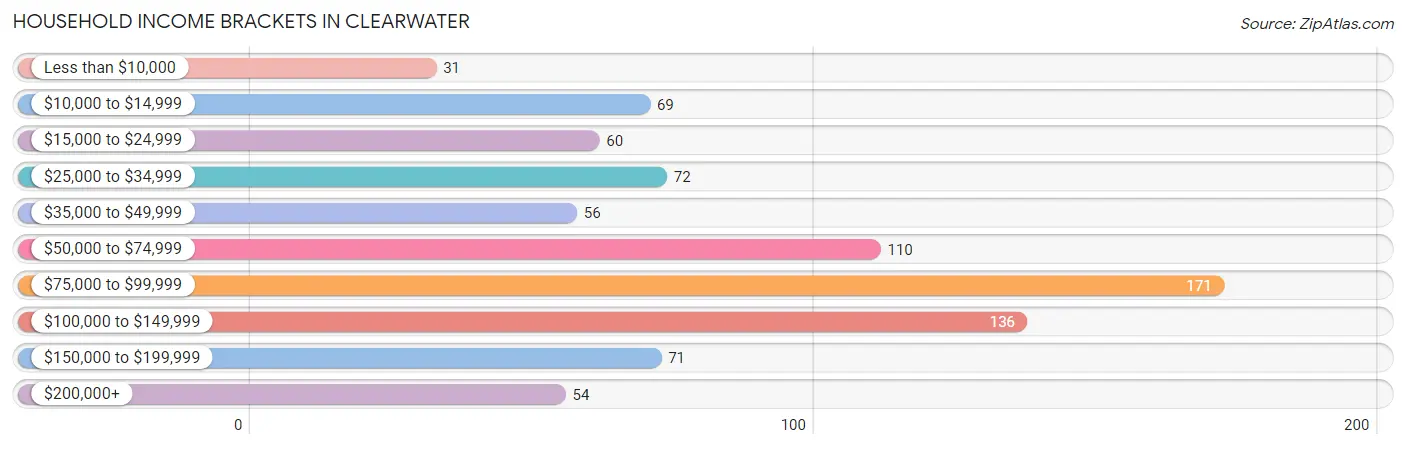
| Income Bracket | # Households | % Households |
| Less than $10,000 | 31 | 3.7% |
| $10,000 to $14,999 | 69 | 8.3% |
| $15,000 to $24,999 | 60 | 7.2% |
| $25,000 to $34,999 | 72 | 8.7% |
| $35,000 to $49,999 | 56 | 6.7% |
| $50,000 to $74,999 | 110 | 13.3% |
| $75,000 to $99,999 | 171 | 20.6% |
| $100,000 to $149,999 | 136 | 16.4% |
| $150,000 to $199,999 | 71 | 8.6% |
| $200,000+ | 54 | 6.5% |
Household Income by Householder Age in Clearwater
The median household income in Clearwater is $78,472, with the highest median household income of $84,973 found in the 25 to 44 years age bracket for the primary householder. A total of 281 households (33.9%) fall into this category. Meanwhile, the 15 to 24 years age bracket for the primary householder has the lowest median household income of $0, with 5 households (0.6%) in this group.
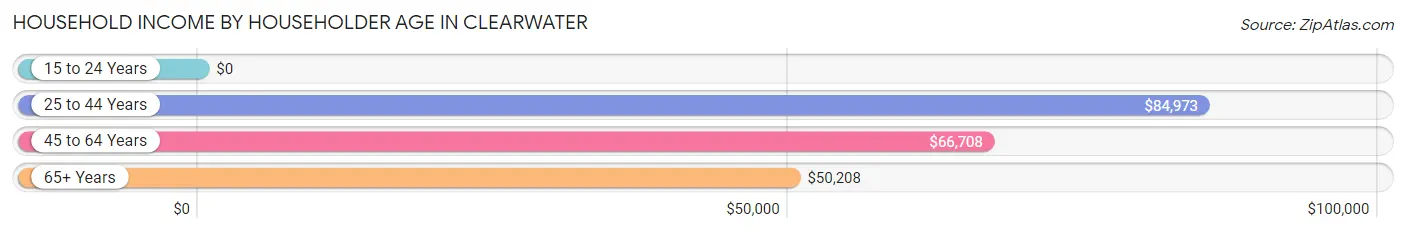
| Income Bracket | # Households | Median Income |
| 15 to 24 Years | 5 (0.6%) | $0 |
| 25 to 44 Years | 281 (33.9%) | $84,973 |
| 45 to 64 Years | 307 (37.0%) | $66,708 |
| 65+ Years | 237 (28.5%) | $50,208 |
| Total | 830 (100.0%) | $78,472 |
Poverty in Clearwater
Income Below Poverty by Sex and Age in Clearwater
With 9.8% poverty level for males and 16.6% for females among the residents of Clearwater, 15 year old males and 25 to 34 year old females are the most vulnerable to poverty, with 5 males (33.3%) and 77 females (46.7%) in their respective age groups living below the poverty level.
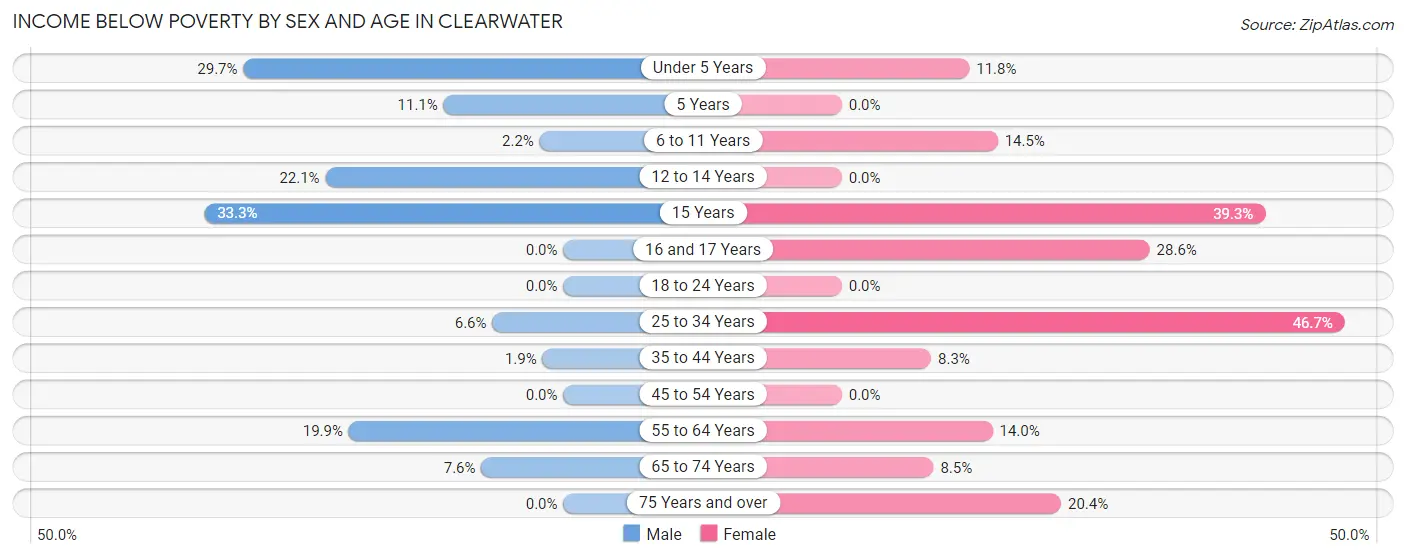
| Age Bracket | Male | Female |
| Under 5 Years | 30 (29.7%) | 11 (11.8%) |
| 5 Years | 8 (11.1%) | 0 (0.0%) |
| 6 to 11 Years | 4 (2.2%) | 11 (14.5%) |
| 12 to 14 Years | 17 (22.1%) | 0 (0.0%) |
| 15 Years | 5 (33.3%) | 11 (39.3%) |
| 16 and 17 Years | 0 (0.0%) | 8 (28.6%) |
| 18 to 24 Years | 0 (0.0%) | 0 (0.0%) |
| 25 to 34 Years | 6 (6.6%) | 77 (46.7%) |
| 35 to 44 Years | 4 (1.9%) | 16 (8.3%) |
| 45 to 54 Years | 0 (0.0%) | 0 (0.0%) |
| 55 to 64 Years | 45 (19.9%) | 20 (14.0%) |
| 65 to 74 Years | 7 (7.6%) | 8 (8.5%) |
| 75 Years and over | 0 (0.0%) | 23 (20.3%) |
| Total | 126 (9.8%) | 185 (16.6%) |
Income Above Poverty by Sex and Age in Clearwater
According to the poverty statistics in Clearwater, males aged 16 and 17 years and females aged 12 to 14 years are the age groups that are most secure financially, with 100.0% of males and 100.0% of females in these age groups living above the poverty line.
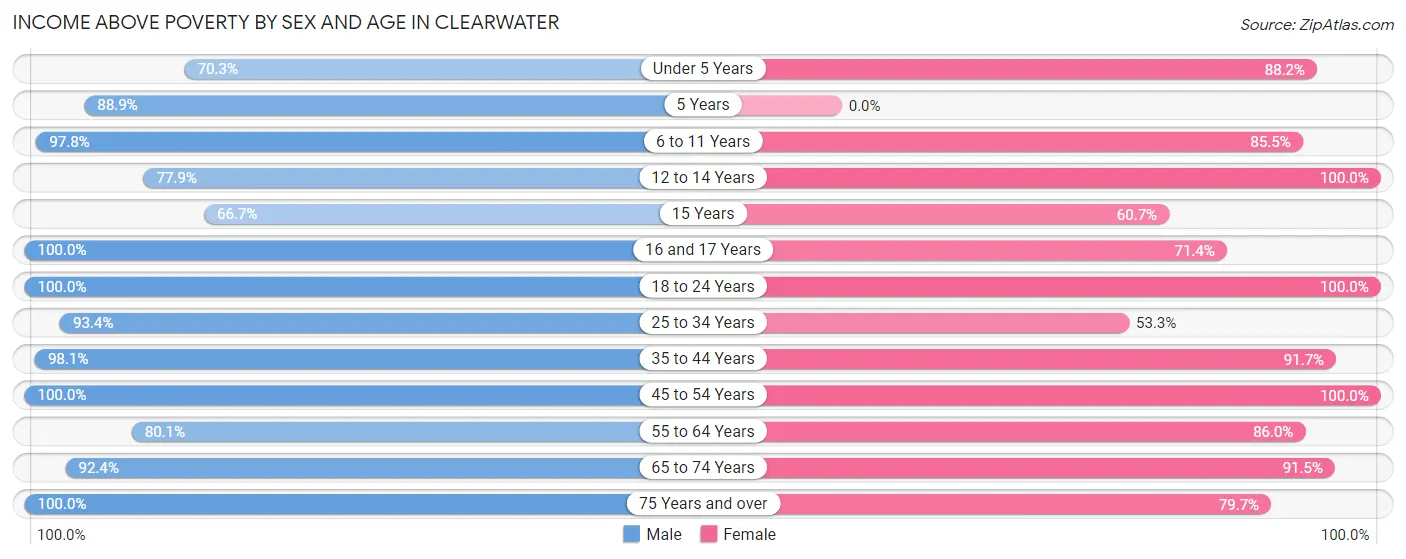
| Age Bracket | Male | Female |
| Under 5 Years | 71 (70.3%) | 82 (88.2%) |
| 5 Years | 64 (88.9%) | 0 (0.0%) |
| 6 to 11 Years | 178 (97.8%) | 65 (85.5%) |
| 12 to 14 Years | 60 (77.9%) | 32 (100.0%) |
| 15 Years | 10 (66.7%) | 17 (60.7%) |
| 16 and 17 Years | 44 (100.0%) | 20 (71.4%) |
| 18 to 24 Years | 64 (100.0%) | 57 (100.0%) |
| 25 to 34 Years | 85 (93.4%) | 88 (53.3%) |
| 35 to 44 Years | 203 (98.1%) | 177 (91.7%) |
| 45 to 54 Years | 80 (100.0%) | 96 (100.0%) |
| 55 to 64 Years | 181 (80.1%) | 123 (86.0%) |
| 65 to 74 Years | 85 (92.4%) | 86 (91.5%) |
| 75 Years and over | 38 (100.0%) | 90 (79.6%) |
| Total | 1,163 (90.2%) | 933 (83.5%) |
Income Below Poverty Among Married-Couple Families in Clearwater
The poverty statistics for married-couple families in Clearwater show that 1.5% or 7 of the total 481 families live below the poverty line. Families with no children have the highest poverty rate of 2.8%, comprising of 7 families. On the other hand, families with 1 or 2 children have the lowest poverty rate of 0.0%, which includes 0 families.
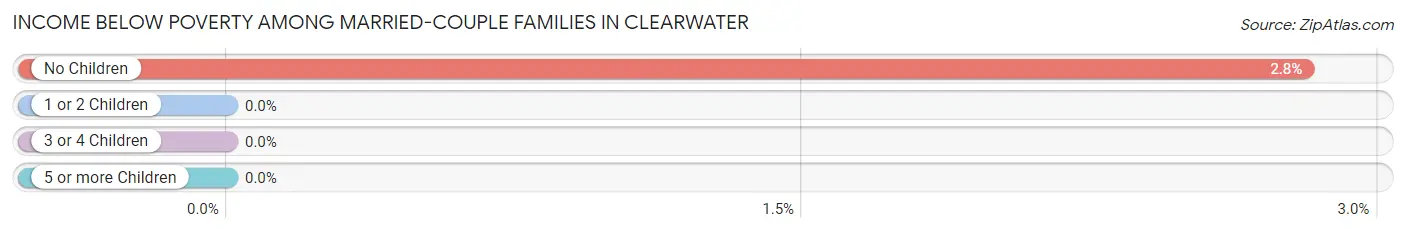
| Children | Above Poverty | Below Poverty |
| No Children | 242 (97.2%) | 7 (2.8%) |
| 1 or 2 Children | 119 (100.0%) | 0 (0.0%) |
| 3 or 4 Children | 110 (100.0%) | 0 (0.0%) |
| 5 or more Children | 3 (100.0%) | 0 (0.0%) |
| Total | 474 (98.5%) | 7 (1.5%) |
Income Below Poverty Among Single-Parent Households in Clearwater
According to the poverty data in Clearwater, 18.2% or 4 single-father households and 56.4% or 62 single-mother households are living below the poverty line. Among single-father households, those with 5 or more children have the highest poverty rate, with 4 households (100.0%) experiencing poverty. Likewise, among single-mother households, those with 3 or 4 children have the highest poverty rate, with 15 households (100.0%) falling below the poverty line.
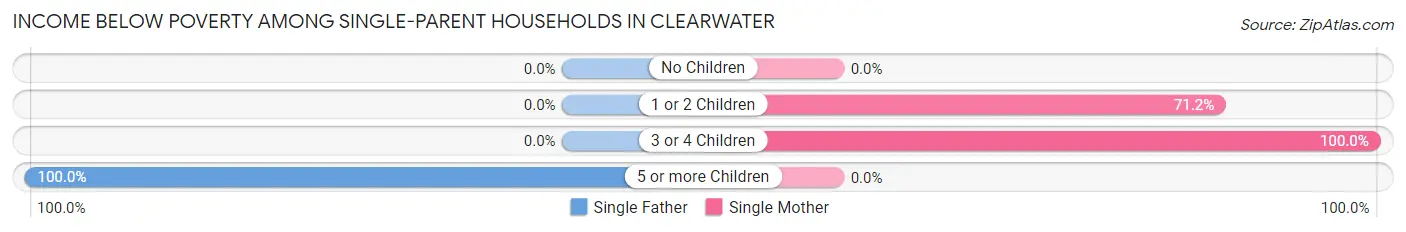
| Children | Single Father | Single Mother |
| No Children | 0 (0.0%) | 0 (0.0%) |
| 1 or 2 Children | 0 (0.0%) | 47 (71.2%) |
| 3 or 4 Children | 0 (0.0%) | 15 (100.0%) |
| 5 or more Children | 4 (100.0%) | 0 (0.0%) |
| Total | 4 (18.2%) | 62 (56.4%) |
Income Below Poverty Among Married-Couple vs Single-Parent Households in Clearwater
The poverty data for Clearwater shows that 7 of the married-couple family households (1.5%) and 66 of the single-parent households (50.0%) are living below the poverty level. Within the married-couple family households, those with no children have the highest poverty rate, with 7 households (2.8%) falling below the poverty line. Among the single-parent households, those with 3 or 4 children have the highest poverty rate, with 15 household (100.0%) living below poverty.
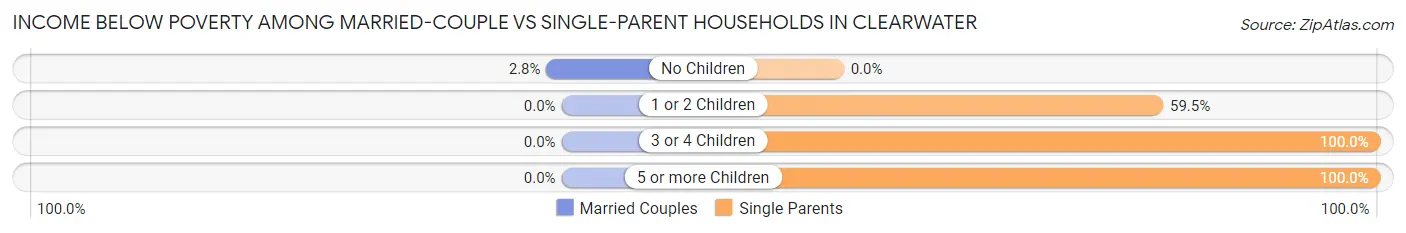
| Children | Married-Couple Families | Single-Parent Households |
| No Children | 7 (2.8%) | 0 (0.0%) |
| 1 or 2 Children | 0 (0.0%) | 47 (59.5%) |
| 3 or 4 Children | 0 (0.0%) | 15 (100.0%) |
| 5 or more Children | 0 (0.0%) | 4 (100.0%) |
| Total | 7 (1.5%) | 66 (50.0%) |
Race in Clearwater
The most populous races in Clearwater are White / Caucasian (2,289 | 90.0%), Two or more Races (154 | 6.0%), and Hispanic or Latino (80 | 3.1%).
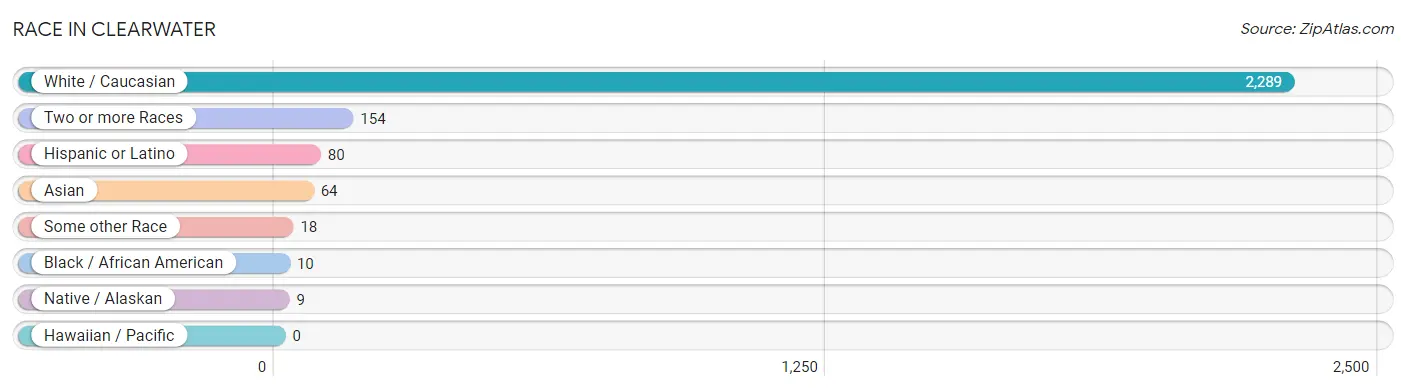
| Race | # Population | % Population |
| Asian | 64 | 2.5% |
| Black / African American | 10 | 0.4% |
| Hawaiian / Pacific | 0 | 0.0% |
| Hispanic or Latino | 80 | 3.1% |
| Native / Alaskan | 9 | 0.4% |
| White / Caucasian | 2,289 | 90.0% |
| Two or more Races | 154 | 6.0% |
| Some other Race | 18 | 0.7% |
| Total | 2,544 | 100.0% |
Ancestry in Clearwater
The most populous ancestries reported in Clearwater are German (597 | 23.5%), English (305 | 12.0%), Irish (255 | 10.0%), American (126 | 5.0%), and European (86 | 3.4%), together accounting for 53.8% of all Clearwater residents.
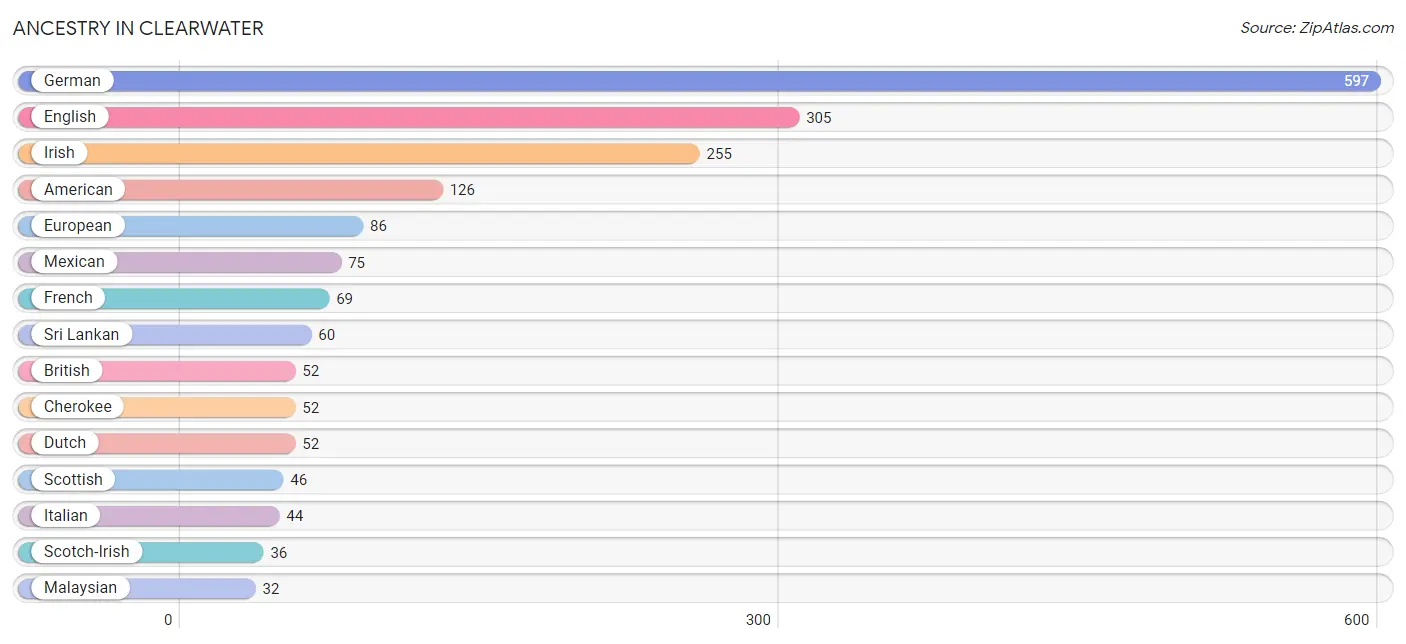
| Ancestry | # Population | % Population |
| American | 126 | 5.0% |
| Austrian | 6 | 0.2% |
| Bhutanese | 22 | 0.9% |
| British | 52 | 2.0% |
| Canadian | 5 | 0.2% |
| Cherokee | 52 | 2.0% |
| Comanche | 8 | 0.3% |
| Czech | 10 | 0.4% |
| Dutch | 52 | 2.0% |
| English | 305 | 12.0% |
| European | 86 | 3.4% |
| French | 69 | 2.7% |
| German | 597 | 23.5% |
| Irish | 255 | 10.0% |
| Italian | 44 | 1.7% |
| Korean | 12 | 0.5% |
| Malaysian | 32 | 1.3% |
| Mexican | 75 | 2.9% |
| Norwegian | 30 | 1.2% |
| Osage | 30 | 1.2% |
| Polish | 18 | 0.7% |
| Potawatomi | 3 | 0.1% |
| Puerto Rican | 5 | 0.2% |
| Russian | 1 | 0.0% |
| Scandinavian | 5 | 0.2% |
| Scotch-Irish | 36 | 1.4% |
| Scottish | 46 | 1.8% |
| Sri Lankan | 60 | 2.4% |
| Swedish | 27 | 1.1% |
| Swiss | 10 | 0.4% |
| Thai | 9 | 0.4% |
| Welsh | 31 | 1.2% | View All 32 Rows |
Immigrants in Clearwater
The most numerous immigrant groups reported in Clearwater came from Asia (53 | 2.1%), South Eastern Asia (53 | 2.1%), Vietnam (26 | 1.0%), Central America (22 | 0.9%), and Latin America (22 | 0.9%), together accounting for 6.9% of all Clearwater residents.
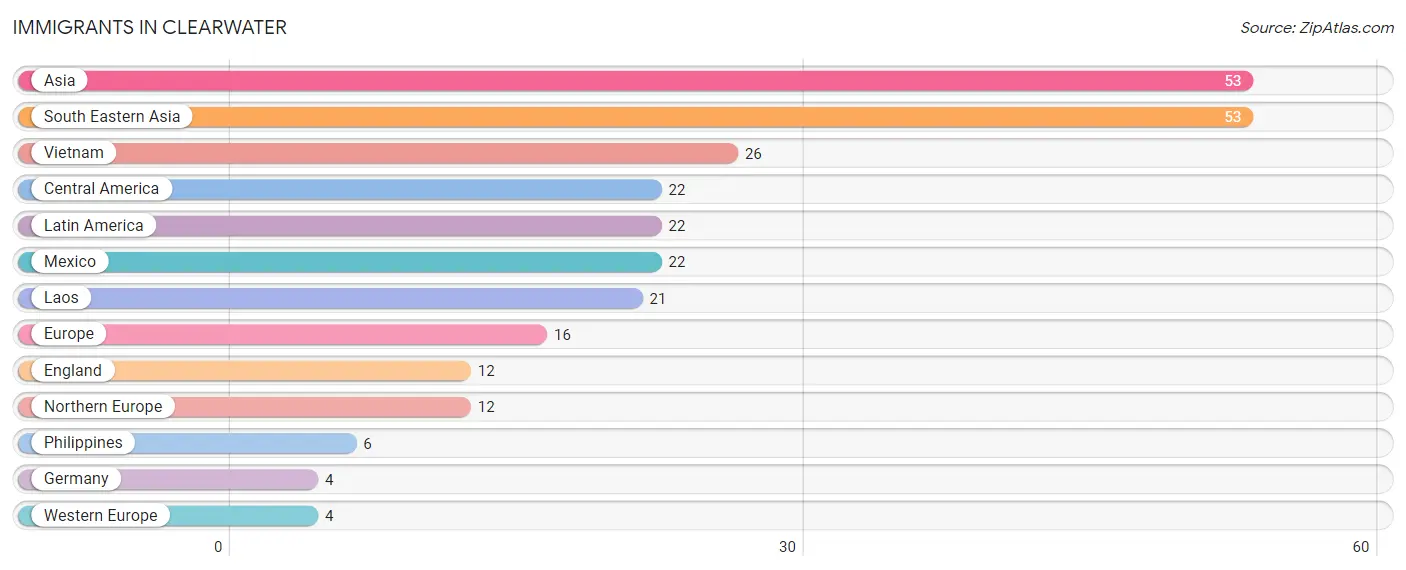
| Immigration Origin | # Population | % Population |
| Asia | 53 | 2.1% |
| Central America | 22 | 0.9% |
| England | 12 | 0.5% |
| Europe | 16 | 0.6% |
| Germany | 4 | 0.2% |
| Laos | 21 | 0.8% |
| Latin America | 22 | 0.9% |
| Mexico | 22 | 0.9% |
| Northern Europe | 12 | 0.5% |
| Philippines | 6 | 0.2% |
| South Eastern Asia | 53 | 2.1% |
| Vietnam | 26 | 1.0% |
| Western Europe | 4 | 0.2% | View All 13 Rows |
Sex and Age in Clearwater
Sex and Age in Clearwater
The most populous age groups in Clearwater are 5 to 9 Years (210 | 15.6%) for men and 35 to 39 Years (101 | 8.4%) for women.
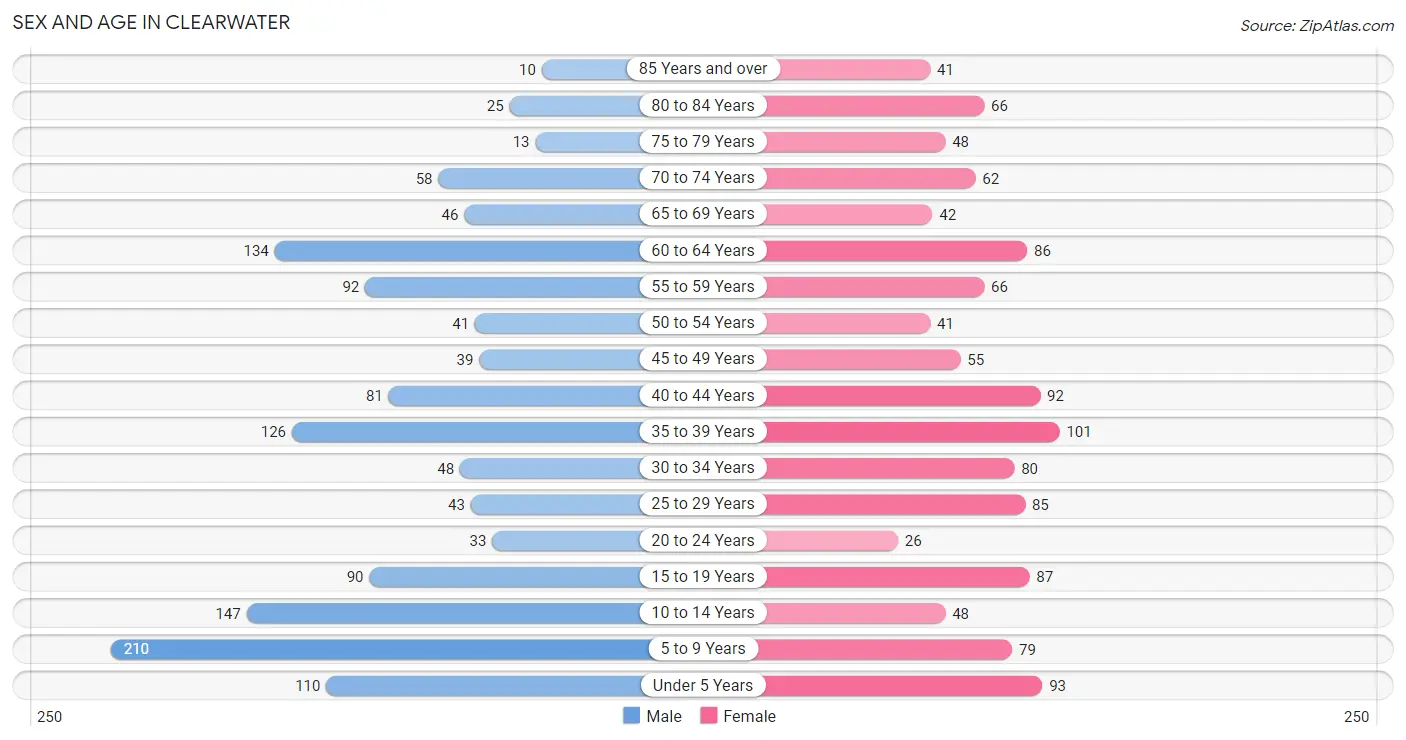
| Age Bracket | Male | Female |
| Under 5 Years | 110 (8.2%) | 93 (7.8%) |
| 5 to 9 Years | 210 (15.6%) | 79 (6.6%) |
| 10 to 14 Years | 147 (10.9%) | 48 (4.0%) |
| 15 to 19 Years | 90 (6.7%) | 87 (7.3%) |
| 20 to 24 Years | 33 (2.5%) | 26 (2.2%) |
| 25 to 29 Years | 43 (3.2%) | 85 (7.1%) |
| 30 to 34 Years | 48 (3.6%) | 80 (6.7%) |
| 35 to 39 Years | 126 (9.4%) | 101 (8.4%) |
| 40 to 44 Years | 81 (6.0%) | 92 (7.7%) |
| 45 to 49 Years | 39 (2.9%) | 55 (4.6%) |
| 50 to 54 Years | 41 (3.0%) | 41 (3.4%) |
| 55 to 59 Years | 92 (6.8%) | 66 (5.5%) |
| 60 to 64 Years | 134 (10.0%) | 86 (7.2%) |
| 65 to 69 Years | 46 (3.4%) | 42 (3.5%) |
| 70 to 74 Years | 58 (4.3%) | 62 (5.2%) |
| 75 to 79 Years | 13 (1.0%) | 48 (4.0%) |
| 80 to 84 Years | 25 (1.9%) | 66 (5.5%) |
| 85 Years and over | 10 (0.7%) | 41 (3.4%) |
| Total | 1,346 (100.0%) | 1,198 (100.0%) |
Families and Households in Clearwater
Median Family Size in Clearwater
The median family size in Clearwater is 3.41 persons per family, with married-couple families (481 | 78.5%) accounting for the largest median family size of 3.64 persons per family. On the other hand, single female/mother families (110 | 17.9%) represent the smallest median family size with 2.45 persons per family.
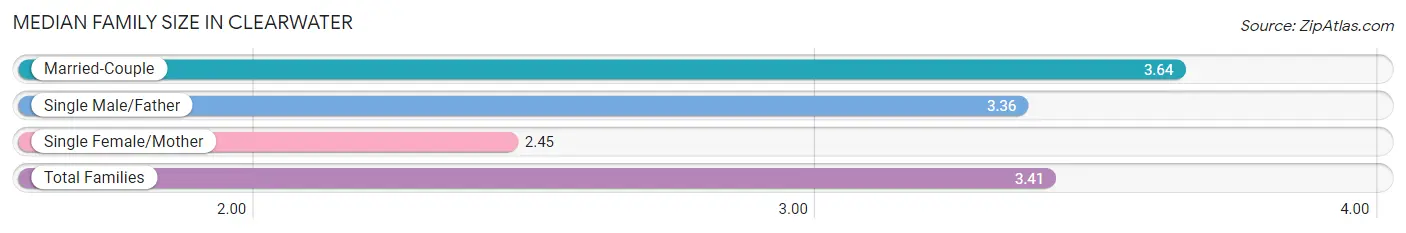
| Family Type | # Families | Family Size |
| Married-Couple | 481 (78.5%) | 3.64 |
| Single Male/Father | 22 (3.6%) | 3.36 |
| Single Female/Mother | 110 (17.9%) | 2.45 |
| Total Families | 613 (100.0%) | 3.41 |
Median Household Size in Clearwater
The median household size in Clearwater is 2.97 persons per household, with single male/father households (22 | 2.6%) accounting for the largest median household size of 4.68 persons per household. non-family households (217 | 26.1%) represent the smallest median household size with 1.07 persons per household.
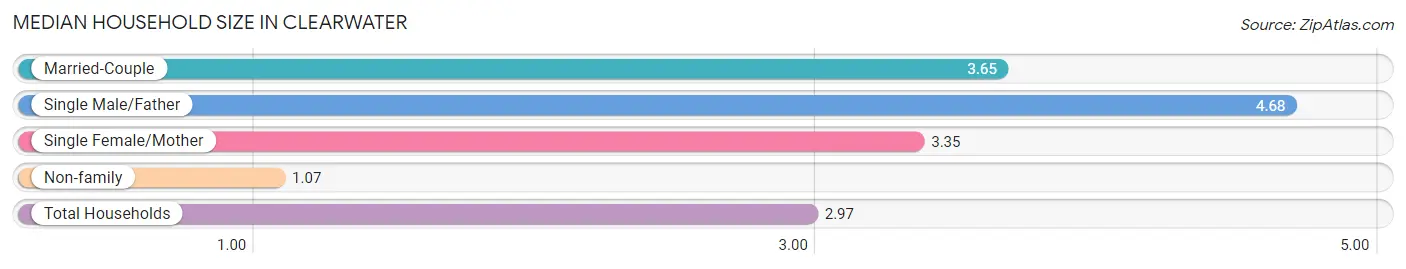
| Household Type | # Households | Household Size |
| Married-Couple | 481 (58.0%) | 3.65 |
| Single Male/Father | 22 (2.6%) | 4.68 |
| Single Female/Mother | 110 (13.3%) | 3.35 |
| Non-family | 217 (26.1%) | 1.07 |
| Total Households | 830 (100.0%) | 2.97 |
Household Size by Marriage Status in Clearwater
Out of a total of 830 households in Clearwater, 613 (73.9%) are family households, while 217 (26.1%) are nonfamily households. The most numerous type of family households are 2-person households, comprising 276, and the most common type of nonfamily households are 1-person households, comprising 204.
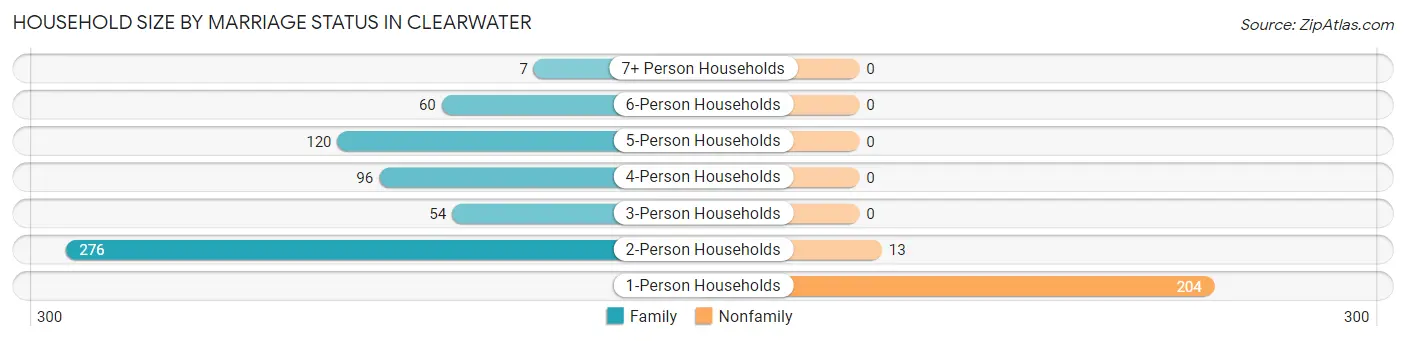
| Household Size | Family Households | Nonfamily Households |
| 1-Person Households | - | 204 (24.6%) |
| 2-Person Households | 276 (33.3%) | 13 (1.6%) |
| 3-Person Households | 54 (6.5%) | 0 (0.0%) |
| 4-Person Households | 96 (11.6%) | 0 (0.0%) |
| 5-Person Households | 120 (14.5%) | 0 (0.0%) |
| 6-Person Households | 60 (7.2%) | 0 (0.0%) |
| 7+ Person Households | 7 (0.8%) | 0 (0.0%) |
| Total | 613 (73.9%) | 217 (26.1%) |
Female Fertility in Clearwater
Fertility by Age in Clearwater
Average fertility rate in Clearwater is 105.0 births per 1,000 women. Women in the age bracket of 35 to 50 years have the highest fertility rate with 165.0 births per 1,000 women. Women in the age bracket of 35 to 50 years acount for 74.6% of all women with births.
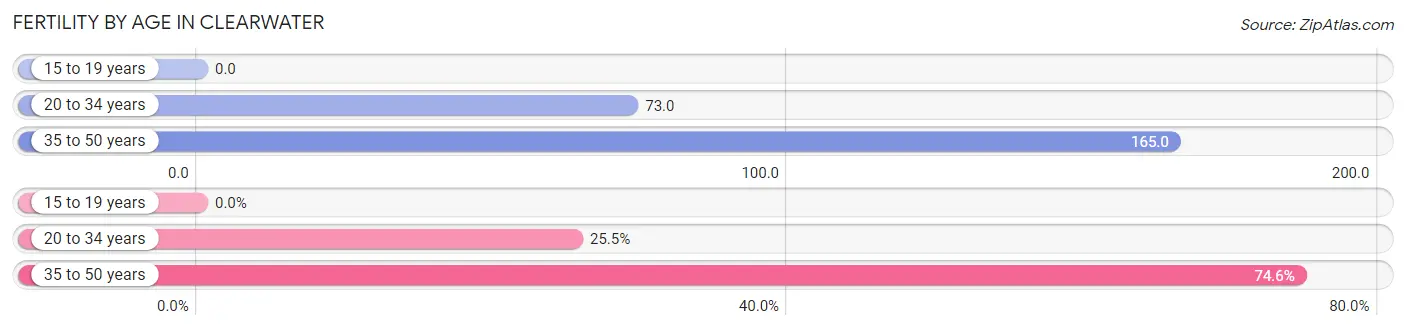
| Age Bracket | Women with Births | Births / 1,000 Women |
| 15 to 19 years | 0 (0.0%) | 0.0 |
| 20 to 34 years | 14 (25.5%) | 73.0 |
| 35 to 50 years | 41 (74.6%) | 165.0 |
| Total | 55 (100.0%) | 105.0 |
Fertility by Age by Marriage Status in Clearwater
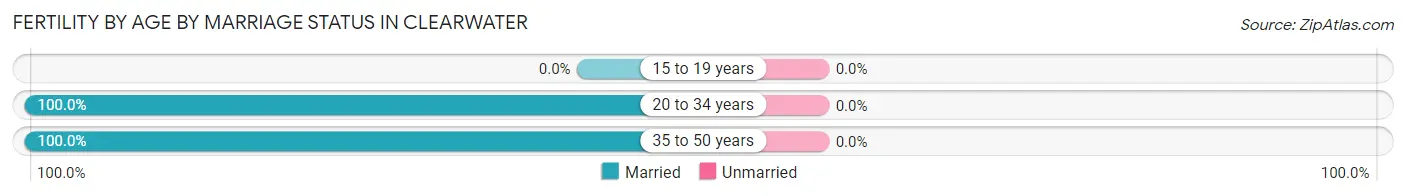
| Age Bracket | Married | Unmarried |
| 15 to 19 years | 0 (0.0%) | 0 (0.0%) |
| 20 to 34 years | 14 (100.0%) | 0 (0.0%) |
| 35 to 50 years | 41 (100.0%) | 0 (0.0%) |
| Total | 55 (100.0%) | 0 (0.0%) |
Fertility by Education in Clearwater
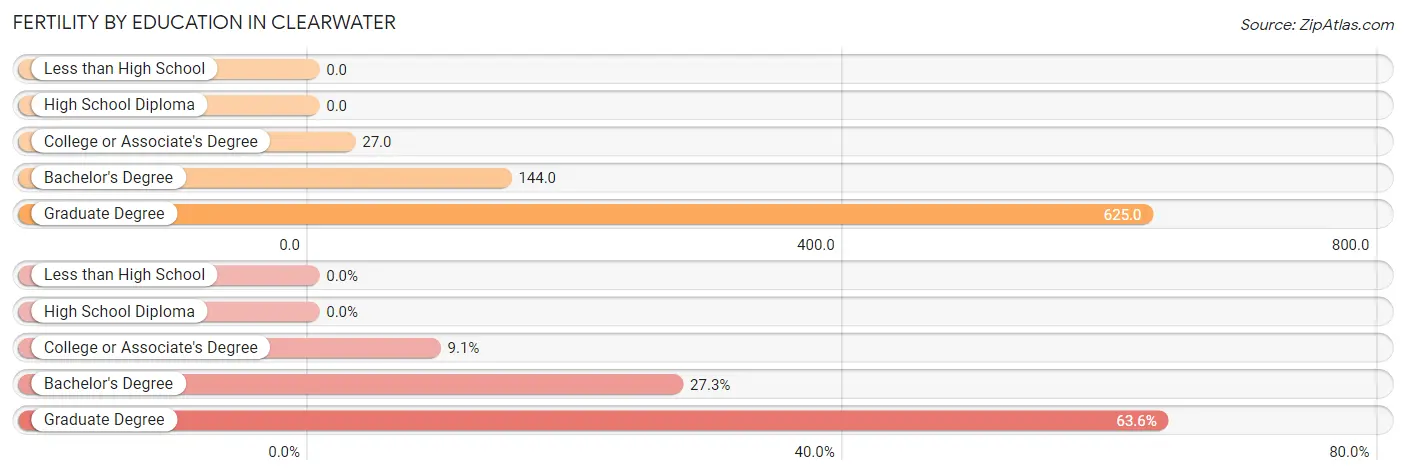
| Educational Attainment | Women with Births | Births / 1,000 Women |
| Less than High School | 0 (0.0%) | 0.0 |
| High School Diploma | 0 (0.0%) | 0.0 |
| College or Associate's Degree | 5 (9.1%) | 27.0 |
| Bachelor's Degree | 15 (27.3%) | 144.0 |
| Graduate Degree | 35 (63.6%) | 625.0 |
| Total | 55 (100.0%) | 105.0 |
Fertility by Education by Marriage Status in Clearwater
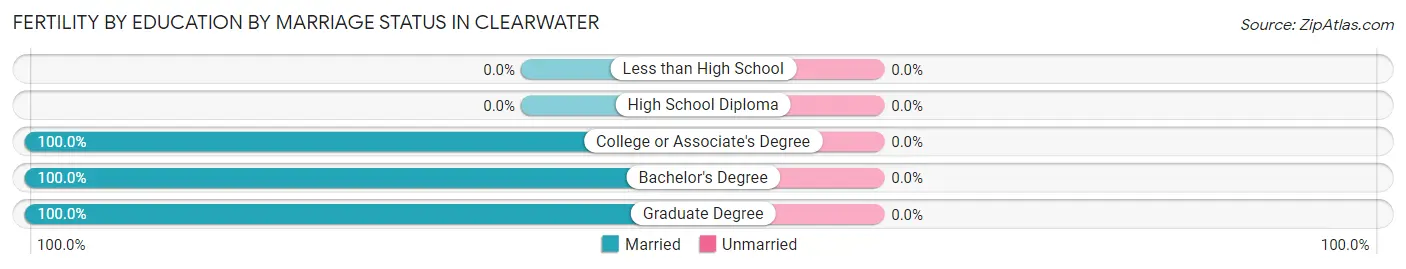
| Educational Attainment | Married | Unmarried |
| Less than High School | 0 (0.0%) | 0 (0.0%) |
| High School Diploma | 0 (0.0%) | 0 (0.0%) |
| College or Associate's Degree | 5 (100.0%) | 0 (0.0%) |
| Bachelor's Degree | 15 (100.0%) | 0 (0.0%) |
| Graduate Degree | 35 (100.0%) | 0 (0.0%) |
| Total | 55 (100.0%) | 0 (0.0%) |
Employment Characteristics in Clearwater
Employment by Class of Employer in Clearwater
Among the 1,135 employed individuals in Clearwater, private company employees (825 | 72.7%), local government employees (71 | 6.3%), and self-employed (incorporated) (69 | 6.1%) make up the most common classes of employment.
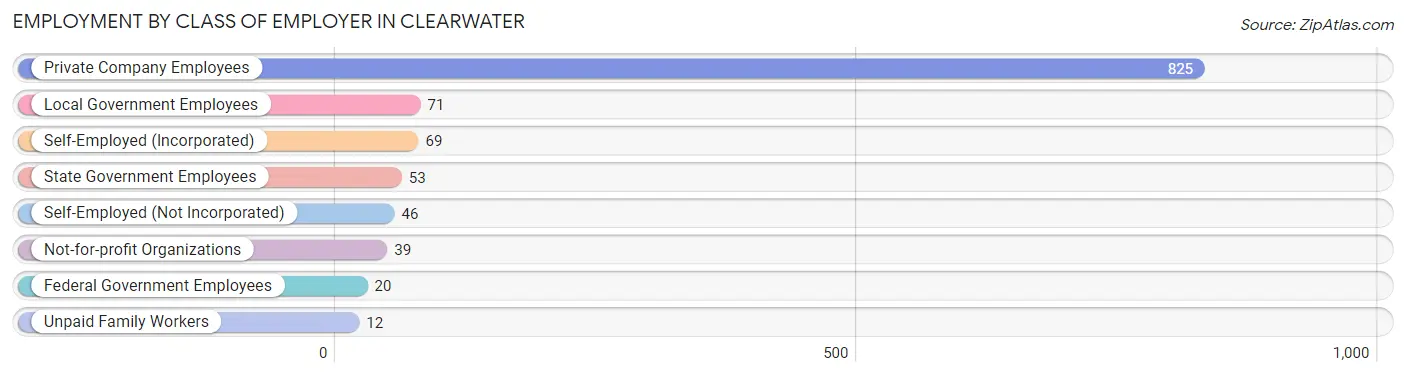
| Employer Class | # Employees | % Employees |
| Private Company Employees | 825 | 72.7% |
| Self-Employed (Incorporated) | 69 | 6.1% |
| Self-Employed (Not Incorporated) | 46 | 4.1% |
| Not-for-profit Organizations | 39 | 3.4% |
| Local Government Employees | 71 | 6.3% |
| State Government Employees | 53 | 4.7% |
| Federal Government Employees | 20 | 1.8% |
| Unpaid Family Workers | 12 | 1.1% |
| Total | 1,135 | 100.0% |
Employment Status by Age in Clearwater
According to the labor force statistics for Clearwater, out of the total population over 16 years of age (1,814), 64.4% or 1,168 individuals are in the labor force, with 2.9% or 34 of them unemployed. The age group with the highest labor force participation rate is 25 to 29 years, with 92.2% or 118 individuals in the labor force. Within the labor force, the 25 to 29 years age range has the highest percentage of unemployed individuals, with 14.4% or 17 of them being unemployed.
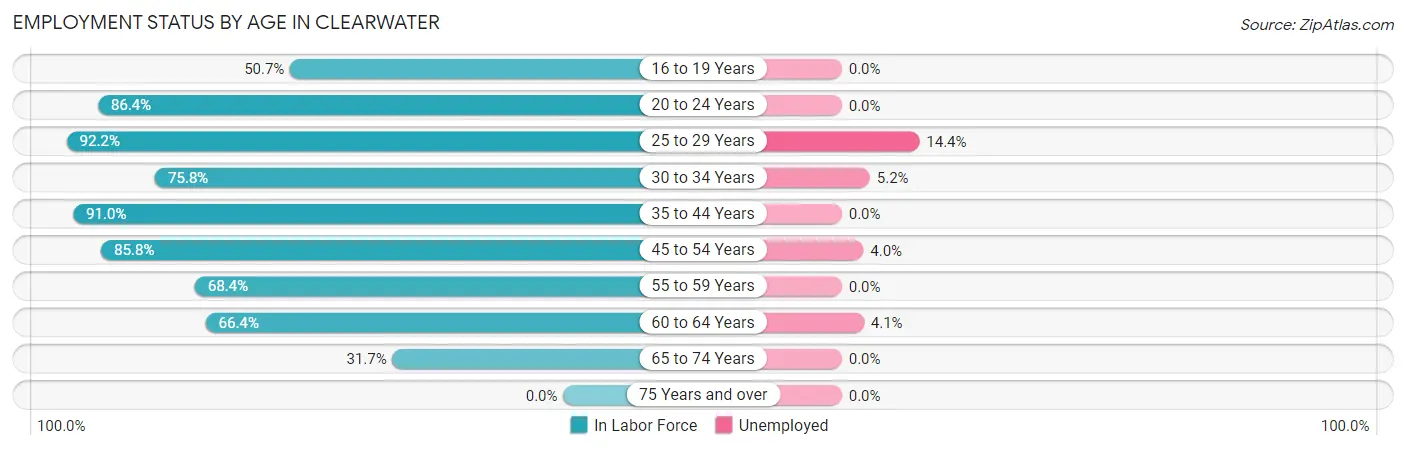
| Age Bracket | In Labor Force | Unemployed |
| 16 to 19 Years | 68 (50.7%) | 0 (0.0%) |
| 20 to 24 Years | 51 (86.4%) | 0 (0.0%) |
| 25 to 29 Years | 118 (92.2%) | 17 (14.4%) |
| 30 to 34 Years | 97 (75.8%) | 5 (5.2%) |
| 35 to 44 Years | 364 (91.0%) | 0 (0.0%) |
| 45 to 54 Years | 151 (85.8%) | 6 (4.0%) |
| 55 to 59 Years | 108 (68.4%) | 0 (0.0%) |
| 60 to 64 Years | 146 (66.4%) | 6 (4.1%) |
| 65 to 74 Years | 66 (31.7%) | 0 (0.0%) |
| 75 Years and over | 0 (0.0%) | 0 (0.0%) |
| Total | 1,168 (64.4%) | 34 (2.9%) |
Employment Status by Educational Attainment in Clearwater
According to labor force statistics for Clearwater, 81.3% of individuals (984) out of the total population between 25 and 64 years of age (1,210) are in the labor force, with 3.5% or 34 of them being unemployed. The group with the highest labor force participation rate are those with the educational attainment of bachelor's degree or higher, with 87.3% or 336 individuals in the labor force. Within the labor force, individuals with high school diploma education have the highest percentage of unemployment, with 10.3% or 28 of them being unemployed.
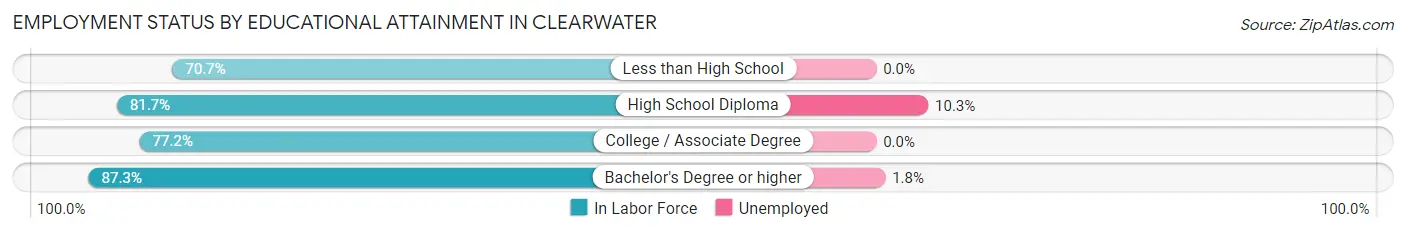
| Educational Attainment | In Labor Force | Unemployed |
| Less than High School | 41 (70.7%) | 0 (0.0%) |
| High School Diploma | 272 (81.7%) | 34 (10.3%) |
| College / Associate Degree | 335 (77.2%) | 0 (0.0%) |
| Bachelor's Degree or higher | 336 (87.3%) | 7 (1.8%) |
| Total | 984 (81.3%) | 42 (3.5%) |
Employment Occupations by Sex in Clearwater
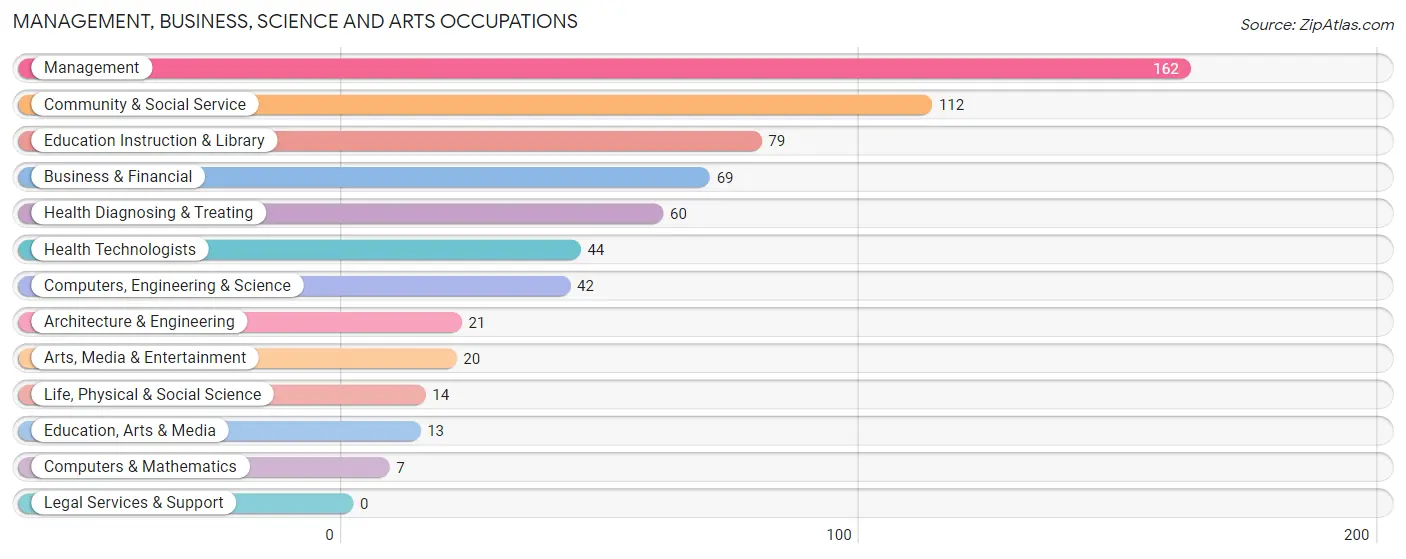
Management, Business, Science and Arts Occupations
The most common Management, Business, Science and Arts occupations in Clearwater are Management (162 | 14.3%), Community & Social Service (112 | 9.9%), Education Instruction & Library (79 | 7.0%), Business & Financial (69 | 6.1%), and Health Diagnosing & Treating (60 | 5.3%).
Management, Business, Science and Arts Occupations by Sex
Within the Management, Business, Science and Arts occupations in Clearwater, the most male-oriented occupations are Architecture & Engineering (100.0%), Life, Physical & Social Science (100.0%), and Computers, Engineering & Science (83.3%), while the most female-oriented occupations are Computers & Mathematics (100.0%), Arts, Media & Entertainment (100.0%), and Health Technologists (88.6%).
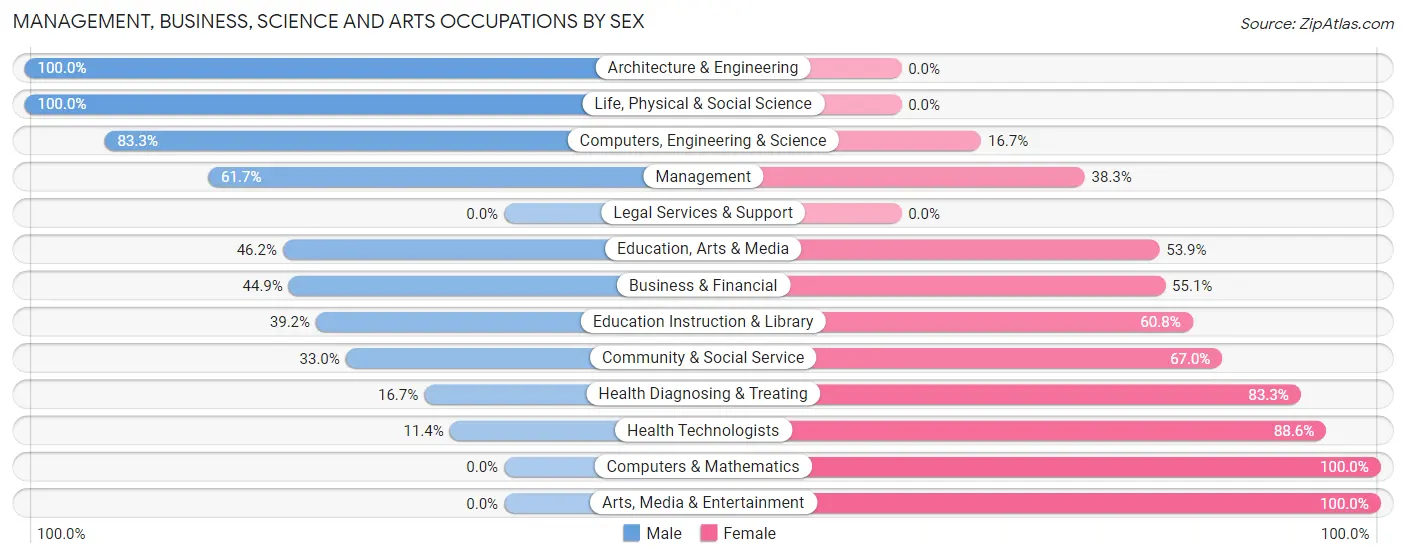
| Occupation | Male | Female |
| Management | 100 (61.7%) | 62 (38.3%) |
| Business & Financial | 31 (44.9%) | 38 (55.1%) |
| Computers, Engineering & Science | 35 (83.3%) | 7 (16.7%) |
| Computers & Mathematics | 0 (0.0%) | 7 (100.0%) |
| Architecture & Engineering | 21 (100.0%) | 0 (0.0%) |
| Life, Physical & Social Science | 14 (100.0%) | 0 (0.0%) |
| Community & Social Service | 37 (33.0%) | 75 (67.0%) |
| Education, Arts & Media | 6 (46.2%) | 7 (53.8%) |
| Legal Services & Support | 0 (0.0%) | 0 (0.0%) |
| Education Instruction & Library | 31 (39.2%) | 48 (60.8%) |
| Arts, Media & Entertainment | 0 (0.0%) | 20 (100.0%) |
| Health Diagnosing & Treating | 10 (16.7%) | 50 (83.3%) |
| Health Technologists | 5 (11.4%) | 39 (88.6%) |
| Total (Category) | 213 (47.9%) | 232 (52.1%) |
| Total (Overall) | 604 (53.5%) | 525 (46.5%) |
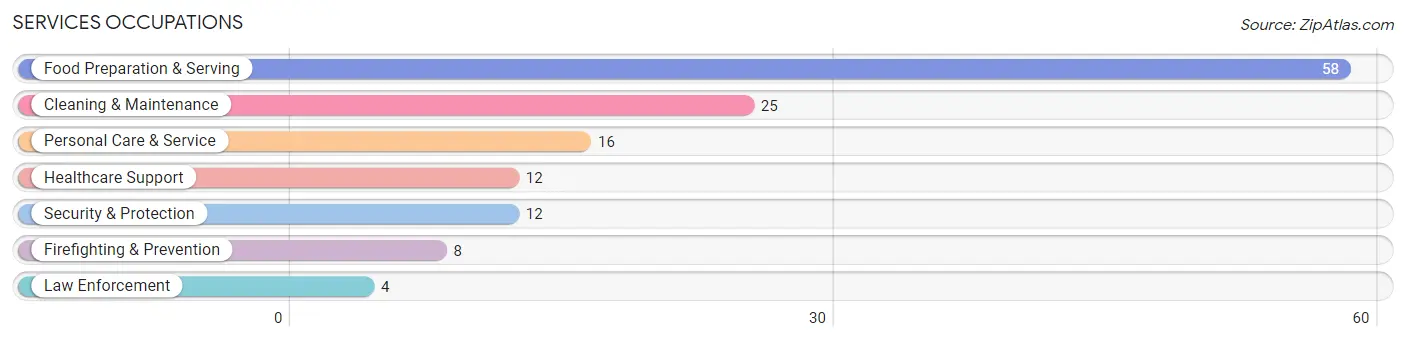
Services Occupations
The most common Services occupations in Clearwater are Food Preparation & Serving (58 | 5.1%), Cleaning & Maintenance (25 | 2.2%), Personal Care & Service (16 | 1.4%), Healthcare Support (12 | 1.1%), and Security & Protection (12 | 1.1%).
Services Occupations by Sex
Within the Services occupations in Clearwater, the most male-oriented occupations are Security & Protection (100.0%), Firefighting & Prevention (100.0%), and Law Enforcement (100.0%), while the most female-oriented occupations are Healthcare Support (100.0%), Personal Care & Service (100.0%), and Food Preparation & Serving (75.9%).
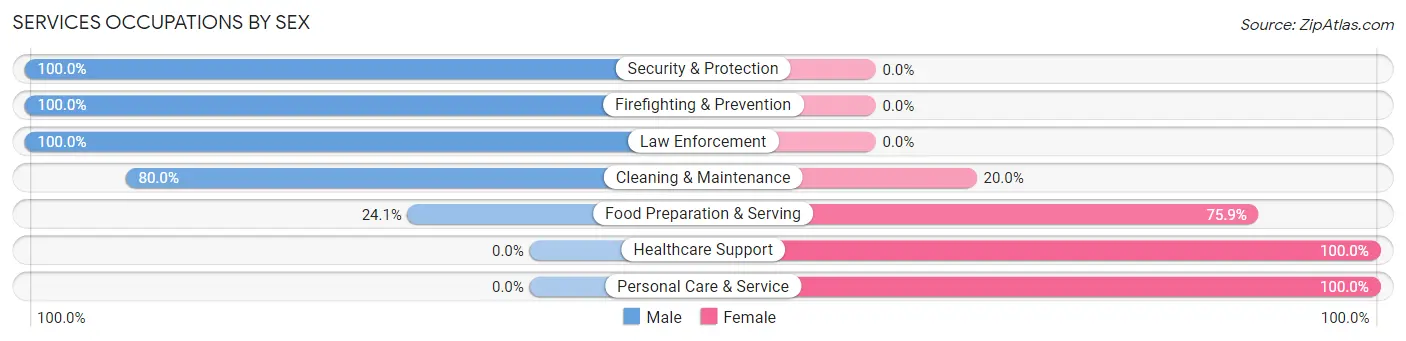
| Occupation | Male | Female |
| Healthcare Support | 0 (0.0%) | 12 (100.0%) |
| Security & Protection | 12 (100.0%) | 0 (0.0%) |
| Firefighting & Prevention | 8 (100.0%) | 0 (0.0%) |
| Law Enforcement | 4 (100.0%) | 0 (0.0%) |
| Food Preparation & Serving | 14 (24.1%) | 44 (75.9%) |
| Cleaning & Maintenance | 20 (80.0%) | 5 (20.0%) |
| Personal Care & Service | 0 (0.0%) | 16 (100.0%) |
| Total (Category) | 46 (37.4%) | 77 (62.6%) |
| Total (Overall) | 604 (53.5%) | 525 (46.5%) |
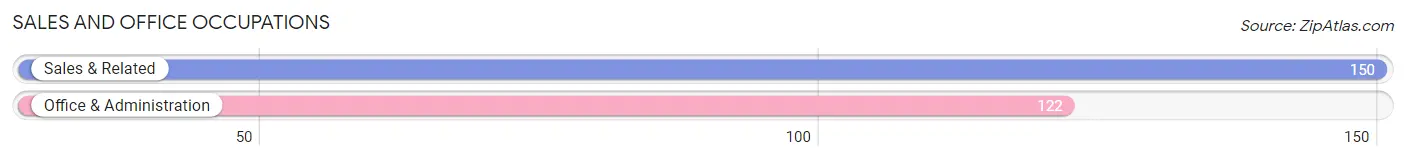
Sales and Office Occupations
The most common Sales and Office occupations in Clearwater are Sales & Related (150 | 13.3%), and Office & Administration (122 | 10.8%).
Sales and Office Occupations by Sex
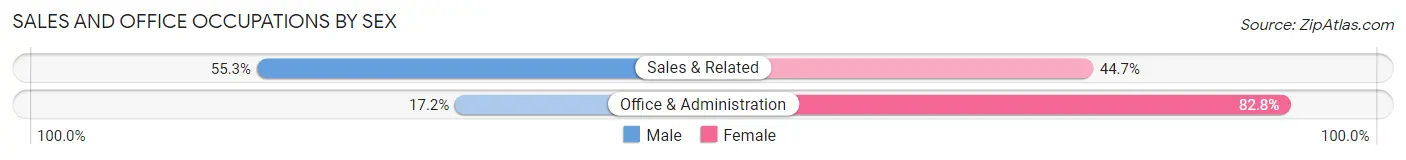
| Occupation | Male | Female |
| Sales & Related | 83 (55.3%) | 67 (44.7%) |
| Office & Administration | 21 (17.2%) | 101 (82.8%) |
| Total (Category) | 104 (38.2%) | 168 (61.8%) |
| Total (Overall) | 604 (53.5%) | 525 (46.5%) |
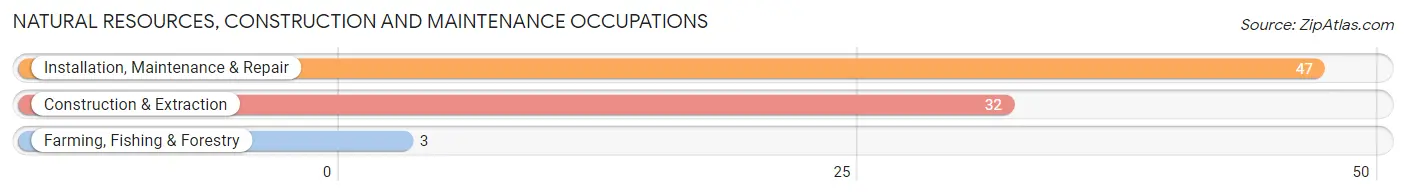
Natural Resources, Construction and Maintenance Occupations
The most common Natural Resources, Construction and Maintenance occupations in Clearwater are Installation, Maintenance & Repair (47 | 4.2%), Construction & Extraction (32 | 2.8%), and Farming, Fishing & Forestry (3 | 0.3%).
Natural Resources, Construction and Maintenance Occupations by Sex
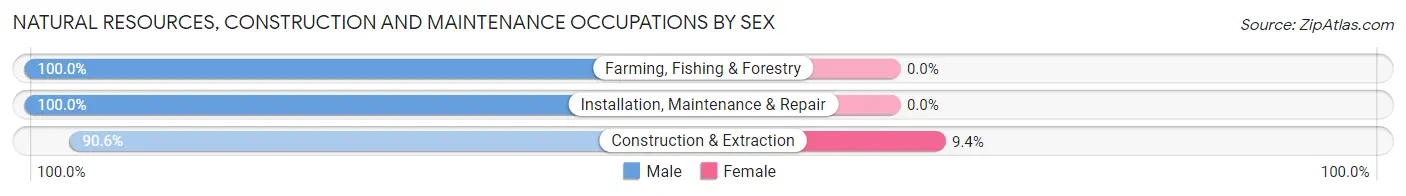
| Occupation | Male | Female |
| Farming, Fishing & Forestry | 3 (100.0%) | 0 (0.0%) |
| Construction & Extraction | 29 (90.6%) | 3 (9.4%) |
| Installation, Maintenance & Repair | 47 (100.0%) | 0 (0.0%) |
| Total (Category) | 79 (96.3%) | 3 (3.7%) |
| Total (Overall) | 604 (53.5%) | 525 (46.5%) |
Production, Transportation and Moving Occupations
The most common Production, Transportation and Moving occupations in Clearwater are Production (96 | 8.5%), Transportation (77 | 6.8%), and Material Moving (34 | 3.0%).
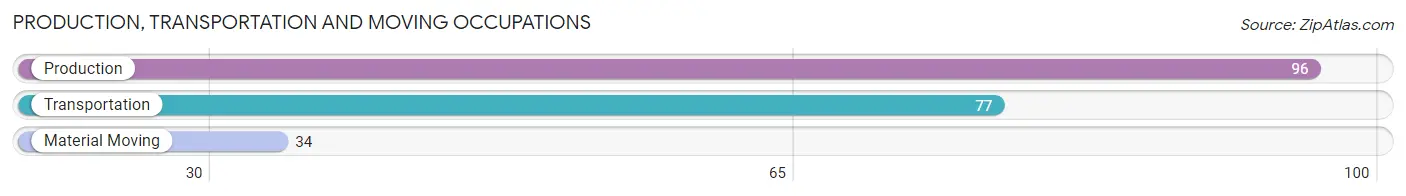
Production, Transportation and Moving Occupations by Sex
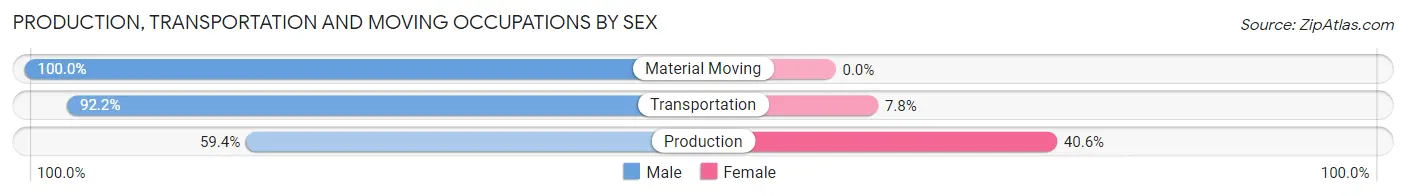
| Occupation | Male | Female |
| Production | 57 (59.4%) | 39 (40.6%) |
| Transportation | 71 (92.2%) | 6 (7.8%) |
| Material Moving | 34 (100.0%) | 0 (0.0%) |
| Total (Category) | 162 (78.3%) | 45 (21.7%) |
| Total (Overall) | 604 (53.5%) | 525 (46.5%) |
Employment Industries by Sex in Clearwater
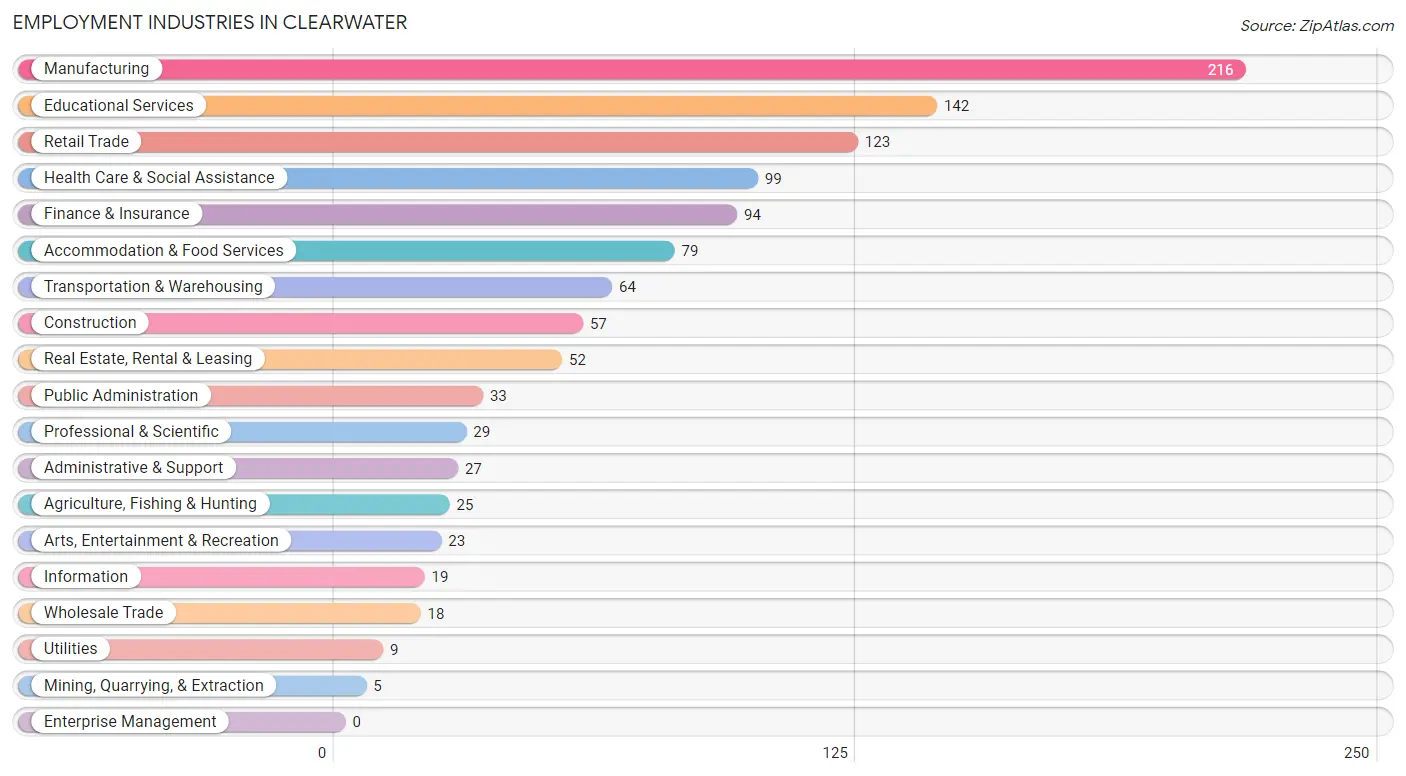
Employment Industries in Clearwater
The major employment industries in Clearwater include Manufacturing (216 | 19.1%), Educational Services (142 | 12.6%), Retail Trade (123 | 10.9%), Health Care & Social Assistance (99 | 8.8%), and Finance & Insurance (94 | 8.3%).
Employment Industries by Sex in Clearwater
The Clearwater industries that see more men than women are Agriculture, Fishing & Hunting (100.0%), Mining, Quarrying, & Extraction (100.0%), and Construction (94.7%), whereas the industries that tend to have a higher number of women are Information (100.0%), Professional & Scientific (100.0%), and Health Care & Social Assistance (84.9%).
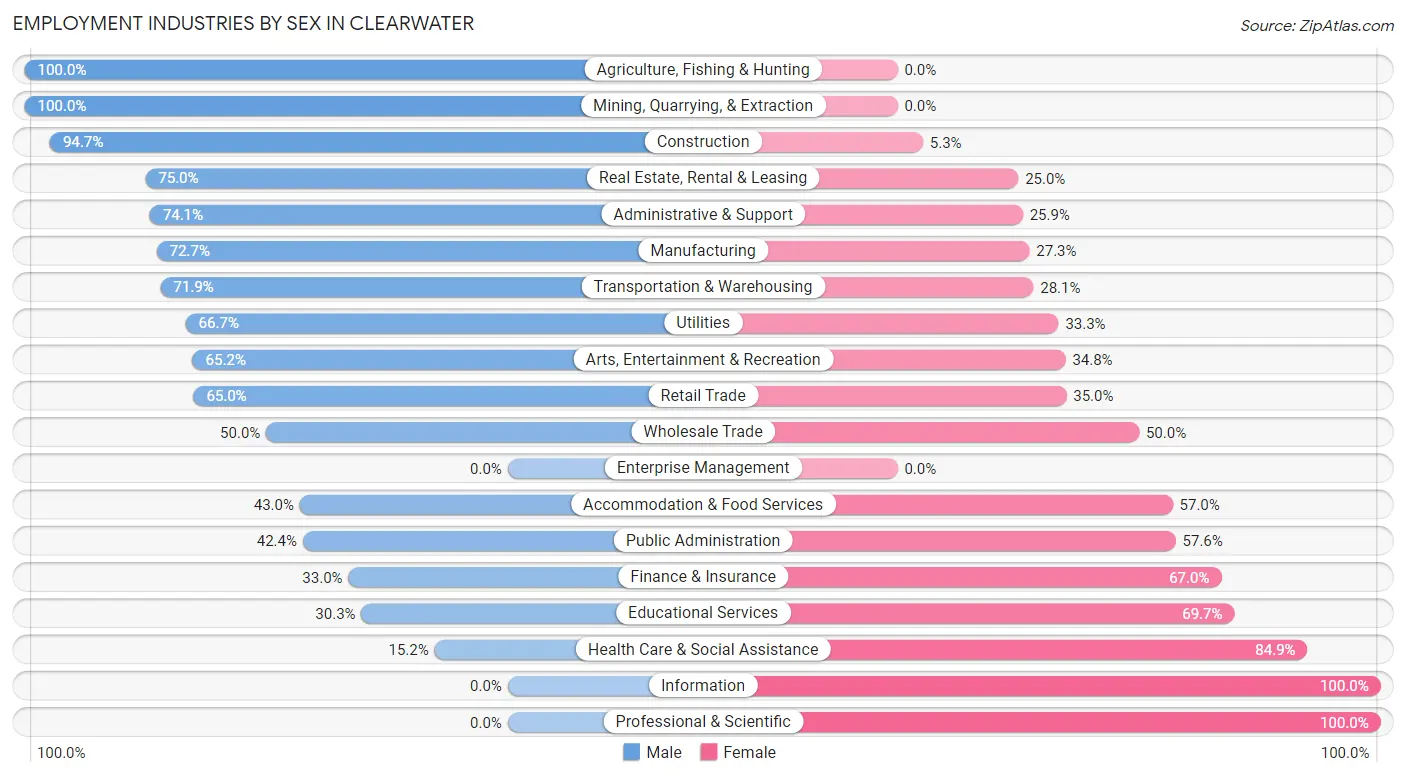
| Industry | Male | Female |
| Agriculture, Fishing & Hunting | 25 (100.0%) | 0 (0.0%) |
| Mining, Quarrying, & Extraction | 5 (100.0%) | 0 (0.0%) |
| Construction | 54 (94.7%) | 3 (5.3%) |
| Manufacturing | 157 (72.7%) | 59 (27.3%) |
| Wholesale Trade | 9 (50.0%) | 9 (50.0%) |
| Retail Trade | 80 (65.0%) | 43 (35.0%) |
| Transportation & Warehousing | 46 (71.9%) | 18 (28.1%) |
| Utilities | 6 (66.7%) | 3 (33.3%) |
| Information | 0 (0.0%) | 19 (100.0%) |
| Finance & Insurance | 31 (33.0%) | 63 (67.0%) |
| Real Estate, Rental & Leasing | 39 (75.0%) | 13 (25.0%) |
| Professional & Scientific | 0 (0.0%) | 29 (100.0%) |
| Enterprise Management | 0 (0.0%) | 0 (0.0%) |
| Administrative & Support | 20 (74.1%) | 7 (25.9%) |
| Educational Services | 43 (30.3%) | 99 (69.7%) |
| Health Care & Social Assistance | 15 (15.1%) | 84 (84.9%) |
| Arts, Entertainment & Recreation | 15 (65.2%) | 8 (34.8%) |
| Accommodation & Food Services | 34 (43.0%) | 45 (57.0%) |
| Public Administration | 14 (42.4%) | 19 (57.6%) |
| Total | 604 (53.5%) | 525 (46.5%) |
Education in Clearwater
School Enrollment in Clearwater
The most common levels of schooling among the 755 students in Clearwater are elementary school (179 | 23.7%), high school (176 | 23.3%), and middle school (150 | 19.9%).
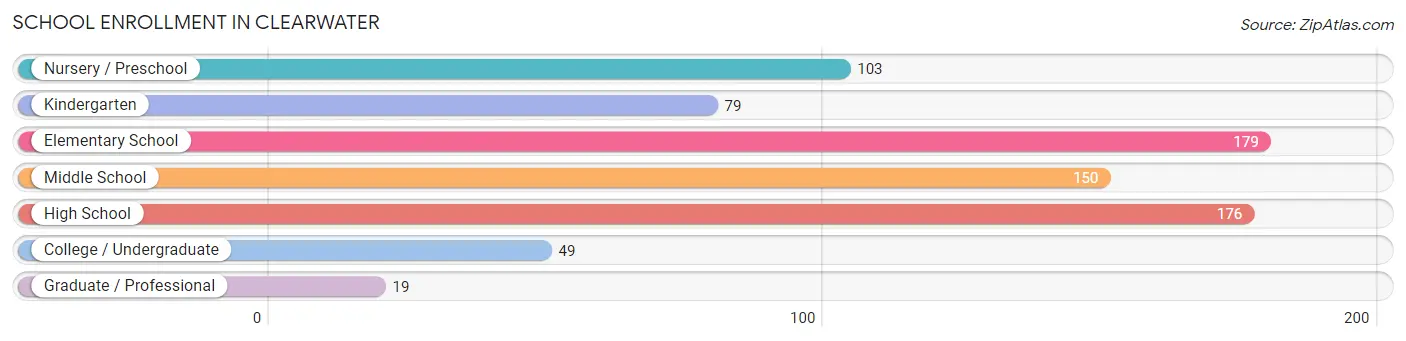
| School Level | # Students | % Students |
| Nursery / Preschool | 103 | 13.6% |
| Kindergarten | 79 | 10.5% |
| Elementary School | 179 | 23.7% |
| Middle School | 150 | 19.9% |
| High School | 176 | 23.3% |
| College / Undergraduate | 49 | 6.5% |
| Graduate / Professional | 19 | 2.5% |
| Total | 755 | 100.0% |
School Enrollment by Age by Funding Source in Clearwater
Out of a total of 755 students who are enrolled in schools in Clearwater, 93 (12.3%) attend a private institution, while the remaining 662 (87.7%) are enrolled in public schools. The age group of 35 years and over has the highest likelihood of being enrolled in private schools, with 16 (76.2% in the age bracket) enrolled. Conversely, the age group of 18 to 19 year olds has the lowest likelihood of being enrolled in a private school, with 54 (100.0% in the age bracket) attending a public institution.
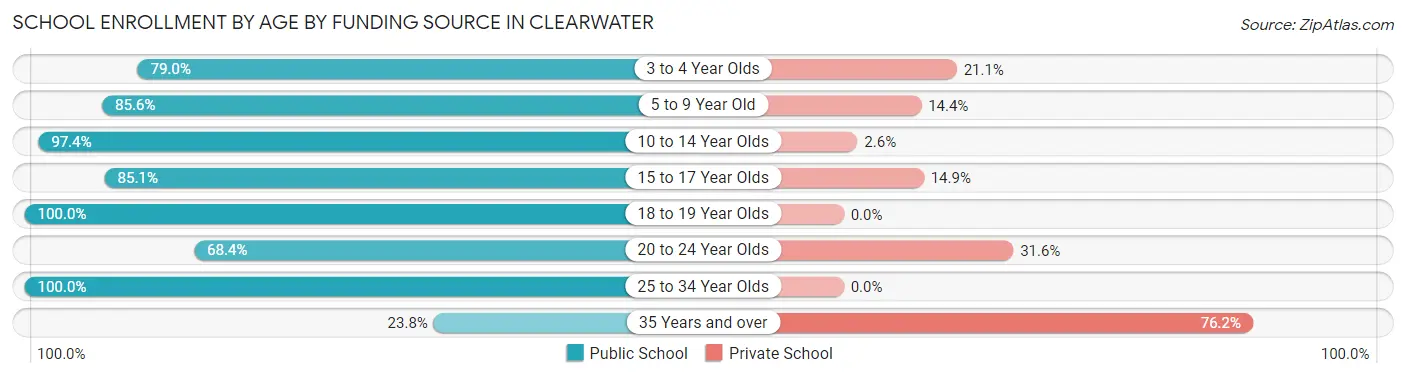
| Age Bracket | Public School | Private School |
| 3 to 4 Year Olds | 30 (78.9%) | 8 (21.0%) |
| 5 to 9 Year Old | 243 (85.6%) | 41 (14.4%) |
| 10 to 14 Year Olds | 190 (97.4%) | 5 (2.6%) |
| 15 to 17 Year Olds | 97 (85.1%) | 17 (14.9%) |
| 18 to 19 Year Olds | 54 (100.0%) | 0 (0.0%) |
| 20 to 24 Year Olds | 13 (68.4%) | 6 (31.6%) |
| 25 to 34 Year Olds | 30 (100.0%) | 0 (0.0%) |
| 35 Years and over | 5 (23.8%) | 16 (76.2%) |
| Total | 662 (87.7%) | 93 (12.3%) |
Educational Attainment by Field of Study in Clearwater
Business (145 | 29.5%), education (81 | 16.5%), bio, nature & agricultural (67 | 13.6%), science & technology (53 | 10.8%), and engineering (49 | 10.0%) are the most common fields of study among 492 individuals in Clearwater who have obtained a bachelor's degree or higher.
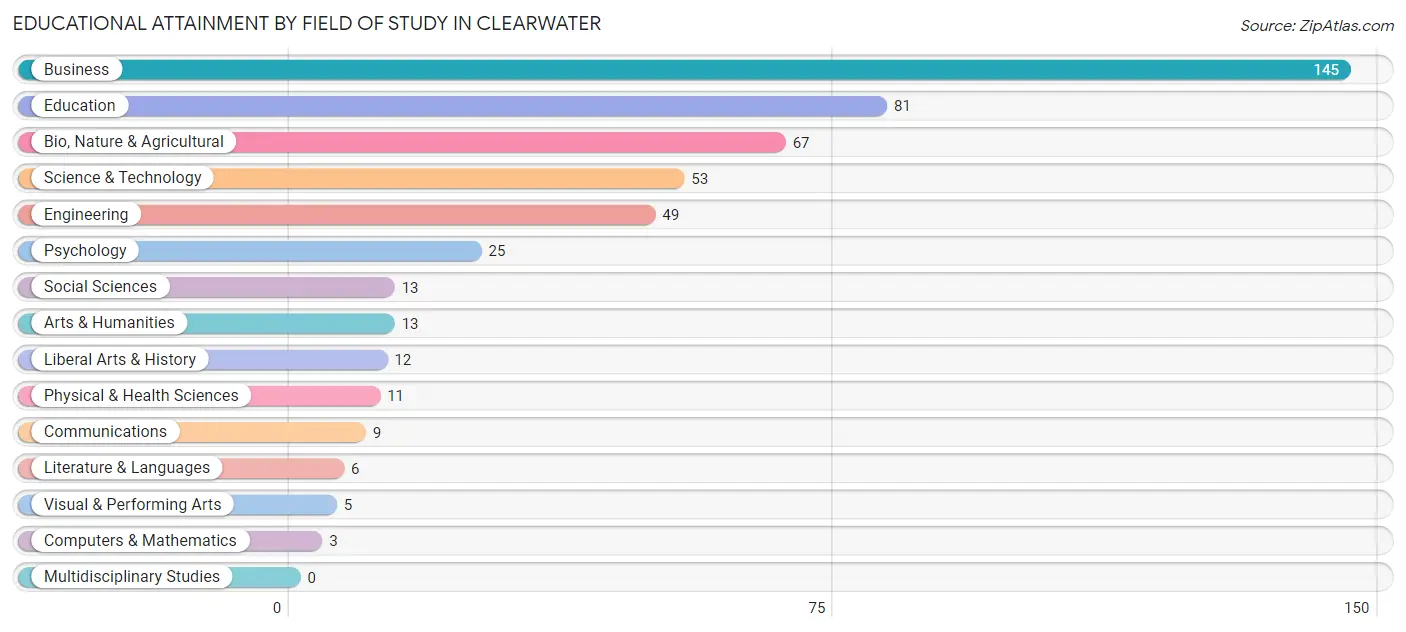
| Field of Study | # Graduates | % Graduates |
| Computers & Mathematics | 3 | 0.6% |
| Bio, Nature & Agricultural | 67 | 13.6% |
| Physical & Health Sciences | 11 | 2.2% |
| Psychology | 25 | 5.1% |
| Social Sciences | 13 | 2.6% |
| Engineering | 49 | 10.0% |
| Multidisciplinary Studies | 0 | 0.0% |
| Science & Technology | 53 | 10.8% |
| Business | 145 | 29.5% |
| Education | 81 | 16.5% |
| Literature & Languages | 6 | 1.2% |
| Liberal Arts & History | 12 | 2.4% |
| Visual & Performing Arts | 5 | 1.0% |
| Communications | 9 | 1.8% |
| Arts & Humanities | 13 | 2.6% |
| Total | 492 | 100.0% |
Transportation & Commute in Clearwater
Vehicle Availability by Sex in Clearwater
The most prevalent vehicle ownership categories in Clearwater are males with 2 vehicles (226, accounting for 37.4%) and females with 2 vehicles (259, making up 42.6%).
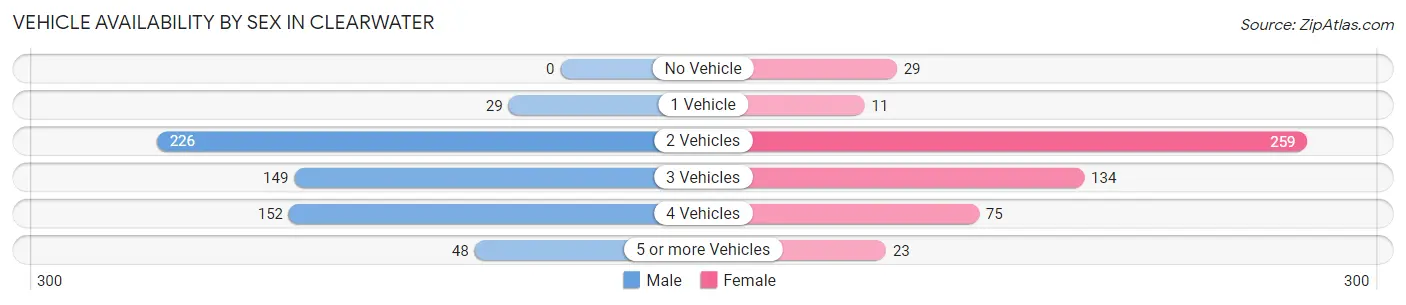
| Vehicles Available | Male | Female |
| No Vehicle | 0 (0.0%) | 29 (5.5%) |
| 1 Vehicle | 29 (4.8%) | 11 (2.1%) |
| 2 Vehicles | 226 (37.4%) | 259 (48.8%) |
| 3 Vehicles | 149 (24.7%) | 134 (25.2%) |
| 4 Vehicles | 152 (25.2%) | 75 (14.1%) |
| 5 or more Vehicles | 48 (8.0%) | 23 (4.3%) |
| Total | 604 (100.0%) | 531 (100.0%) |
Commute Time in Clearwater
The most frequently occuring commute durations in Clearwater are 30 to 34 minutes (229 commuters, 21.7%), 20 to 24 minutes (180 commuters, 17.1%), and 15 to 19 minutes (138 commuters, 13.1%).
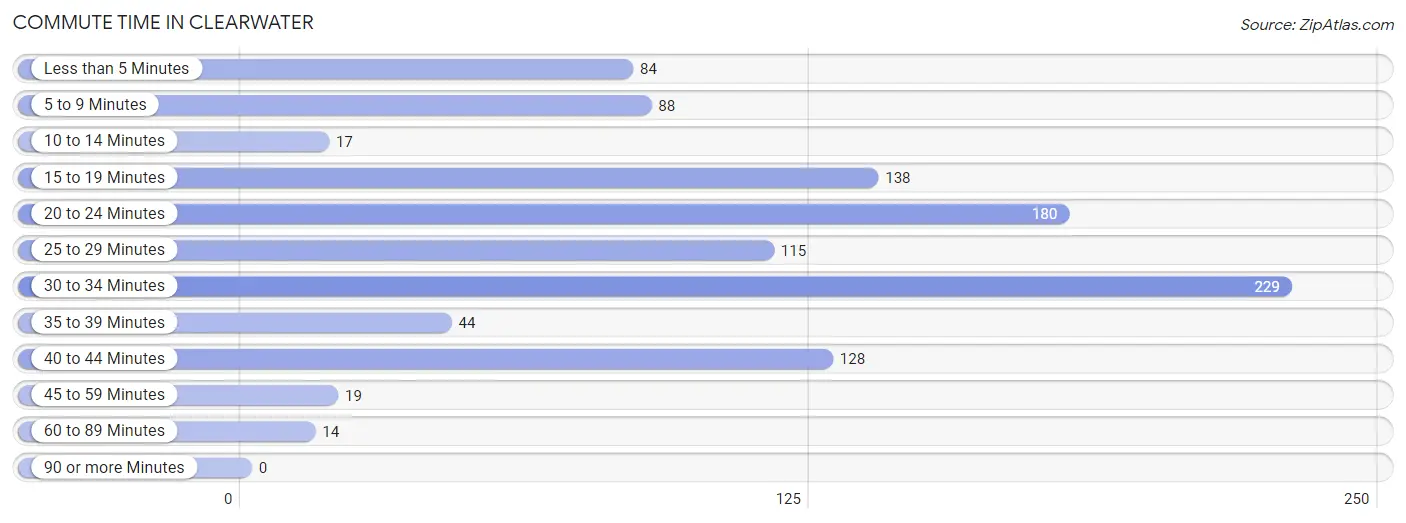
| Commute Time | # Commuters | % Commuters |
| Less than 5 Minutes | 84 | 8.0% |
| 5 to 9 Minutes | 88 | 8.3% |
| 10 to 14 Minutes | 17 | 1.6% |
| 15 to 19 Minutes | 138 | 13.1% |
| 20 to 24 Minutes | 180 | 17.1% |
| 25 to 29 Minutes | 115 | 10.9% |
| 30 to 34 Minutes | 229 | 21.7% |
| 35 to 39 Minutes | 44 | 4.2% |
| 40 to 44 Minutes | 128 | 12.1% |
| 45 to 59 Minutes | 19 | 1.8% |
| 60 to 89 Minutes | 14 | 1.3% |
| 90 or more Minutes | 0 | 0.0% |
Commute Time by Sex in Clearwater
The most common commute times in Clearwater are 30 to 34 minutes (161 commuters, 28.0%) for males and 20 to 24 minutes (98 commuters, 20.4%) for females.
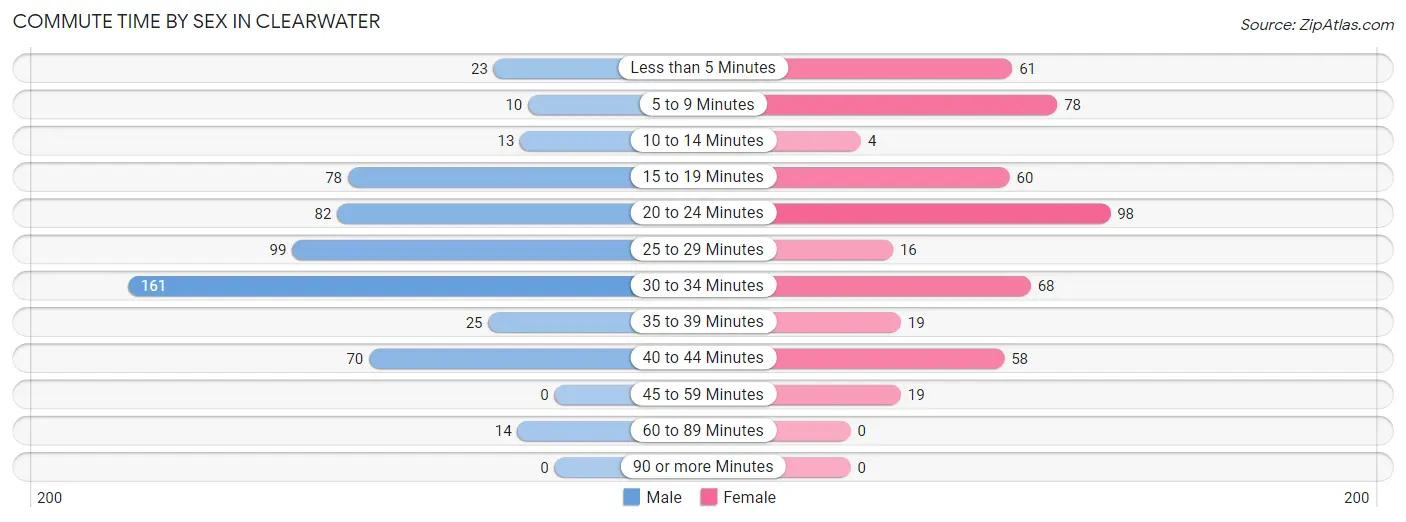
| Commute Time | Male | Female |
| Less than 5 Minutes | 23 (4.0%) | 61 (12.7%) |
| 5 to 9 Minutes | 10 (1.7%) | 78 (16.2%) |
| 10 to 14 Minutes | 13 (2.3%) | 4 (0.8%) |
| 15 to 19 Minutes | 78 (13.6%) | 60 (12.5%) |
| 20 to 24 Minutes | 82 (14.3%) | 98 (20.4%) |
| 25 to 29 Minutes | 99 (17.2%) | 16 (3.3%) |
| 30 to 34 Minutes | 161 (28.0%) | 68 (14.1%) |
| 35 to 39 Minutes | 25 (4.3%) | 19 (4.0%) |
| 40 to 44 Minutes | 70 (12.2%) | 58 (12.1%) |
| 45 to 59 Minutes | 0 (0.0%) | 19 (4.0%) |
| 60 to 89 Minutes | 14 (2.4%) | 0 (0.0%) |
| 90 or more Minutes | 0 (0.0%) | 0 (0.0%) |
Time of Departure to Work by Sex in Clearwater
The most frequent times of departure to work in Clearwater are 8:00 AM to 8:29 AM (88, 15.3%) for males and 8:00 AM to 8:29 AM (142, 29.5%) for females.
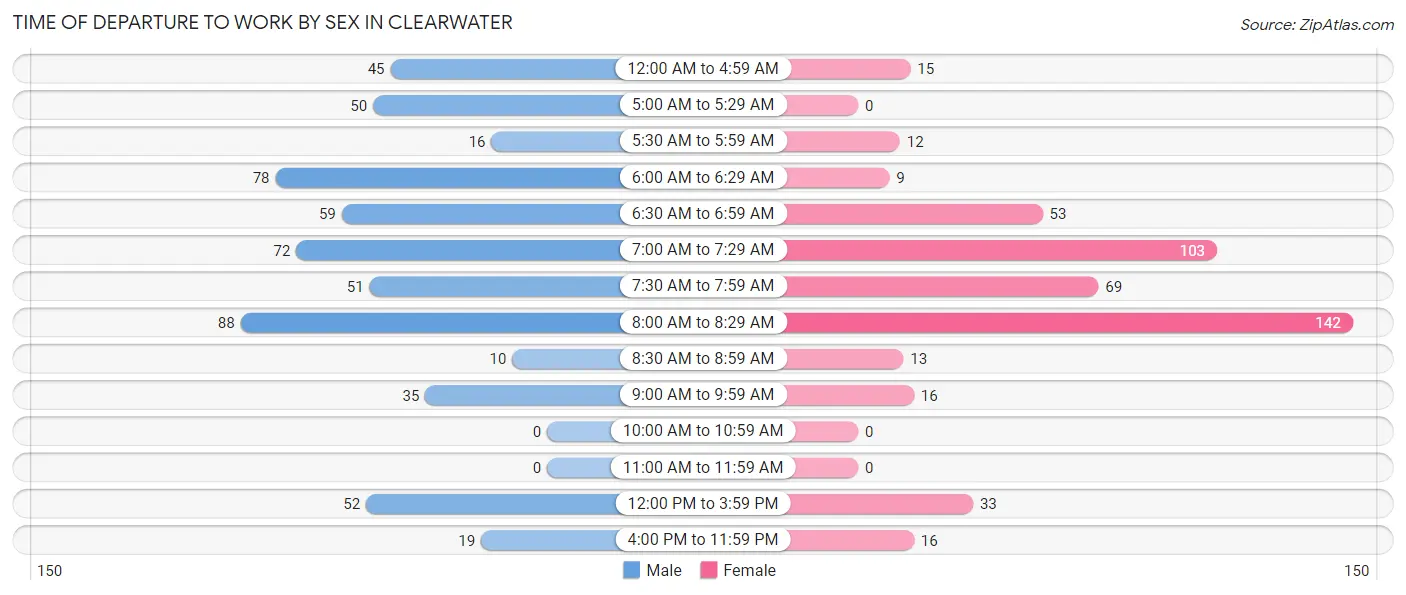
| Time of Departure | Male | Female |
| 12:00 AM to 4:59 AM | 45 (7.8%) | 15 (3.1%) |
| 5:00 AM to 5:29 AM | 50 (8.7%) | 0 (0.0%) |
| 5:30 AM to 5:59 AM | 16 (2.8%) | 12 (2.5%) |
| 6:00 AM to 6:29 AM | 78 (13.6%) | 9 (1.9%) |
| 6:30 AM to 6:59 AM | 59 (10.3%) | 53 (11.0%) |
| 7:00 AM to 7:29 AM | 72 (12.5%) | 103 (21.4%) |
| 7:30 AM to 7:59 AM | 51 (8.9%) | 69 (14.3%) |
| 8:00 AM to 8:29 AM | 88 (15.3%) | 142 (29.5%) |
| 8:30 AM to 8:59 AM | 10 (1.7%) | 13 (2.7%) |
| 9:00 AM to 9:59 AM | 35 (6.1%) | 16 (3.3%) |
| 10:00 AM to 10:59 AM | 0 (0.0%) | 0 (0.0%) |
| 11:00 AM to 11:59 AM | 0 (0.0%) | 0 (0.0%) |
| 12:00 PM to 3:59 PM | 52 (9.0%) | 33 (6.9%) |
| 4:00 PM to 11:59 PM | 19 (3.3%) | 16 (3.3%) |
| Total | 575 (100.0%) | 481 (100.0%) |
Housing Occupancy in Clearwater
Occupancy by Ownership in Clearwater
Of the total 830 dwellings in Clearwater, owner-occupied units account for 608 (73.3%), while renter-occupied units make up 222 (26.8%).
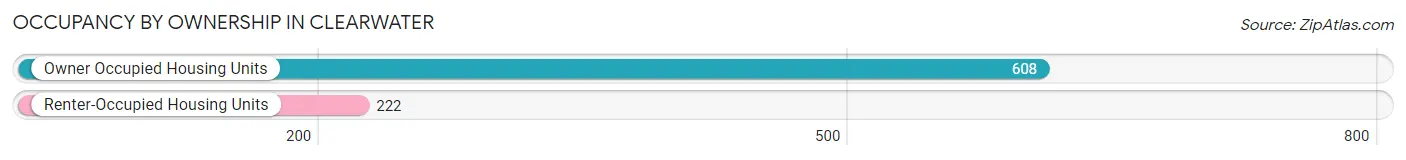
| Occupancy | # Housing Units | % Housing Units |
| Owner Occupied Housing Units | 608 | 73.3% |
| Renter-Occupied Housing Units | 222 | 26.8% |
| Total Occupied Housing Units | 830 | 100.0% |
Occupancy by Household Size in Clearwater
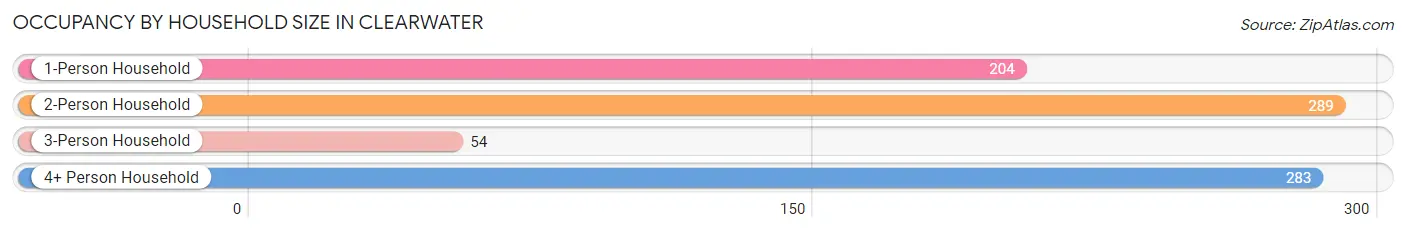
| Household Size | # Housing Units | % Housing Units |
| 1-Person Household | 204 | 24.6% |
| 2-Person Household | 289 | 34.8% |
| 3-Person Household | 54 | 6.5% |
| 4+ Person Household | 283 | 34.1% |
| Total Housing Units | 830 | 100.0% |
Occupancy by Ownership by Household Size in Clearwater
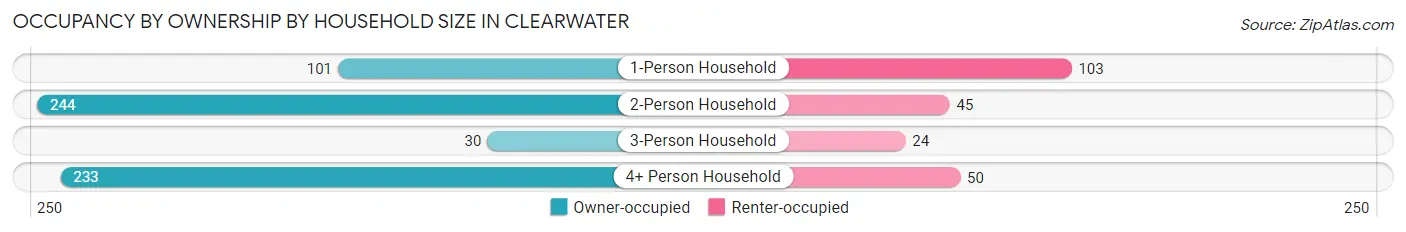
| Household Size | Owner-occupied | Renter-occupied |
| 1-Person Household | 101 (49.5%) | 103 (50.5%) |
| 2-Person Household | 244 (84.4%) | 45 (15.6%) |
| 3-Person Household | 30 (55.6%) | 24 (44.4%) |
| 4+ Person Household | 233 (82.3%) | 50 (17.7%) |
| Total Housing Units | 608 (73.3%) | 222 (26.8%) |
Occupancy by Educational Attainment in Clearwater
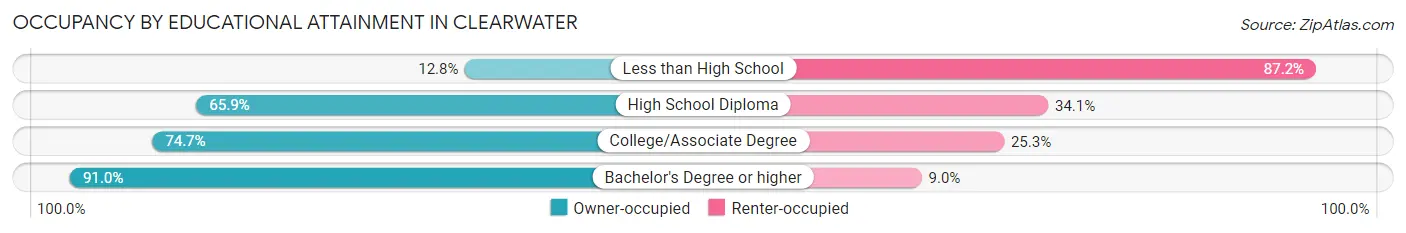
| Household Size | Owner-occupied | Renter-occupied |
| Less than High School | 5 (12.8%) | 34 (87.2%) |
| High School Diploma | 180 (65.9%) | 93 (34.1%) |
| College/Associate Degree | 221 (74.7%) | 75 (25.3%) |
| Bachelor's Degree or higher | 202 (91.0%) | 20 (9.0%) |
Occupancy by Age of Householder in Clearwater
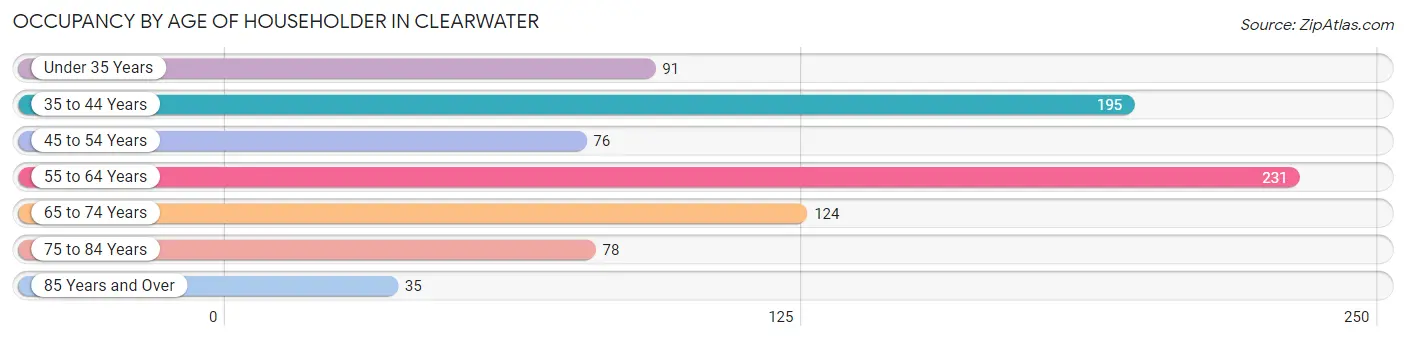
| Age Bracket | # Households | % Households |
| Under 35 Years | 91 | 11.0% |
| 35 to 44 Years | 195 | 23.5% |
| 45 to 54 Years | 76 | 9.2% |
| 55 to 64 Years | 231 | 27.8% |
| 65 to 74 Years | 124 | 14.9% |
| 75 to 84 Years | 78 | 9.4% |
| 85 Years and Over | 35 | 4.2% |
| Total | 830 | 100.0% |
Housing Finances in Clearwater
Median Income by Occupancy in Clearwater
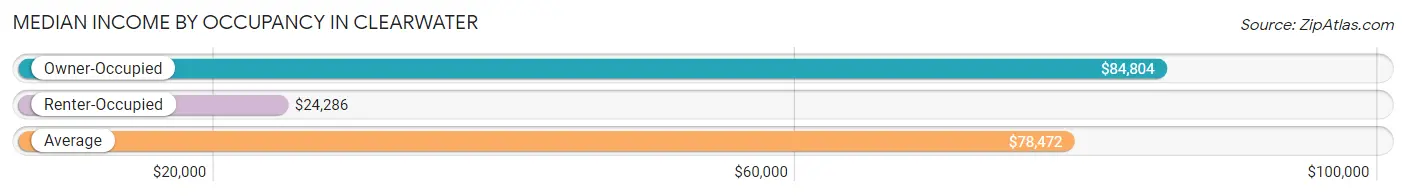
| Occupancy Type | # Households | Median Income |
| Owner-Occupied | 608 (73.3%) | $84,804 |
| Renter-Occupied | 222 (26.8%) | $24,286 |
| Average | 830 (100.0%) | $78,472 |
Occupancy by Householder Income Bracket in Clearwater
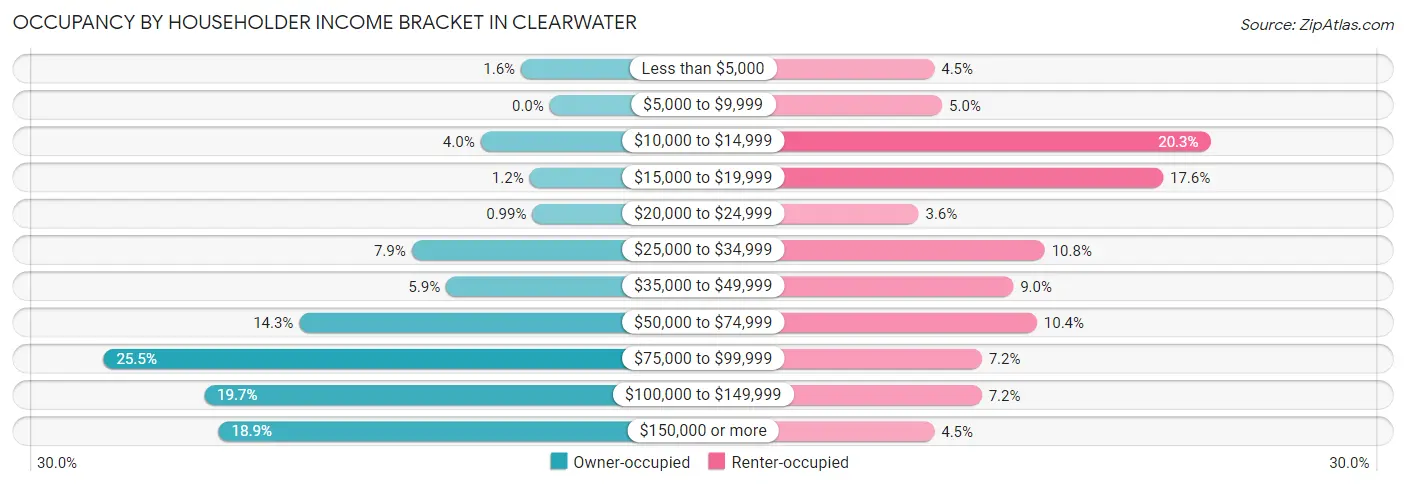
| Income Bracket | Owner-occupied | Renter-occupied |
| Less than $5,000 | 10 (1.6%) | 10 (4.5%) |
| $5,000 to $9,999 | 0 (0.0%) | 11 (5.0%) |
| $10,000 to $14,999 | 24 (4.0%) | 45 (20.3%) |
| $15,000 to $19,999 | 7 (1.1%) | 39 (17.6%) |
| $20,000 to $24,999 | 6 (1.0%) | 8 (3.6%) |
| $25,000 to $34,999 | 48 (7.9%) | 24 (10.8%) |
| $35,000 to $49,999 | 36 (5.9%) | 20 (9.0%) |
| $50,000 to $74,999 | 87 (14.3%) | 23 (10.4%) |
| $75,000 to $99,999 | 155 (25.5%) | 16 (7.2%) |
| $100,000 to $149,999 | 120 (19.7%) | 16 (7.2%) |
| $150,000 or more | 115 (18.9%) | 10 (4.5%) |
| Total | 608 (100.0%) | 222 (100.0%) |
Monthly Housing Cost Tiers in Clearwater
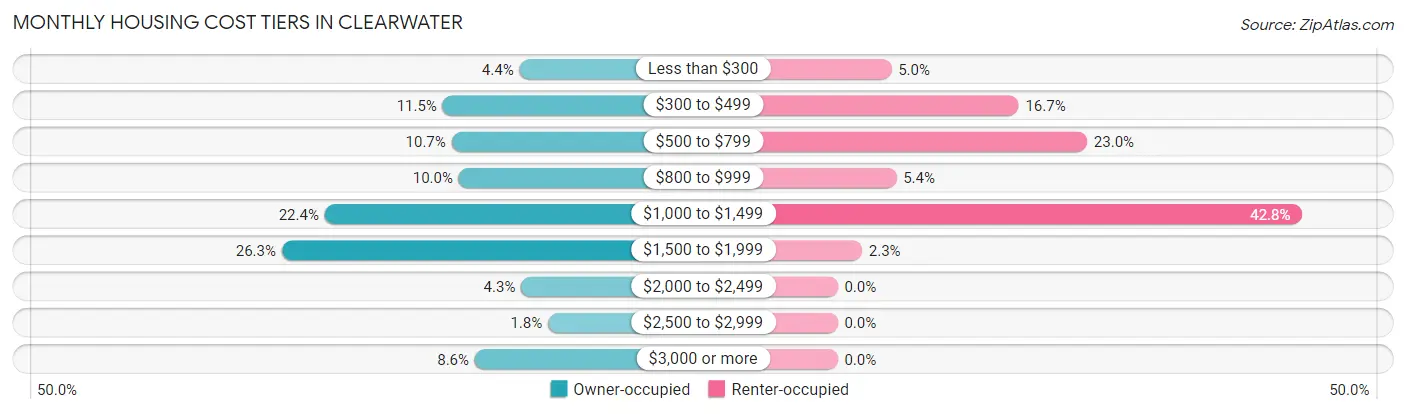
| Monthly Cost | Owner-occupied | Renter-occupied |
| Less than $300 | 27 (4.4%) | 11 (5.0%) |
| $300 to $499 | 70 (11.5%) | 37 (16.7%) |
| $500 to $799 | 65 (10.7%) | 51 (23.0%) |
| $800 to $999 | 61 (10.0%) | 12 (5.4%) |
| $1,000 to $1,499 | 136 (22.4%) | 95 (42.8%) |
| $1,500 to $1,999 | 160 (26.3%) | 5 (2.2%) |
| $2,000 to $2,499 | 26 (4.3%) | 0 (0.0%) |
| $2,500 to $2,999 | 11 (1.8%) | 0 (0.0%) |
| $3,000 or more | 52 (8.6%) | 0 (0.0%) |
| Total | 608 (100.0%) | 222 (100.0%) |
Physical Housing Characteristics in Clearwater
Housing Structures in Clearwater
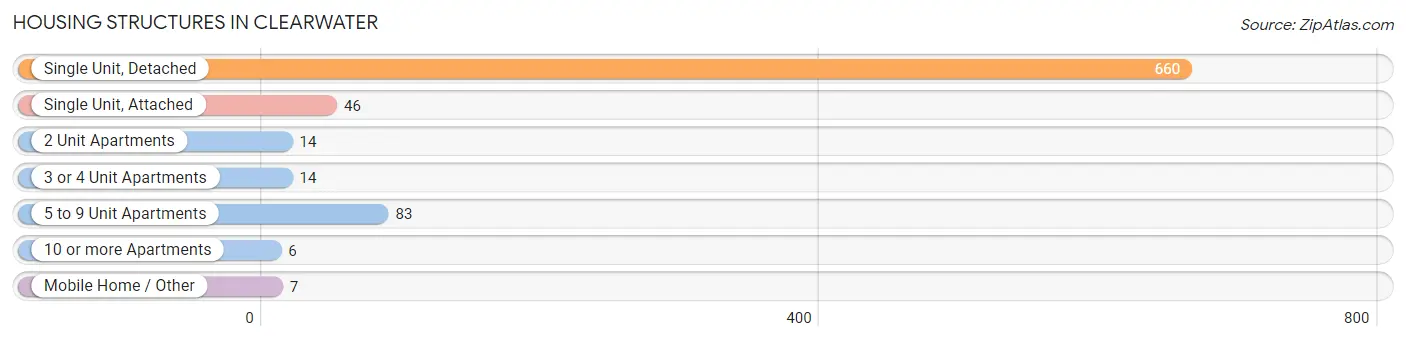
| Structure Type | # Housing Units | % Housing Units |
| Single Unit, Detached | 660 | 79.5% |
| Single Unit, Attached | 46 | 5.5% |
| 2 Unit Apartments | 14 | 1.7% |
| 3 or 4 Unit Apartments | 14 | 1.7% |
| 5 to 9 Unit Apartments | 83 | 10.0% |
| 10 or more Apartments | 6 | 0.7% |
| Mobile Home / Other | 7 | 0.8% |
| Total | 830 | 100.0% |
Housing Structures by Occupancy in Clearwater
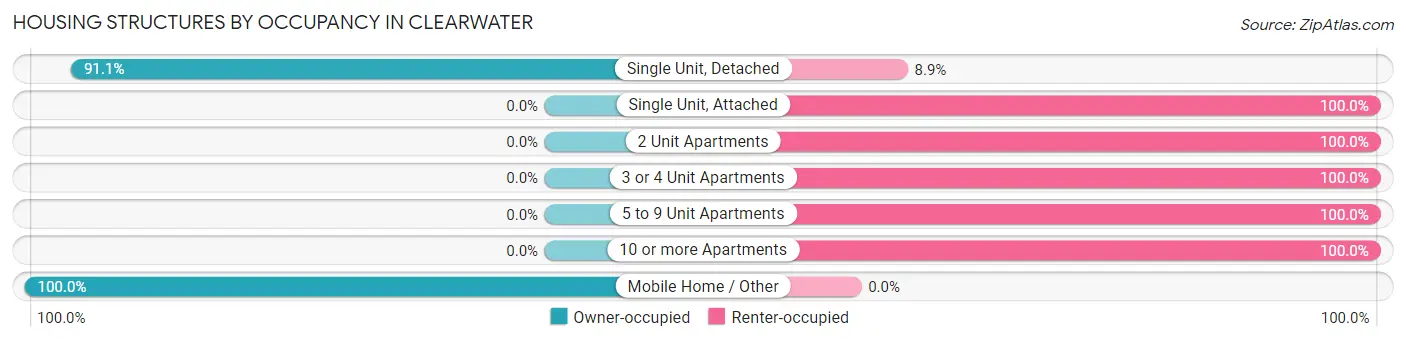
| Structure Type | Owner-occupied | Renter-occupied |
| Single Unit, Detached | 601 (91.1%) | 59 (8.9%) |
| Single Unit, Attached | 0 (0.0%) | 46 (100.0%) |
| 2 Unit Apartments | 0 (0.0%) | 14 (100.0%) |
| 3 or 4 Unit Apartments | 0 (0.0%) | 14 (100.0%) |
| 5 to 9 Unit Apartments | 0 (0.0%) | 83 (100.0%) |
| 10 or more Apartments | 0 (0.0%) | 6 (100.0%) |
| Mobile Home / Other | 7 (100.0%) | 0 (0.0%) |
| Total | 608 (73.3%) | 222 (26.8%) |
Housing Structures by Number of Rooms in Clearwater
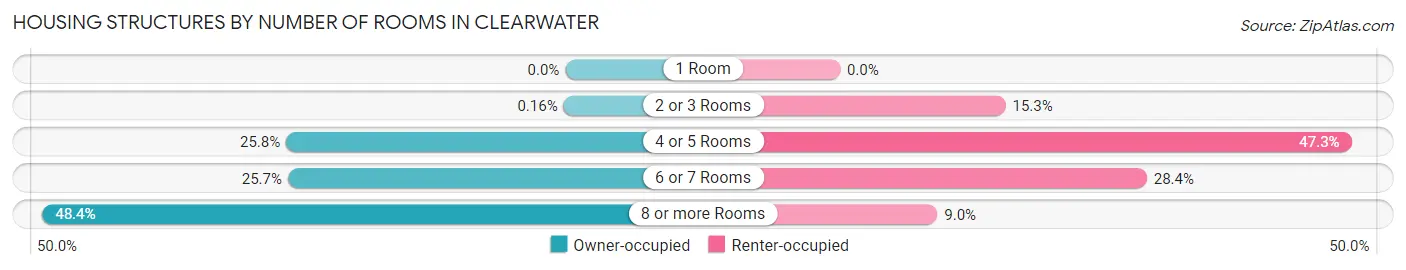
| Number of Rooms | Owner-occupied | Renter-occupied |
| 1 Room | 0 (0.0%) | 0 (0.0%) |
| 2 or 3 Rooms | 1 (0.2%) | 34 (15.3%) |
| 4 or 5 Rooms | 157 (25.8%) | 105 (47.3%) |
| 6 or 7 Rooms | 156 (25.7%) | 63 (28.4%) |
| 8 or more Rooms | 294 (48.4%) | 20 (9.0%) |
| Total | 608 (100.0%) | 222 (100.0%) |
Housing Structure by Heating Type in Clearwater
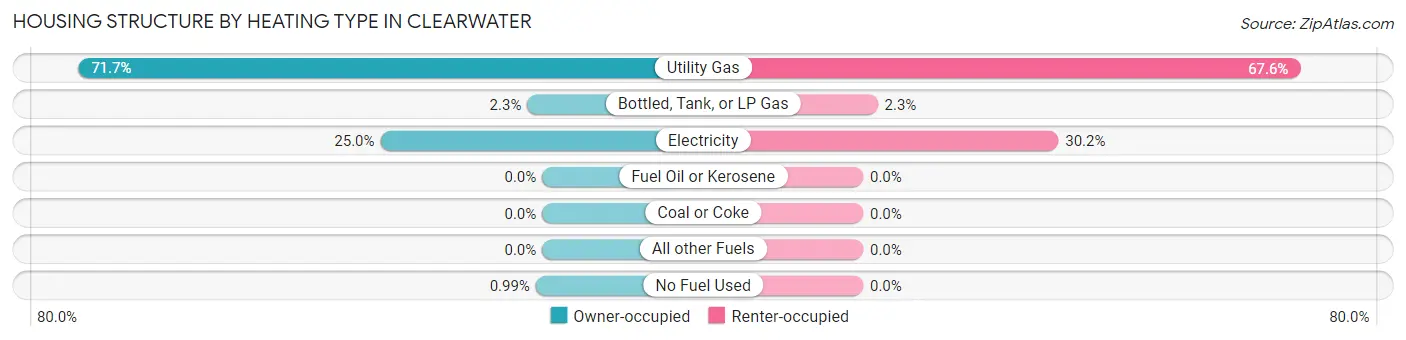
| Heating Type | Owner-occupied | Renter-occupied |
| Utility Gas | 436 (71.7%) | 150 (67.6%) |
| Bottled, Tank, or LP Gas | 14 (2.3%) | 5 (2.2%) |
| Electricity | 152 (25.0%) | 67 (30.2%) |
| Fuel Oil or Kerosene | 0 (0.0%) | 0 (0.0%) |
| Coal or Coke | 0 (0.0%) | 0 (0.0%) |
| All other Fuels | 0 (0.0%) | 0 (0.0%) |
| No Fuel Used | 6 (1.0%) | 0 (0.0%) |
| Total | 608 (100.0%) | 222 (100.0%) |
Household Vehicle Usage in Clearwater
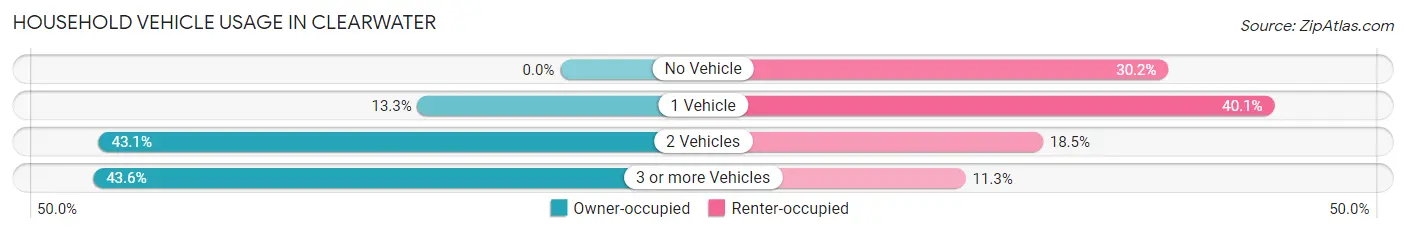
| Vehicles per Household | Owner-occupied | Renter-occupied |
| No Vehicle | 0 (0.0%) | 67 (30.2%) |
| 1 Vehicle | 81 (13.3%) | 89 (40.1%) |
| 2 Vehicles | 262 (43.1%) | 41 (18.5%) |
| 3 or more Vehicles | 265 (43.6%) | 25 (11.3%) |
| Total | 608 (100.0%) | 222 (100.0%) |
Real Estate & Mortgages in Clearwater
Real Estate and Mortgage Overview in Clearwater
| Characteristic | Without Mortgage | With Mortgage |
| Housing Units | 201 | 407 |
| Median Property Value | $152,700 | $194,000 |
| Median Household Income | $69,028 | $88 |
| Monthly Housing Costs | $521 | $52 |
| Real Estate Taxes | $1,882 | $0 |
Property Value by Mortgage Status in Clearwater
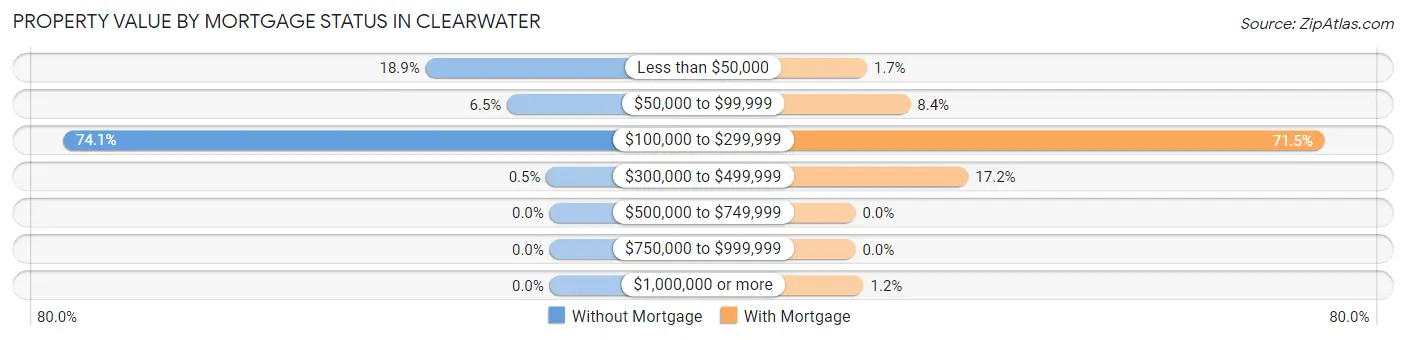
| Property Value | Without Mortgage | With Mortgage |
| Less than $50,000 | 38 (18.9%) | 7 (1.7%) |
| $50,000 to $99,999 | 13 (6.5%) | 34 (8.4%) |
| $100,000 to $299,999 | 149 (74.1%) | 291 (71.5%) |
| $300,000 to $499,999 | 1 (0.5%) | 70 (17.2%) |
| $500,000 to $749,999 | 0 (0.0%) | 0 (0.0%) |
| $750,000 to $999,999 | 0 (0.0%) | 0 (0.0%) |
| $1,000,000 or more | 0 (0.0%) | 5 (1.2%) |
| Total | 201 (100.0%) | 407 (100.0%) |
Household Income by Mortgage Status in Clearwater
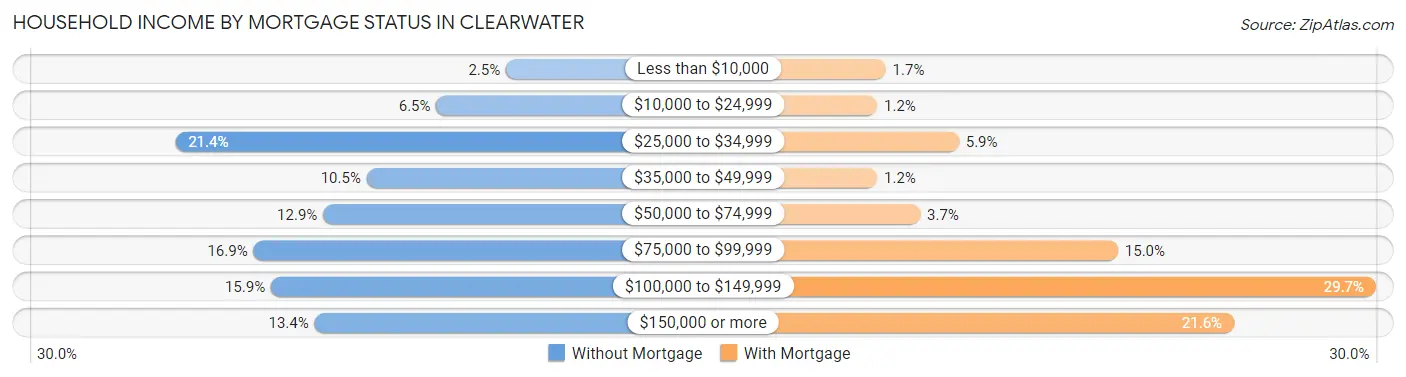
| Household Income | Without Mortgage | With Mortgage |
| Less than $10,000 | 5 (2.5%) | 7 (1.7%) |
| $10,000 to $24,999 | 13 (6.5%) | 5 (1.2%) |
| $25,000 to $34,999 | 43 (21.4%) | 24 (5.9%) |
| $35,000 to $49,999 | 21 (10.4%) | 5 (1.2%) |
| $50,000 to $74,999 | 26 (12.9%) | 15 (3.7%) |
| $75,000 to $99,999 | 34 (16.9%) | 61 (15.0%) |
| $100,000 to $149,999 | 32 (15.9%) | 121 (29.7%) |
| $150,000 or more | 27 (13.4%) | 88 (21.6%) |
| Total | 201 (100.0%) | 407 (100.0%) |
Property Value to Household Income Ratio in Clearwater
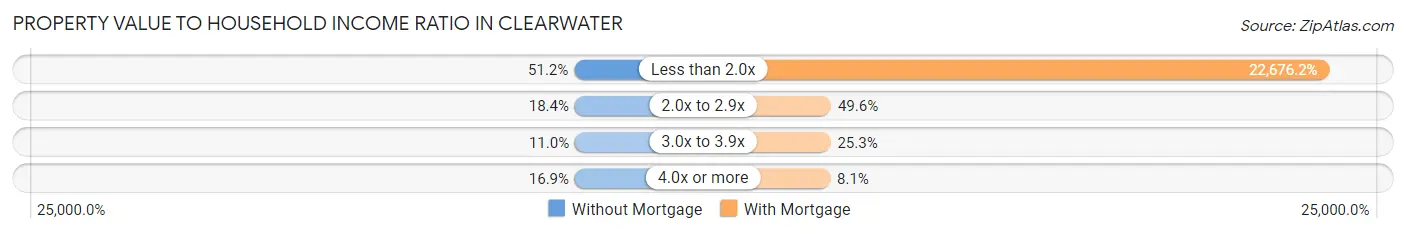
| Value-to-Income Ratio | Without Mortgage | With Mortgage |
| Less than 2.0x | 103 (51.2%) | 92,292 (22,676.2%) |
| 2.0x to 2.9x | 37 (18.4%) | 202 (49.6%) |
| 3.0x to 3.9x | 22 (11.0%) | 103 (25.3%) |
| 4.0x or more | 34 (16.9%) | 33 (8.1%) |
| Total | 201 (100.0%) | 407 (100.0%) |
Real Estate Taxes by Mortgage Status in Clearwater
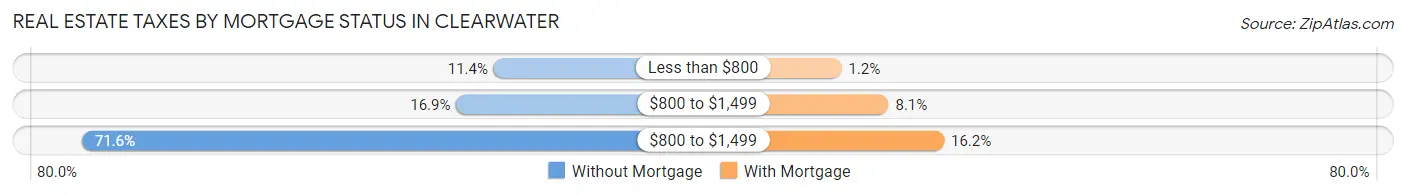
| Property Taxes | Without Mortgage | With Mortgage |
| Less than $800 | 23 (11.4%) | 5 (1.2%) |
| $800 to $1,499 | 34 (16.9%) | 33 (8.1%) |
| $800 to $1,499 | 144 (71.6%) | 66 (16.2%) |
| Total | 201 (100.0%) | 407 (100.0%) |
Health & Disability in Clearwater
Health Insurance Coverage by Age in Clearwater
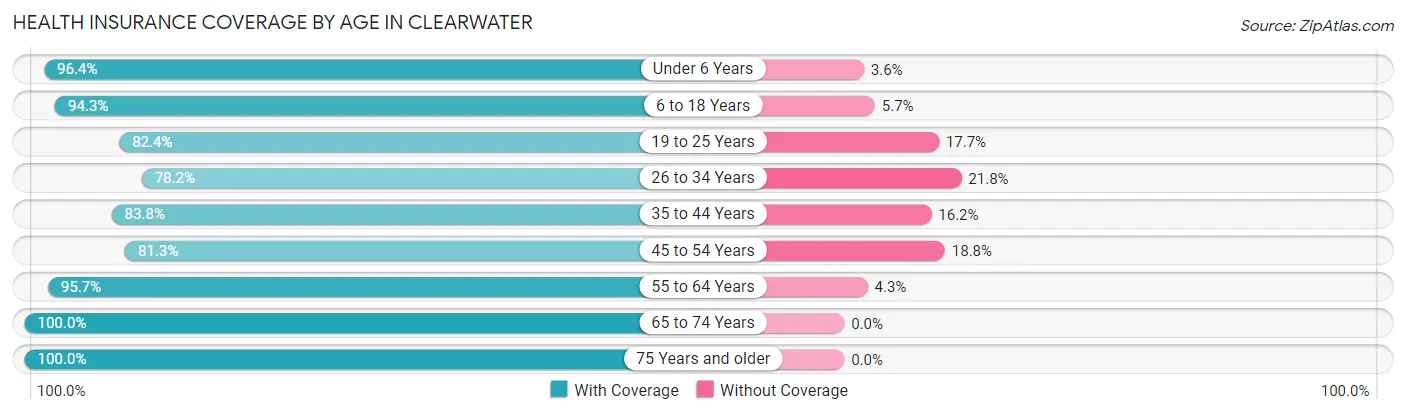
| Age Bracket | With Coverage | Without Coverage |
| Under 6 Years | 265 (96.4%) | 10 (3.6%) |
| 6 to 18 Years | 530 (94.3%) | 32 (5.7%) |
| 19 to 25 Years | 112 (82.4%) | 24 (17.6%) |
| 26 to 34 Years | 161 (78.2%) | 45 (21.8%) |
| 35 to 44 Years | 330 (83.8%) | 64 (16.2%) |
| 45 to 54 Years | 143 (81.2%) | 33 (18.8%) |
| 55 to 64 Years | 353 (95.7%) | 16 (4.3%) |
| 65 to 74 Years | 186 (100.0%) | 0 (0.0%) |
| 75 Years and older | 151 (100.0%) | 0 (0.0%) |
| Total | 2,231 (90.9%) | 224 (9.1%) |
Health Insurance Coverage by Citizenship Status in Clearwater
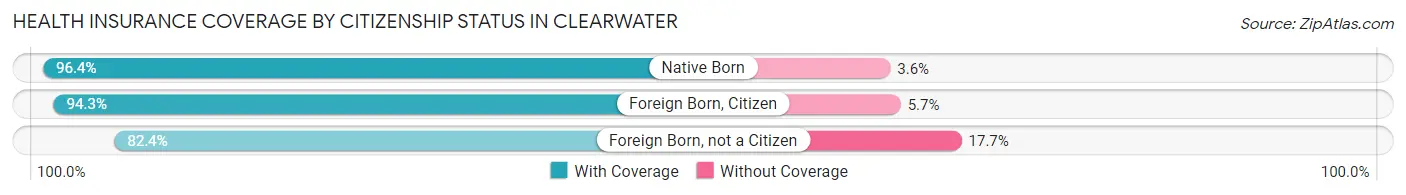
| Citizenship Status | With Coverage | Without Coverage |
| Native Born | 265 (96.4%) | 10 (3.6%) |
| Foreign Born, Citizen | 530 (94.3%) | 32 (5.7%) |
| Foreign Born, not a Citizen | 112 (82.4%) | 24 (17.6%) |
Health Insurance Coverage by Household Income in Clearwater
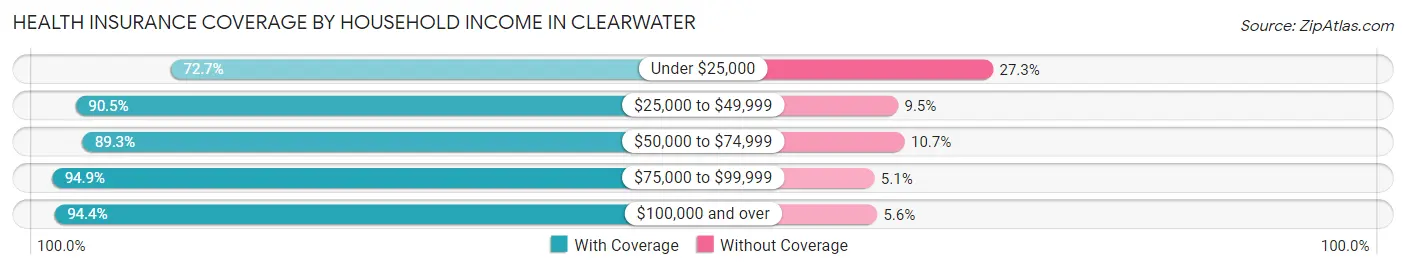
| Household Income | With Coverage | Without Coverage |
| Under $25,000 | 197 (72.7%) | 74 (27.3%) |
| $25,000 to $49,999 | 200 (90.5%) | 21 (9.5%) |
| $50,000 to $74,999 | 391 (89.3%) | 47 (10.7%) |
| $75,000 to $99,999 | 560 (94.9%) | 30 (5.1%) |
| $100,000 and over | 883 (94.4%) | 52 (5.6%) |
Public vs Private Health Insurance Coverage by Age in Clearwater
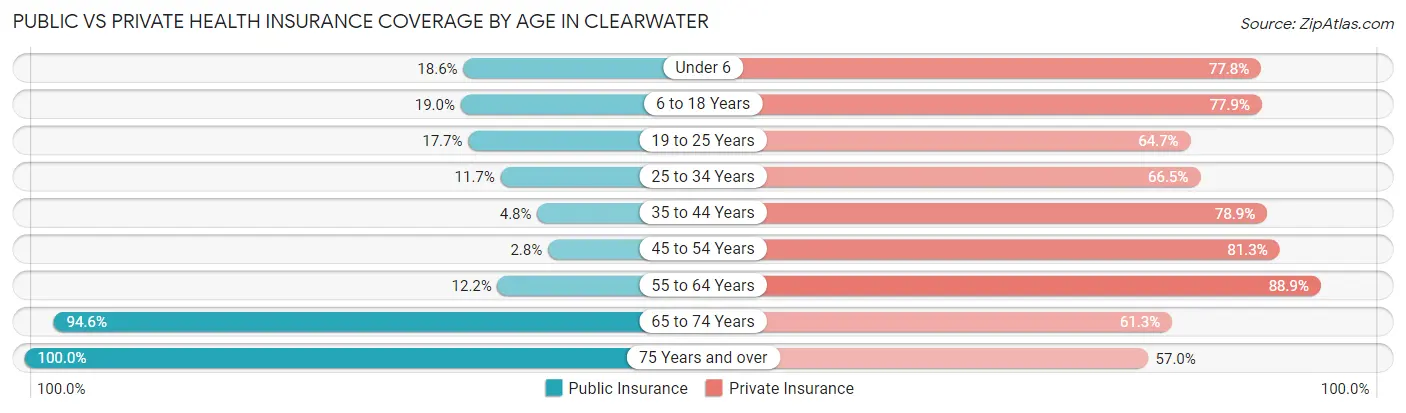
| Age Bracket | Public Insurance | Private Insurance |
| Under 6 | 51 (18.5%) | 214 (77.8%) |
| 6 to 18 Years | 107 (19.0%) | 438 (77.9%) |
| 19 to 25 Years | 24 (17.6%) | 88 (64.7%) |
| 25 to 34 Years | 24 (11.7%) | 137 (66.5%) |
| 35 to 44 Years | 19 (4.8%) | 311 (78.9%) |
| 45 to 54 Years | 5 (2.8%) | 143 (81.2%) |
| 55 to 64 Years | 45 (12.2%) | 328 (88.9%) |
| 65 to 74 Years | 176 (94.6%) | 114 (61.3%) |
| 75 Years and over | 151 (100.0%) | 86 (57.0%) |
| Total | 602 (24.5%) | 1,859 (75.7%) |
Disability Status by Sex by Age in Clearwater
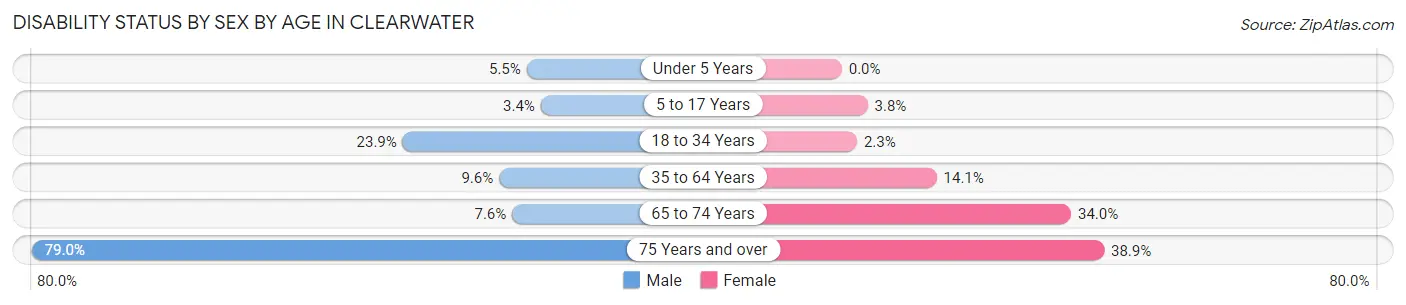
| Age Bracket | Male | Female |
| Under 5 Years | 6 (5.4%) | 0 (0.0%) |
| 5 to 17 Years | 14 (3.4%) | 7 (3.8%) |
| 18 to 34 Years | 37 (23.9%) | 5 (2.2%) |
| 35 to 64 Years | 49 (9.6%) | 60 (14.1%) |
| 65 to 74 Years | 7 (7.6%) | 32 (34.0%) |
| 75 Years and over | 30 (78.9%) | 44 (38.9%) |
Disability Class by Sex by Age in Clearwater
Disability Class: Hearing Difficulty
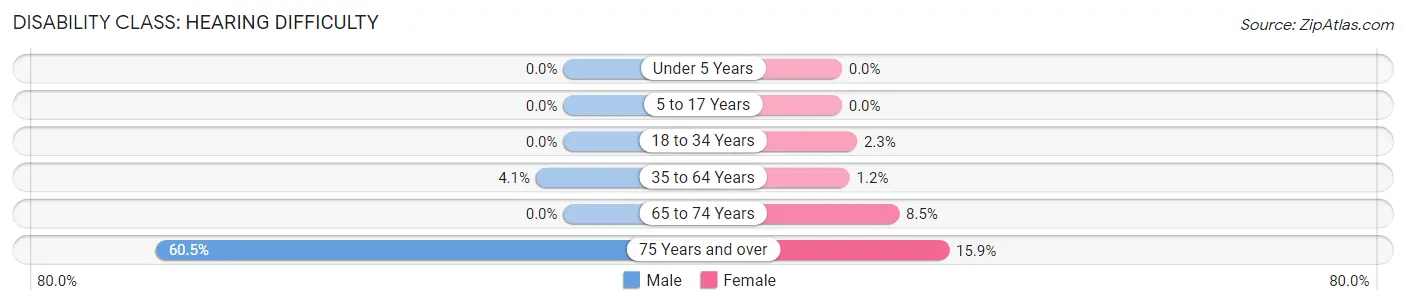
| Age Bracket | Male | Female |
| Under 5 Years | 0 (0.0%) | 0 (0.0%) |
| 5 to 17 Years | 0 (0.0%) | 0 (0.0%) |
| 18 to 34 Years | 0 (0.0%) | 5 (2.2%) |
| 35 to 64 Years | 21 (4.1%) | 5 (1.2%) |
| 65 to 74 Years | 0 (0.0%) | 8 (8.5%) |
| 75 Years and over | 23 (60.5%) | 18 (15.9%) |
Disability Class: Vision Difficulty
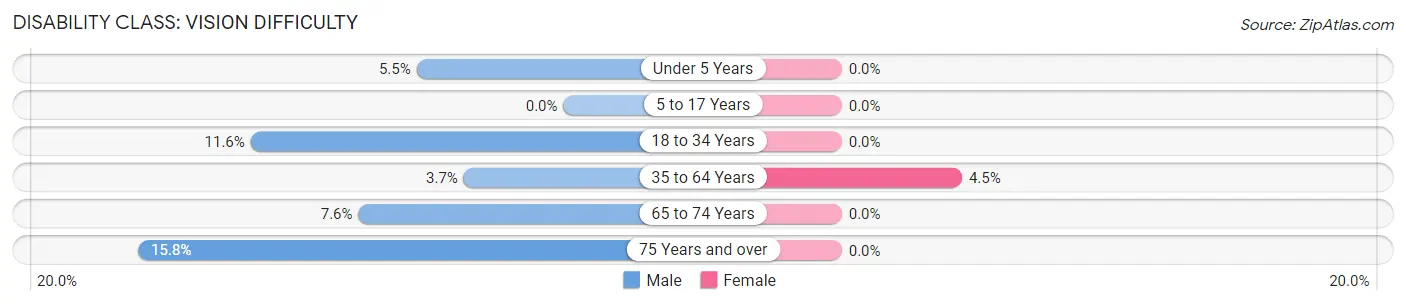
| Age Bracket | Male | Female |
| Under 5 Years | 6 (5.4%) | 0 (0.0%) |
| 5 to 17 Years | 0 (0.0%) | 0 (0.0%) |
| 18 to 34 Years | 18 (11.6%) | 0 (0.0%) |
| 35 to 64 Years | 19 (3.7%) | 19 (4.5%) |
| 65 to 74 Years | 7 (7.6%) | 0 (0.0%) |
| 75 Years and over | 6 (15.8%) | 0 (0.0%) |
Disability Class: Cognitive Difficulty
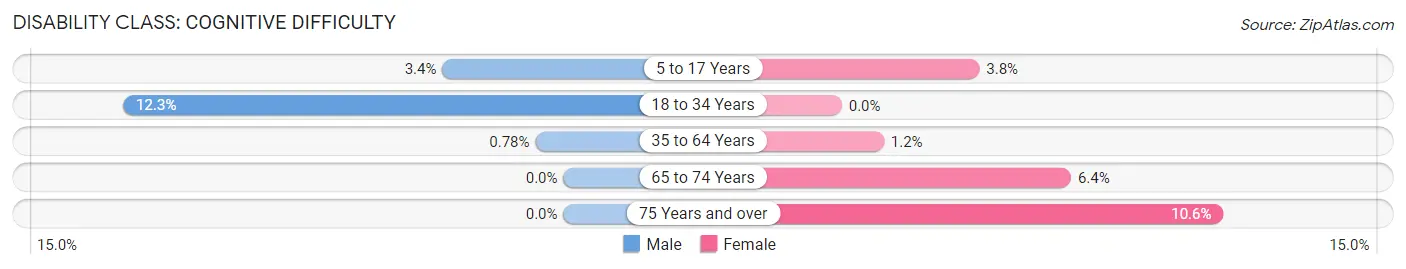
| Age Bracket | Male | Female |
| 5 to 17 Years | 14 (3.4%) | 7 (3.8%) |
| 18 to 34 Years | 19 (12.3%) | 0 (0.0%) |
| 35 to 64 Years | 4 (0.8%) | 5 (1.2%) |
| 65 to 74 Years | 0 (0.0%) | 6 (6.4%) |
| 75 Years and over | 0 (0.0%) | 12 (10.6%) |
Disability Class: Ambulatory Difficulty
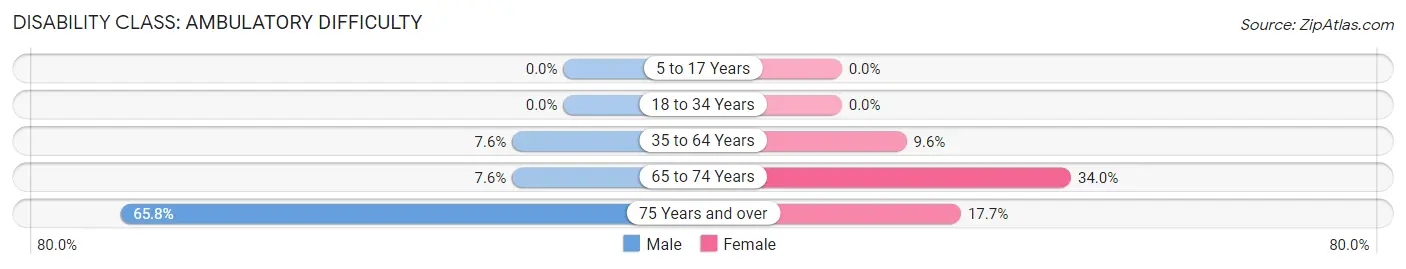
| Age Bracket | Male | Female |
| 5 to 17 Years | 0 (0.0%) | 0 (0.0%) |
| 18 to 34 Years | 0 (0.0%) | 0 (0.0%) |
| 35 to 64 Years | 39 (7.6%) | 41 (9.6%) |
| 65 to 74 Years | 7 (7.6%) | 32 (34.0%) |
| 75 Years and over | 25 (65.8%) | 20 (17.7%) |
Disability Class: Self-Care Difficulty
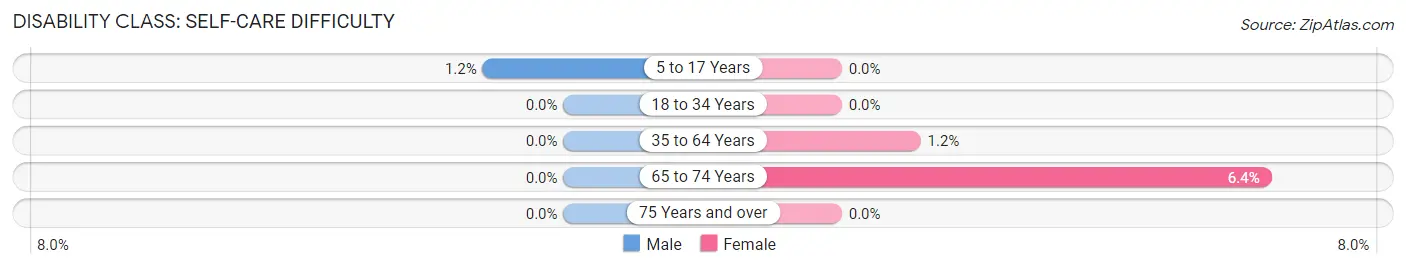
| Age Bracket | Male | Female |
| 5 to 17 Years | 5 (1.2%) | 0 (0.0%) |
| 18 to 34 Years | 0 (0.0%) | 0 (0.0%) |
| 35 to 64 Years | 0 (0.0%) | 5 (1.2%) |
| 65 to 74 Years | 0 (0.0%) | 6 (6.4%) |
| 75 Years and over | 0 (0.0%) | 0 (0.0%) |
Technology Access in Clearwater
Computing Device Access in Clearwater
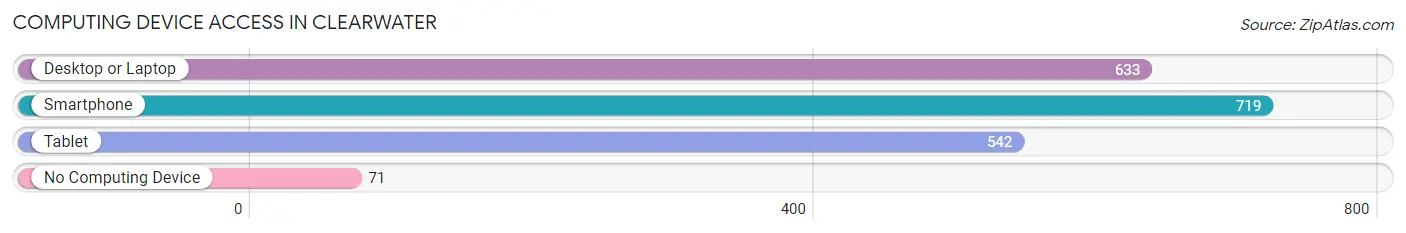
| Device Type | # Households | % Households |
| Desktop or Laptop | 633 | 76.3% |
| Smartphone | 719 | 86.6% |
| Tablet | 542 | 65.3% |
| No Computing Device | 71 | 8.6% |
| Total | 830 | 100.0% |
Internet Access in Clearwater
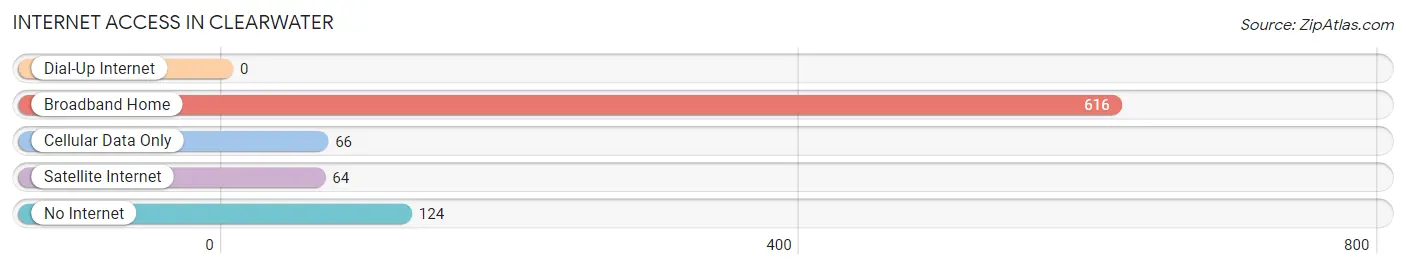
| Internet Type | # Households | % Households |
| Dial-Up Internet | 0 | 0.0% |
| Broadband Home | 616 | 74.2% |
| Cellular Data Only | 66 | 8.0% |
| Satellite Internet | 64 | 7.7% |
| No Internet | 124 | 14.9% |
| Total | 830 | 100.0% |
Clearwater Summary
Clearwater, Kansas is a small city located in Sedgwick County, Kansas. It is situated in the south-central part of the state, about 20 miles north of Wichita. The city has a population of approximately 4,000 people and is part of the Wichita metropolitan area.
History
Clearwater was founded in 1871 by a group of settlers from Ohio. The city was named after Clearwater Creek, which runs through the area. The creek was named by the settlers for its clear water. The city was incorporated in 1887 and was a major stop on the Atchison, Topeka and Santa Fe Railway.
In the early 1900s, Clearwater was a thriving agricultural community. The city was home to several grain elevators, a flour mill, and a creamery. The city also had a number of businesses, including a bank, a hotel, a newspaper, and a movie theater.
Geography
Clearwater is located in south-central Kansas, about 20 miles north of Wichita. The city is situated in the Arkansas River Valley, which is part of the Great Plains region. The city is surrounded by rolling hills and grasslands. The climate is semi-arid, with hot summers and cold winters.
Economy
The economy of Clearwater is largely based on agriculture. The city is home to several grain elevators, a flour mill, and a creamery. The city also has a number of businesses, including a bank, a hotel, a newspaper, and a movie theater.
The city is also home to several manufacturing companies, including a plastics manufacturer, a metal fabrication company, and a printing company. The city is also home to a number of retail stores, including a grocery store, a hardware store, and a variety of specialty shops.
Demographics
As of the 2010 census, the population of Clearwater was 4,000. The racial makeup of the city was 95.3% White, 0.7% African American, 0.3% Native American, 0.3% Asian, 0.1% Pacific Islander, 1.2% from other races, and 2.4% from two or more races. Hispanic or Latino of any race were 3.2% of the population.
The median household income in Clearwater was $41,250, and the median family income was $50,000. The per capita income was $20,000. About 11.3% of families and 14.2% of the population were below the poverty line, including 18.2% of those under age 18 and 8.3% of those age 65 or over.
Clearwater is served by the Clearwater Unified School District, which includes Clearwater High School. The city is also home to a branch of Butler Community College.
Clearwater is a small city with a rich history and a diverse economy. The city is home to a number of businesses, including manufacturing companies, retail stores, and a variety of specialty shops. The city is also home to a number of educational institutions, including a high school and a branch of Butler Community College. The city has a population of approximately 4,000 people and is part of the Wichita metropolitan area.
Common Questions
What is Per Capita Income in Clearwater?
Per Capita income in Clearwater is $29,737.
What is the Median Family Income in Clearwater?
Median Family Income in Clearwater is $84,506.
What is the Median Household income in Clearwater?
Median Household Income in Clearwater is $78,472.
What is Income or Wage Gap in Clearwater?
Income or Wage Gap in Clearwater is 31.1%.
Women in Clearwater earn 68.9 cents for every dollar earned by a man.
What is Inequality or Gini Index in Clearwater?
Inequality or Gini Index in Clearwater is 0.41.
What is the Total Population of Clearwater?
Total Population of Clearwater is 2,544.
What is the Total Male Population of Clearwater?
Total Male Population of Clearwater is 1,346.
What is the Total Female Population of Clearwater?
Total Female Population of Clearwater is 1,198.
What is the Ratio of Males per 100 Females in Clearwater?
There are 112.35 Males per 100 Females in Clearwater.
What is the Ratio of Females per 100 Males in Clearwater?
There are 89.00 Females per 100 Males in Clearwater.
What is the Median Population Age in Clearwater?
Median Population Age in Clearwater is 36.7 Years.
What is the Average Family Size in Clearwater
Average Family Size in Clearwater is 3.4 People.
What is the Average Household Size in Clearwater
Average Household Size in Clearwater is 3.0 People.
How Large is the Labor Force in Clearwater?
There are 1,168 People in the Labor Forcein in Clearwater.
What is the Percentage of People in the Labor Force in Clearwater?
64.4% of People are in the Labor Force in Clearwater.
What is the Unemployment Rate in Clearwater?
Unemployment Rate in Clearwater is 2.9%.