Oakley, KS Map & Demographics
Oakley Map
Oakley Overview
$37,008
PER CAPITA INCOME
$86,250
AVG FAMILY INCOME
$65,568
AVG HOUSEHOLD INCOME
40.6%
WAGE / INCOME GAP [ % ]
59.4¢/ $1
WAGE / INCOME GAP [ $ ]
0.46
INEQUALITY / GINI INDEX
2,063
TOTAL POPULATION
1,047
MALE POPULATION
1,016
FEMALE POPULATION
103.05
MALES / 100 FEMALES
97.04
FEMALES / 100 MALES
42.0
MEDIAN AGE
2.7
AVG FAMILY SIZE
2.2
AVG HOUSEHOLD SIZE
1,066
LABOR FORCE [ PEOPLE ]
67.3%
PERCENT IN LABOR FORCE
0.3%
UNEMPLOYMENT RATE
Oakley Zip Codes
Oakley Area Codes
Income in Oakley
Income Overview in Oakley
Per Capita Income in Oakley is $37,008, while median incomes of families and households are $86,250 and $65,568 respectively.
| Characteristic | Number | Measure |
| Per Capita Income | 2,063 | $37,008 |
| Median Family Income | 612 | $86,250 |
| Mean Family Income | 612 | $101,575 |
| Median Household Income | 929 | $65,568 |
| Mean Household Income | 929 | $87,091 |
| Income Deficit | 612 | $0 |
| Wage / Income Gap (%) | 2,063 | 40.63% |
| Wage / Income Gap ($) | 2,063 | 59.37¢ per $1 |
| Gini / Inequality Index | 2,063 | 0.46 |
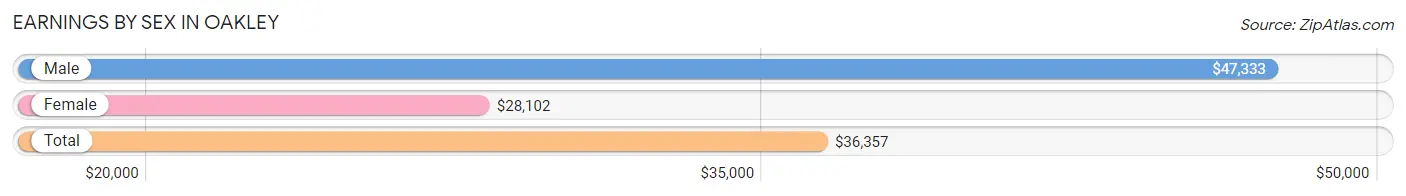
Earnings by Sex in Oakley
Average Earnings in Oakley are $36,357, $47,333 for men and $28,102 for women, a difference of 40.6%.
| Sex | Number | Average Earnings |
| Male | 624 (55.8%) | $47,333 |
| Female | 494 (44.2%) | $28,102 |
| Total | 1,118 (100.0%) | $36,357 |
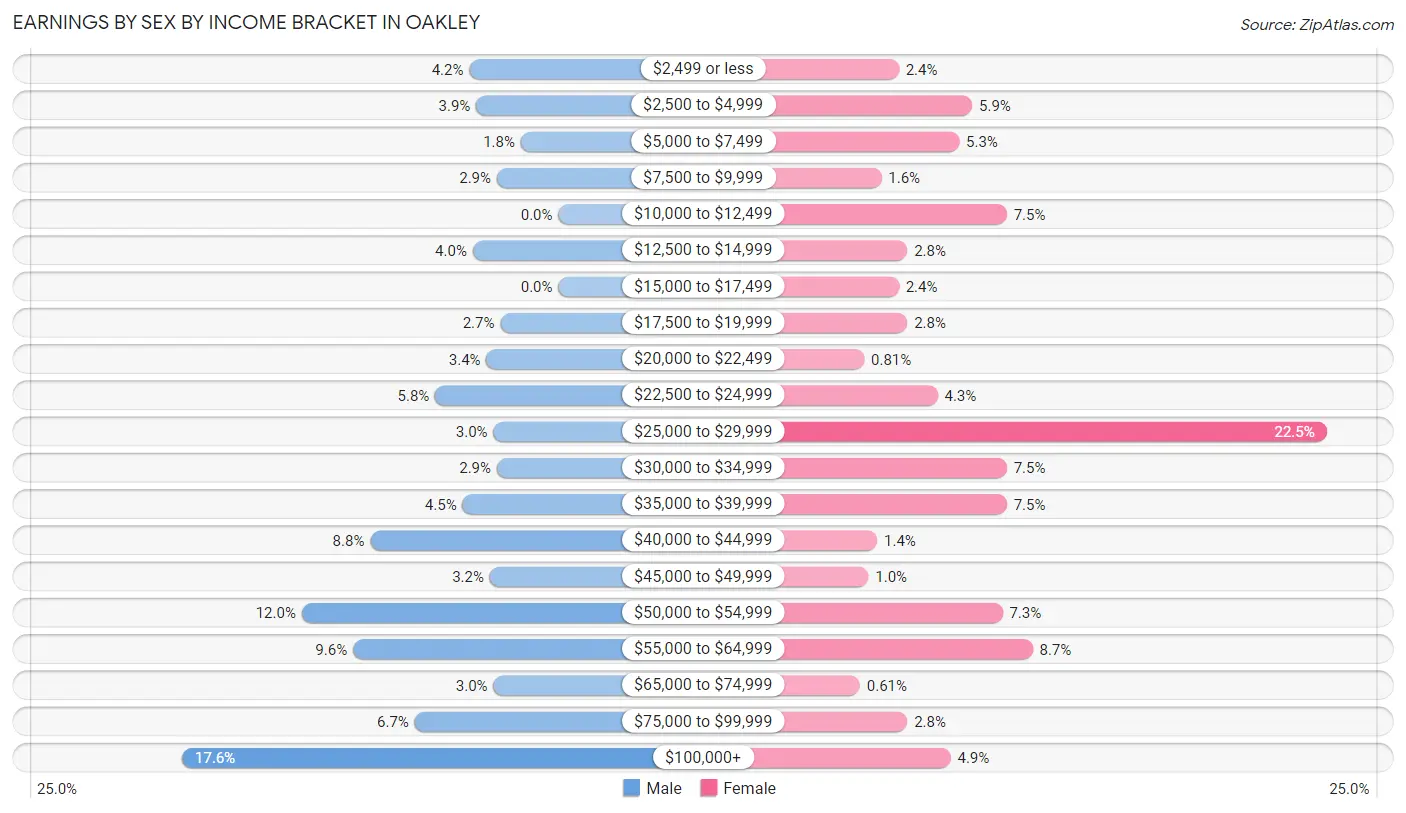
Earnings by Sex by Income Bracket in Oakley
The most common earnings brackets in Oakley are $100,000+ for men (110 | 17.6%) and $25,000 to $29,999 for women (111 | 22.5%).
| Income | Male | Female |
| $2,499 or less | 26 (4.2%) | 12 (2.4%) |
| $2,500 to $4,999 | 24 (3.8%) | 29 (5.9%) |
| $5,000 to $7,499 | 11 (1.8%) | 26 (5.3%) |
| $7,500 to $9,999 | 18 (2.9%) | 8 (1.6%) |
| $10,000 to $12,499 | 0 (0.0%) | 37 (7.5%) |
| $12,500 to $14,999 | 25 (4.0%) | 14 (2.8%) |
| $15,000 to $17,499 | 0 (0.0%) | 12 (2.4%) |
| $17,500 to $19,999 | 17 (2.7%) | 14 (2.8%) |
| $20,000 to $22,499 | 21 (3.4%) | 4 (0.8%) |
| $22,500 to $24,999 | 36 (5.8%) | 21 (4.3%) |
| $25,000 to $29,999 | 19 (3.0%) | 111 (22.5%) |
| $30,000 to $34,999 | 18 (2.9%) | 37 (7.5%) |
| $35,000 to $39,999 | 28 (4.5%) | 37 (7.5%) |
| $40,000 to $44,999 | 55 (8.8%) | 7 (1.4%) |
| $45,000 to $49,999 | 20 (3.2%) | 5 (1.0%) |
| $50,000 to $54,999 | 75 (12.0%) | 36 (7.3%) |
| $55,000 to $64,999 | 60 (9.6%) | 43 (8.7%) |
| $65,000 to $74,999 | 19 (3.0%) | 3 (0.6%) |
| $75,000 to $99,999 | 42 (6.7%) | 14 (2.8%) |
| $100,000+ | 110 (17.6%) | 24 (4.9%) |
| Total | 624 (100.0%) | 494 (100.0%) |
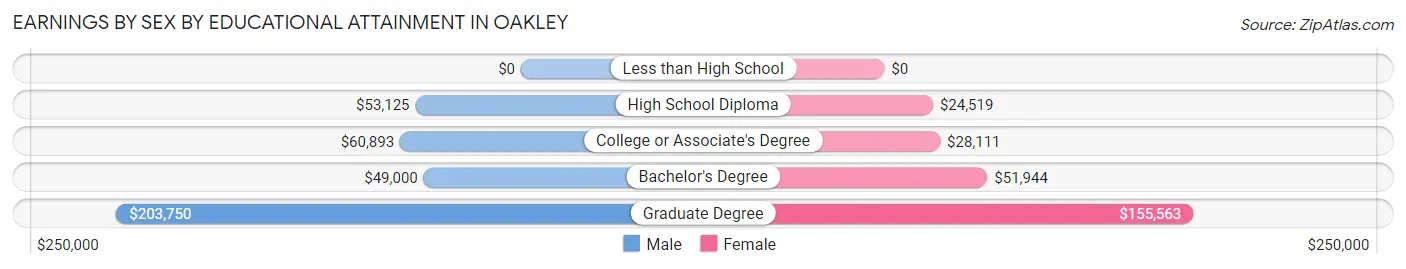
Earnings by Sex by Educational Attainment in Oakley
Average earnings in Oakley are $53,390 for men and $29,309 for women, a difference of 45.1%. Men with an educational attainment of graduate degree enjoy the highest average annual earnings of $203,750, while those with bachelor's degree education earn the least with $49,000. Women with an educational attainment of graduate degree earn the most with the average annual earnings of $155,563, while those with high school diploma education have the smallest earnings of $24,519.
| Educational Attainment | Male Income | Female Income |
| Less than High School | - | - |
| High School Diploma | $53,125 | $24,519 |
| College or Associate's Degree | $60,893 | $28,111 |
| Bachelor's Degree | $49,000 | $51,944 |
| Graduate Degree | $203,750 | $155,563 |
| Total | $53,390 | $29,309 |
Family Income in Oakley
Family Income Brackets in Oakley
According to the Oakley family income data, there are 144 families falling into the $100,000 to $149,999 income range, which is the most common income bracket and makes up 23.5% of all families. Conversely, the $10,000 to $14,999 income bracket is the least frequent group with only 12 families (2.0%) belonging to this category.
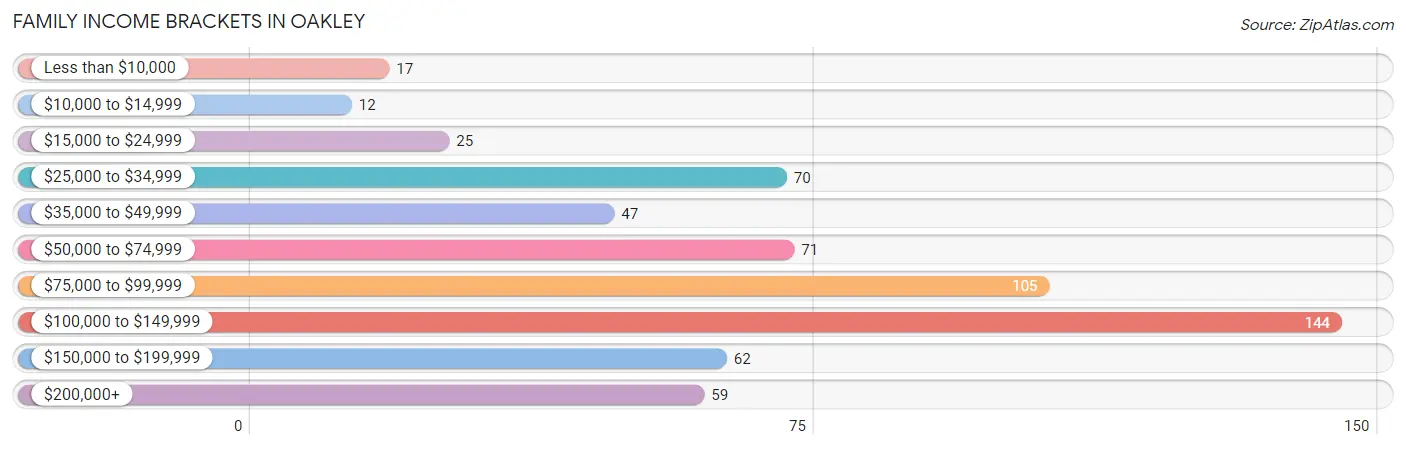
| Income Bracket | # Families | % Families |
| Less than $10,000 | 17 | 2.8% |
| $10,000 to $14,999 | 12 | 2.0% |
| $15,000 to $24,999 | 25 | 4.1% |
| $25,000 to $34,999 | 70 | 11.4% |
| $35,000 to $49,999 | 47 | 7.7% |
| $50,000 to $74,999 | 71 | 11.6% |
| $75,000 to $99,999 | 105 | 17.2% |
| $100,000 to $149,999 | 144 | 23.5% |
| $150,000 to $199,999 | 62 | 10.1% |
| $200,000+ | 59 | 9.6% |
Family Income by Famaliy Size in Oakley
4-person families (86 | 14.1%) account for the highest median family income in Oakley with $113,295 per family, while 2-person families (280 | 45.8%) have the highest median income of $44,107 per family member.
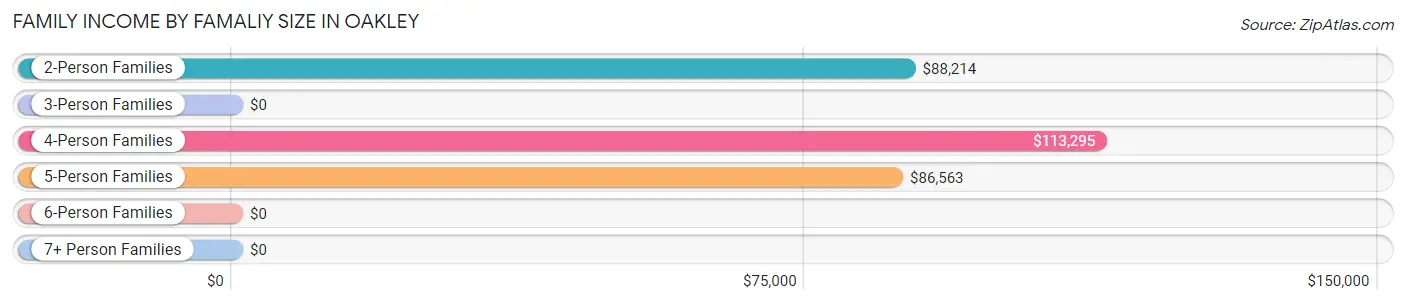
| Income Bracket | # Families | Median Income |
| 2-Person Families | 280 (45.8%) | $88,214 |
| 3-Person Families | 144 (23.5%) | $0 |
| 4-Person Families | 86 (14.1%) | $113,295 |
| 5-Person Families | 85 (13.9%) | $86,563 |
| 6-Person Families | 14 (2.3%) | $0 |
| 7+ Person Families | 3 (0.5%) | $0 |
| Total | 612 (100.0%) | $86,250 |
Family Income by Number of Earners in Oakley
The median family income in Oakley is $86,250, with families comprising 3+ earners (50) having the highest median family income of $108,500, while families with no earners (66) have the lowest median family income of $38,750, accounting for 8.2% and 10.8% of families, respectively.
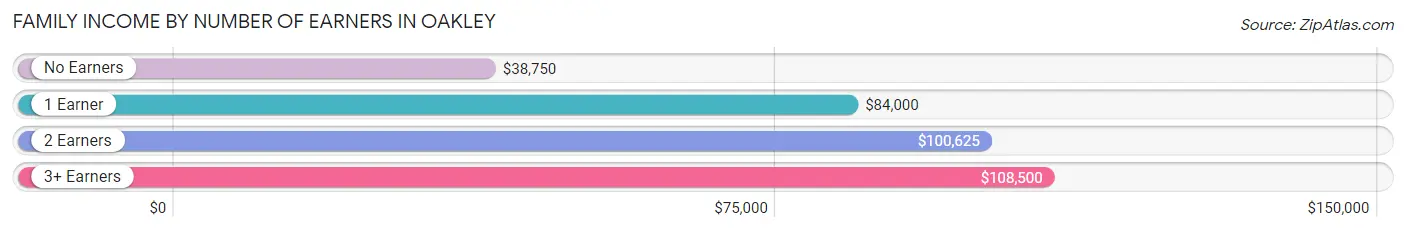
| Number of Earners | # Families | Median Income |
| No Earners | 66 (10.8%) | $38,750 |
| 1 Earner | 230 (37.6%) | $84,000 |
| 2 Earners | 266 (43.5%) | $100,625 |
| 3+ Earners | 50 (8.2%) | $108,500 |
| Total | 612 (100.0%) | $86,250 |
Household Income in Oakley
Household Income Brackets in Oakley
With 149 households falling in the category, the $100,000 to $149,999 income range is the most frequent in Oakley, accounting for 16.0% of all households. In contrast, only 20 households (2.1%) fall into the $10,000 to $14,999 income bracket, making it the least populous group.
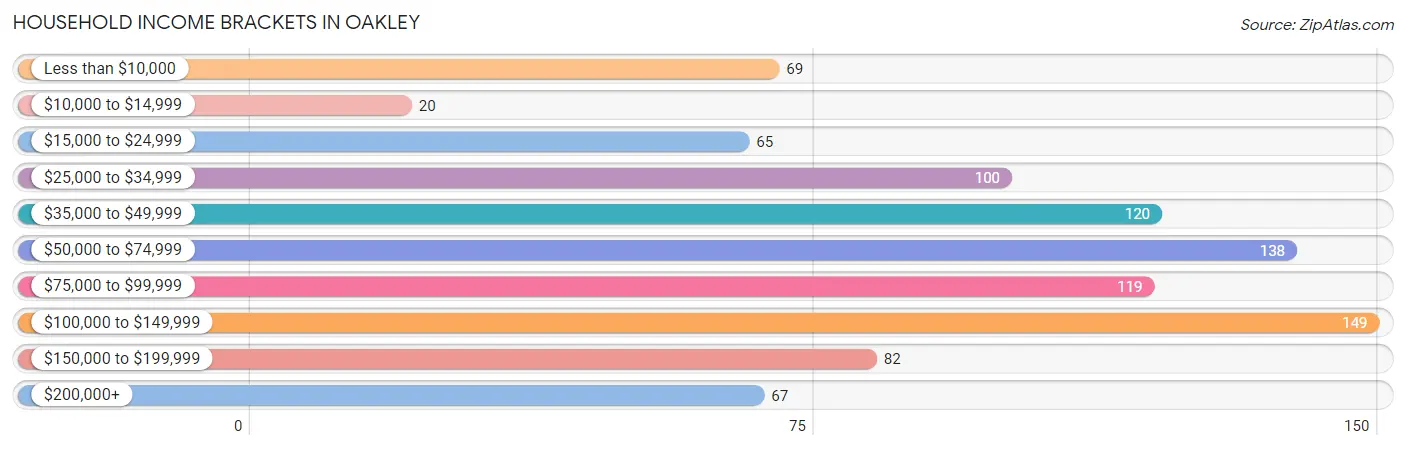
| Income Bracket | # Households | % Households |
| Less than $10,000 | 69 | 7.4% |
| $10,000 to $14,999 | 20 | 2.2% |
| $15,000 to $24,999 | 65 | 7.0% |
| $25,000 to $34,999 | 100 | 10.8% |
| $35,000 to $49,999 | 120 | 12.9% |
| $50,000 to $74,999 | 138 | 14.9% |
| $75,000 to $99,999 | 119 | 12.8% |
| $100,000 to $149,999 | 149 | 16.0% |
| $150,000 to $199,999 | 82 | 8.8% |
| $200,000+ | 67 | 7.2% |
Household Income by Householder Age in Oakley
The median household income in Oakley is $65,568, with the highest median household income of $90,972 found in the 45 to 64 years age bracket for the primary householder. A total of 338 households (36.4%) fall into this category. Meanwhile, the 15 to 24 years age bracket for the primary householder has the lowest median household income of $28,571, with 70 households (7.5%) in this group.
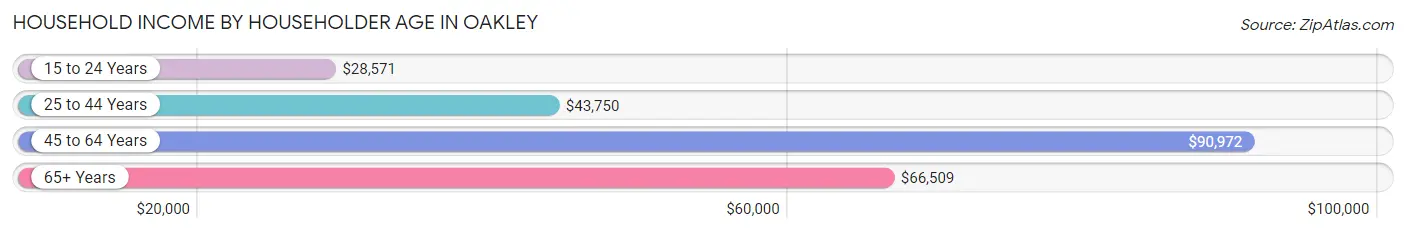
| Income Bracket | # Households | Median Income |
| 15 to 24 Years | 70 (7.5%) | $28,571 |
| 25 to 44 Years | 290 (31.2%) | $43,750 |
| 45 to 64 Years | 338 (36.4%) | $90,972 |
| 65+ Years | 231 (24.9%) | $66,509 |
| Total | 929 (100.0%) | $65,568 |
Poverty in Oakley
Income Below Poverty by Sex and Age in Oakley
With 10.7% poverty level for males and 9.4% for females among the residents of Oakley, 15 year old males and 25 to 34 year old females are the most vulnerable to poverty, with 28 males (87.5%) and 37 females (31.6%) in their respective age groups living below the poverty level.
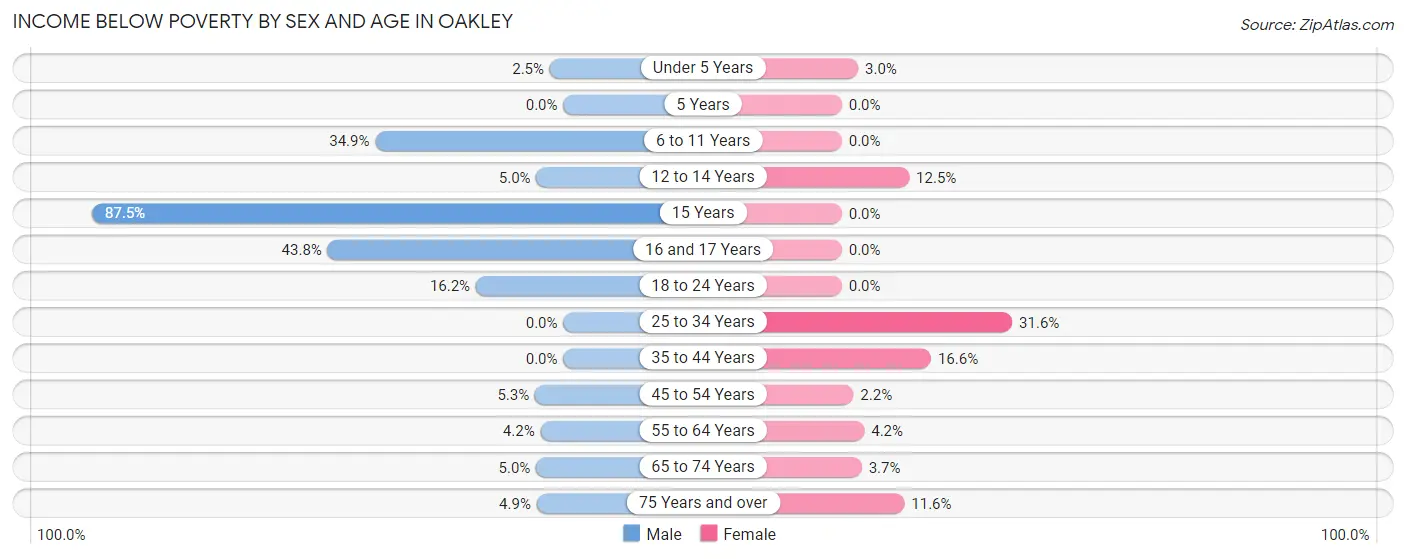
| Age Bracket | Male | Female |
| Under 5 Years | 2 (2.5%) | 2 (3.0%) |
| 5 Years | 0 (0.0%) | 0 (0.0%) |
| 6 to 11 Years | 37 (34.9%) | 0 (0.0%) |
| 12 to 14 Years | 2 (5.0%) | 6 (12.5%) |
| 15 Years | 28 (87.5%) | 0 (0.0%) |
| 16 and 17 Years | 7 (43.8%) | 0 (0.0%) |
| 18 to 24 Years | 12 (16.2%) | 0 (0.0%) |
| 25 to 34 Years | 0 (0.0%) | 37 (31.6%) |
| 35 to 44 Years | 0 (0.0%) | 23 (16.6%) |
| 45 to 54 Years | 6 (5.3%) | 2 (2.1%) |
| 55 to 64 Years | 7 (4.2%) | 6 (4.2%) |
| 65 to 74 Years | 6 (5.0%) | 4 (3.7%) |
| 75 Years and over | 4 (4.9%) | 13 (11.6%) |
| Total | 111 (10.7%) | 93 (9.4%) |
Income Above Poverty by Sex and Age in Oakley
According to the poverty statistics in Oakley, males aged 5 years and females aged 5 years are the age groups that are most secure financially, with 100.0% of males and 100.0% of females in these age groups living above the poverty line.
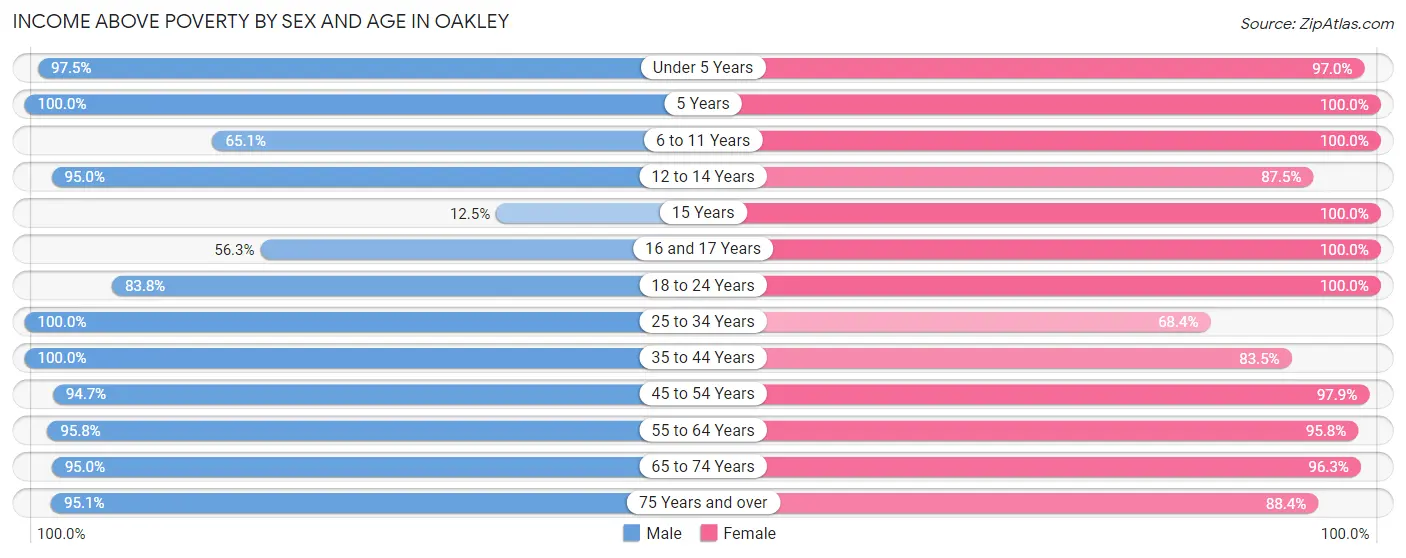
| Age Bracket | Male | Female |
| Under 5 Years | 78 (97.5%) | 64 (97.0%) |
| 5 Years | 9 (100.0%) | 8 (100.0%) |
| 6 to 11 Years | 69 (65.1%) | 76 (100.0%) |
| 12 to 14 Years | 38 (95.0%) | 42 (87.5%) |
| 15 Years | 4 (12.5%) | 14 (100.0%) |
| 16 and 17 Years | 9 (56.2%) | 15 (100.0%) |
| 18 to 24 Years | 62 (83.8%) | 54 (100.0%) |
| 25 to 34 Years | 71 (100.0%) | 80 (68.4%) |
| 35 to 44 Years | 131 (100.0%) | 116 (83.5%) |
| 45 to 54 Years | 108 (94.7%) | 91 (97.9%) |
| 55 to 64 Years | 158 (95.8%) | 138 (95.8%) |
| 65 to 74 Years | 113 (95.0%) | 104 (96.3%) |
| 75 Years and over | 77 (95.1%) | 99 (88.4%) |
| Total | 927 (89.3%) | 901 (90.6%) |
Income Below Poverty Among Married-Couple Families in Oakley
The poverty statistics for married-couple families in Oakley show that 1.7% or 8 of the total 466 families live below the poverty line. Families with no children have the highest poverty rate of 2.9%, comprising of 8 families. On the other hand, families with 1 or 2 children have the lowest poverty rate of 0.0%, which includes 0 families.
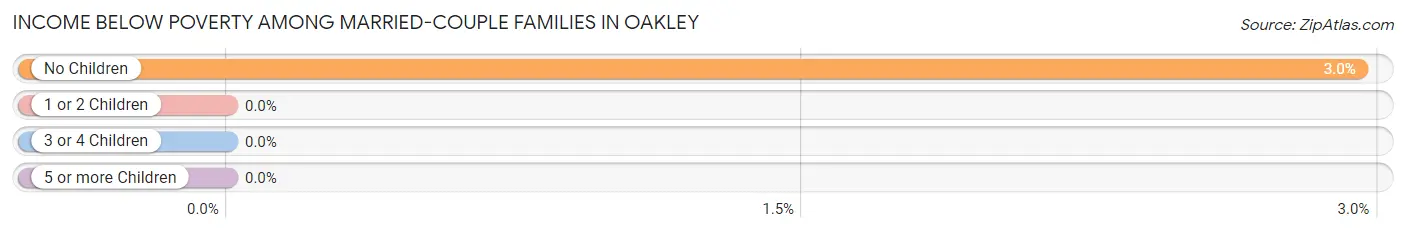
| Children | Above Poverty | Below Poverty |
| No Children | 263 (97.1%) | 8 (2.9%) |
| 1 or 2 Children | 132 (100.0%) | 0 (0.0%) |
| 3 or 4 Children | 60 (100.0%) | 0 (0.0%) |
| 5 or more Children | 3 (100.0%) | 0 (0.0%) |
| Total | 458 (98.3%) | 8 (1.7%) |
Income Below Poverty Among Single-Parent Households in Oakley
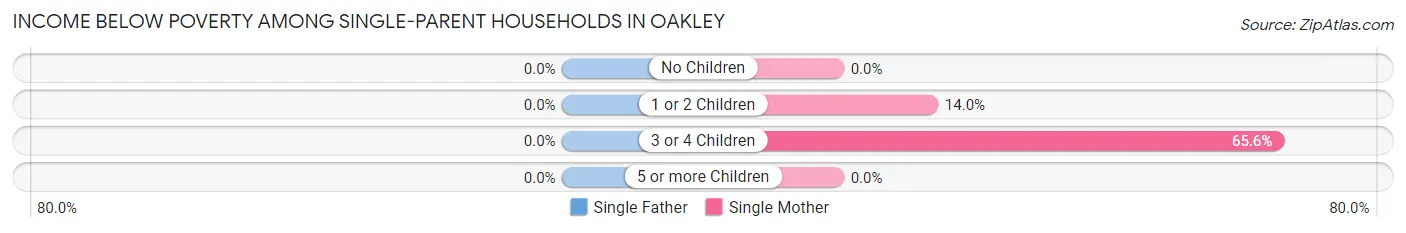
| Children | Single Father | Single Mother |
| No Children | 0 (0.0%) | 0 (0.0%) |
| 1 or 2 Children | 0 (0.0%) | 8 (14.0%) |
| 3 or 4 Children | 0 (0.0%) | 21 (65.6%) |
| 5 or more Children | 0 (0.0%) | 0 (0.0%) |
| Total | 0 (0.0%) | 29 (23.8%) |
Income Below Poverty Among Married-Couple vs Single-Parent Households in Oakley
The poverty data for Oakley shows that 8 of the married-couple family households (1.7%) and 29 of the single-parent households (19.9%) are living below the poverty level. Within the married-couple family households, those with no children have the highest poverty rate, with 8 households (2.9%) falling below the poverty line. Among the single-parent households, those with 3 or 4 children have the highest poverty rate, with 21 household (65.6%) living below poverty.
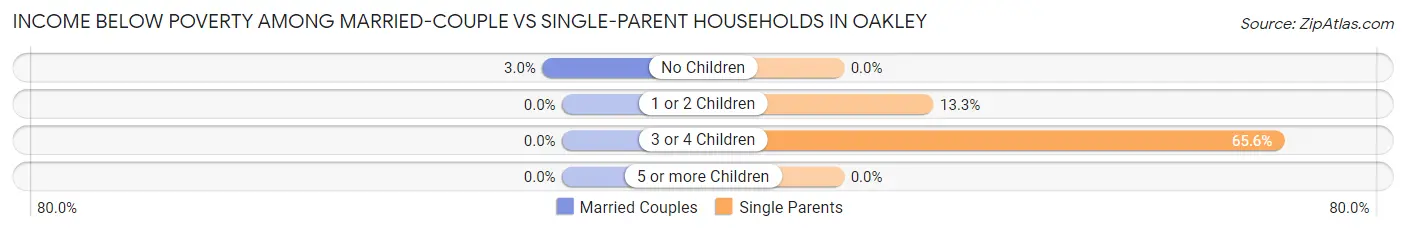
| Children | Married-Couple Families | Single-Parent Households |
| No Children | 8 (2.9%) | 0 (0.0%) |
| 1 or 2 Children | 0 (0.0%) | 8 (13.3%) |
| 3 or 4 Children | 0 (0.0%) | 21 (65.6%) |
| 5 or more Children | 0 (0.0%) | 0 (0.0%) |
| Total | 8 (1.7%) | 29 (19.9%) |
Race in Oakley
The most populous races in Oakley are White / Caucasian (1,899 | 92.0%), Hispanic or Latino (166 | 8.1%), and Two or more Races (63 | 3.0%).
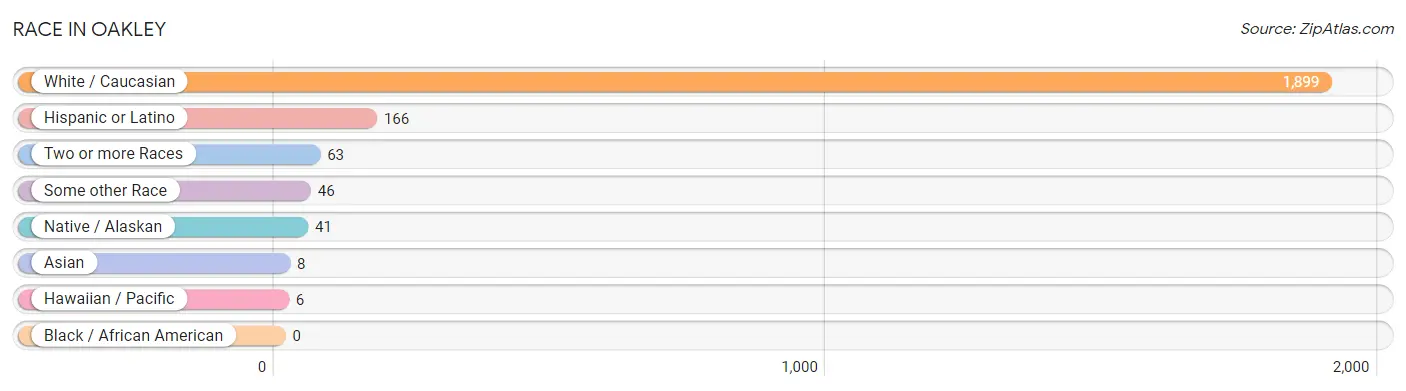
| Race | # Population | % Population |
| Asian | 8 | 0.4% |
| Black / African American | 0 | 0.0% |
| Hawaiian / Pacific | 6 | 0.3% |
| Hispanic or Latino | 166 | 8.1% |
| Native / Alaskan | 41 | 2.0% |
| White / Caucasian | 1,899 | 92.0% |
| Two or more Races | 63 | 3.0% |
| Some other Race | 46 | 2.2% |
| Total | 2,063 | 100.0% |
Ancestry in Oakley
The most populous ancestries reported in Oakley are German (576 | 27.9%), Irish (238 | 11.5%), English (186 | 9.0%), Mexican (149 | 7.2%), and American (130 | 6.3%), together accounting for 62.0% of all Oakley residents.
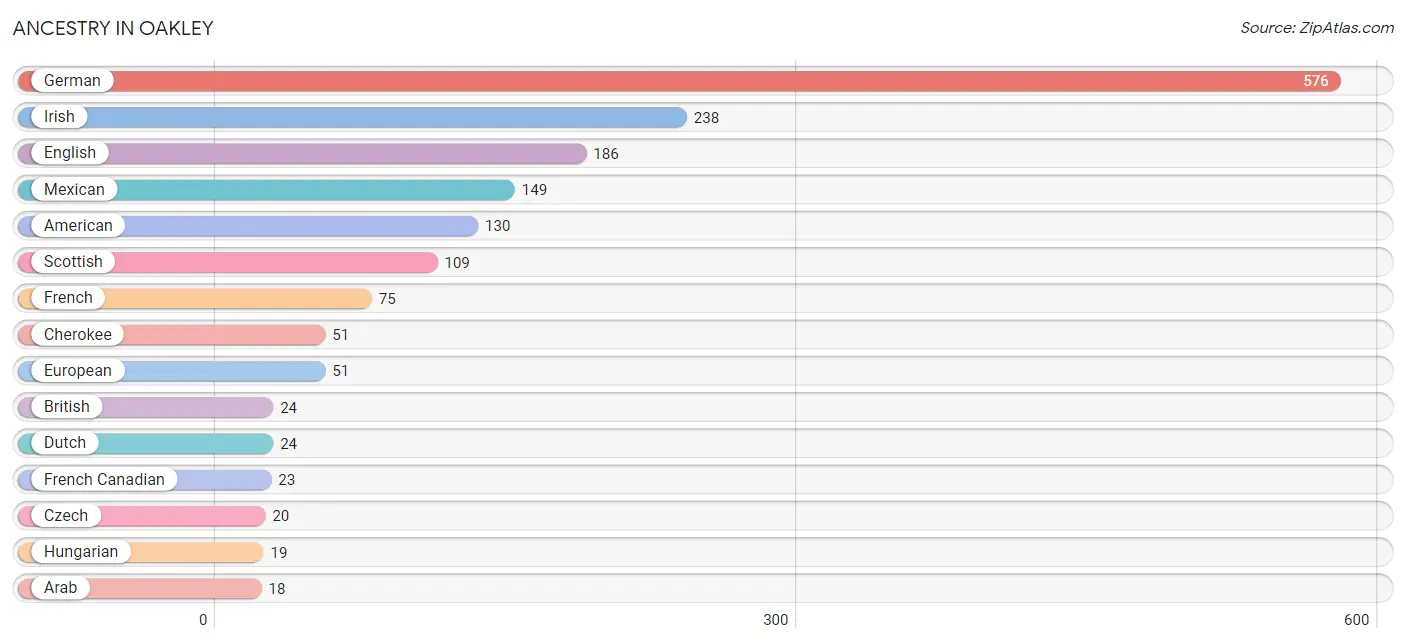
| Ancestry | # Population | % Population |
| American | 130 | 6.3% |
| Arab | 18 | 0.9% |
| Bhutanese | 2 | 0.1% |
| Blackfeet | 12 | 0.6% |
| British | 24 | 1.2% |
| Bulgarian | 15 | 0.7% |
| Cherokee | 51 | 2.5% |
| Colombian | 12 | 0.6% |
| Czech | 20 | 1.0% |
| Danish | 3 | 0.2% |
| Dutch | 24 | 1.2% |
| English | 186 | 9.0% |
| European | 51 | 2.5% |
| French | 75 | 3.6% |
| French American Indian | 1 | 0.1% |
| French Canadian | 23 | 1.1% |
| German | 576 | 27.9% |
| German Russian | 14 | 0.7% |
| Guamanian / Chamorro | 6 | 0.3% |
| Hungarian | 19 | 0.9% |
| Irish | 238 | 11.5% |
| Italian | 17 | 0.8% |
| Korean | 2 | 0.1% |
| Mexican | 149 | 7.2% |
| Navajo | 1 | 0.1% |
| Norwegian | 18 | 0.9% |
| Russian | 10 | 0.5% |
| Samoan | 2 | 0.1% |
| Scandinavian | 2 | 0.1% |
| Scotch-Irish | 4 | 0.2% |
| Scottish | 109 | 5.3% |
| South American | 12 | 0.6% |
| Spaniard | 2 | 0.1% |
| Swedish | 6 | 0.3% |
| Swiss | 1 | 0.1% |
| Syrian | 18 | 0.9% |
| Thai | 8 | 0.4% | View All 37 Rows |
Immigrants in Oakley
The most numerous immigrant groups reported in Oakley came from Central America (38 | 1.8%), Latin America (38 | 1.8%), Mexico (38 | 1.8%), Bulgaria (15 | 0.7%), and Eastern Europe (15 | 0.7%), together accounting for 7.0% of all Oakley residents.
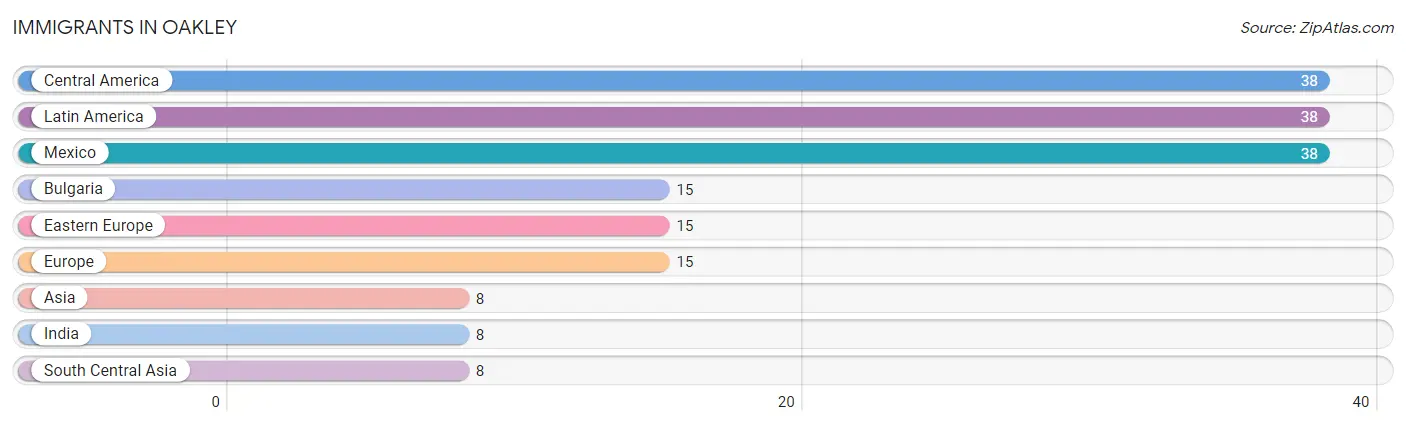
| Immigration Origin | # Population | % Population |
| Asia | 8 | 0.4% |
| Bulgaria | 15 | 0.7% |
| Central America | 38 | 1.8% |
| Eastern Europe | 15 | 0.7% |
| Europe | 15 | 0.7% |
| India | 8 | 0.4% |
| Latin America | 38 | 1.8% |
| Mexico | 38 | 1.8% |
| South Central Asia | 8 | 0.4% | View All 9 Rows |
Sex and Age in Oakley
Sex and Age in Oakley
The most populous age groups in Oakley are 35 to 39 Years (91 | 8.7%) for men and 60 to 64 Years (106 | 10.4%) for women.
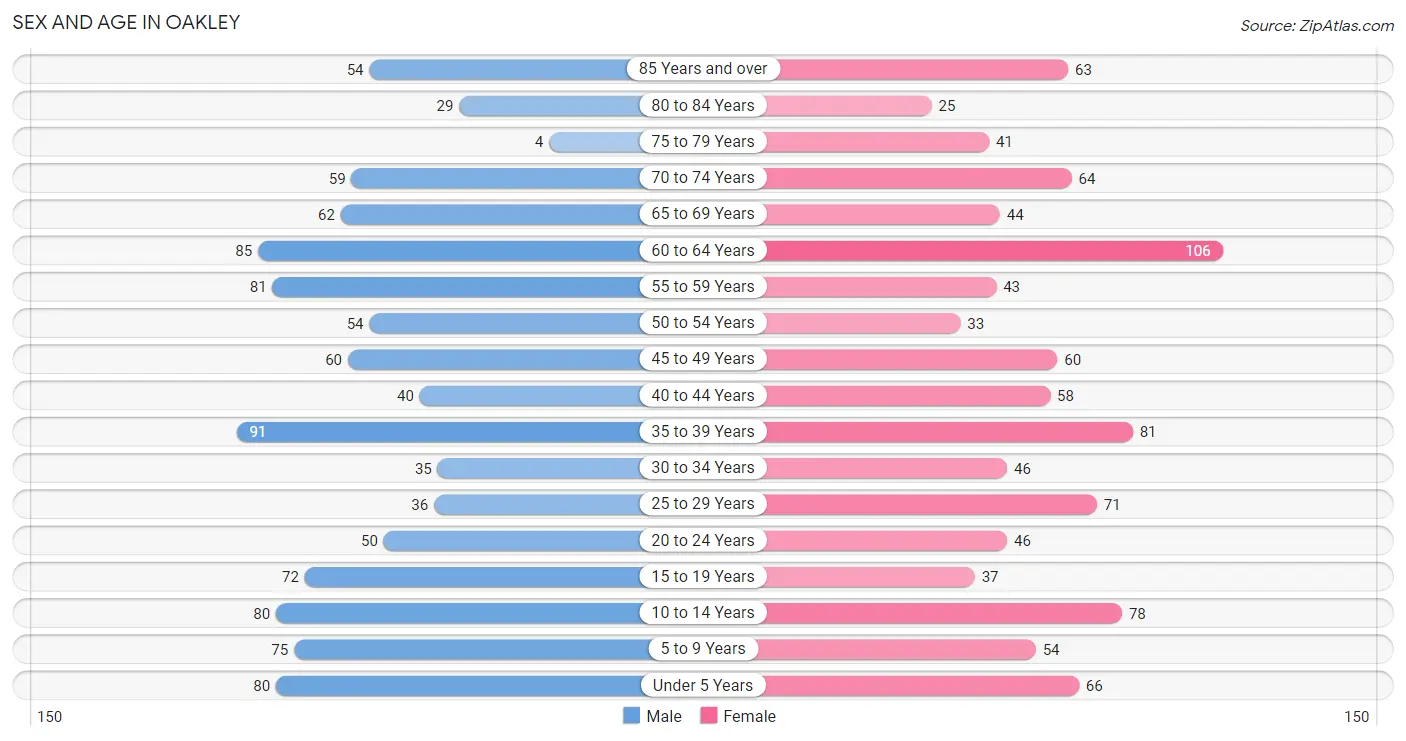
| Age Bracket | Male | Female |
| Under 5 Years | 80 (7.6%) | 66 (6.5%) |
| 5 to 9 Years | 75 (7.2%) | 54 (5.3%) |
| 10 to 14 Years | 80 (7.6%) | 78 (7.7%) |
| 15 to 19 Years | 72 (6.9%) | 37 (3.6%) |
| 20 to 24 Years | 50 (4.8%) | 46 (4.5%) |
| 25 to 29 Years | 36 (3.4%) | 71 (7.0%) |
| 30 to 34 Years | 35 (3.3%) | 46 (4.5%) |
| 35 to 39 Years | 91 (8.7%) | 81 (8.0%) |
| 40 to 44 Years | 40 (3.8%) | 58 (5.7%) |
| 45 to 49 Years | 60 (5.7%) | 60 (5.9%) |
| 50 to 54 Years | 54 (5.2%) | 33 (3.3%) |
| 55 to 59 Years | 81 (7.7%) | 43 (4.2%) |
| 60 to 64 Years | 85 (8.1%) | 106 (10.4%) |
| 65 to 69 Years | 62 (5.9%) | 44 (4.3%) |
| 70 to 74 Years | 59 (5.6%) | 64 (6.3%) |
| 75 to 79 Years | 4 (0.4%) | 41 (4.0%) |
| 80 to 84 Years | 29 (2.8%) | 25 (2.5%) |
| 85 Years and over | 54 (5.2%) | 63 (6.2%) |
| Total | 1,047 (100.0%) | 1,016 (100.0%) |
Families and Households in Oakley
Median Family Size in Oakley
The median family size in Oakley is 2.74 persons per family, with married-couple families (466 | 76.1%) accounting for the largest median family size of 2.85 persons per family. On the other hand, single male/father families (24 | 3.9%) represent the smallest median family size with 1.88 persons per family.
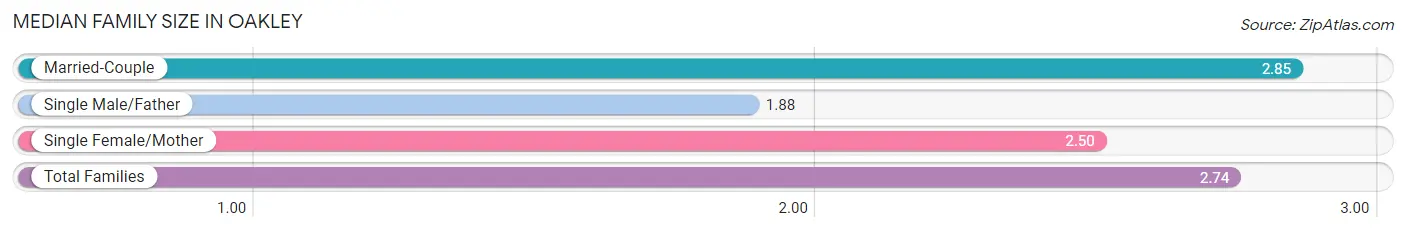
| Family Type | # Families | Family Size |
| Married-Couple | 466 (76.1%) | 2.85 |
| Single Male/Father | 24 (3.9%) | 1.88 |
| Single Female/Mother | 122 (19.9%) | 2.50 |
| Total Families | 612 (100.0%) | 2.74 |
Median Household Size in Oakley
The median household size in Oakley is 2.19 persons per household, with married-couple households (466 | 50.2%) accounting for the largest median household size of 2.85 persons per household. non-family households (317 | 34.1%) represent the smallest median household size with 1.06 persons per household.

| Household Type | # Households | Household Size |
| Married-Couple | 466 (50.2%) | 2.85 |
| Single Male/Father | 24 (2.6%) | 1.88 |
| Single Female/Mother | 122 (13.1%) | 2.66 |
| Non-family | 317 (34.1%) | 1.06 |
| Total Households | 929 (100.0%) | 2.19 |
Household Size by Marriage Status in Oakley
Out of a total of 929 households in Oakley, 612 (65.9%) are family households, while 317 (34.1%) are nonfamily households. The most numerous type of family households are 2-person households, comprising 280, and the most common type of nonfamily households are 1-person households, comprising 293.
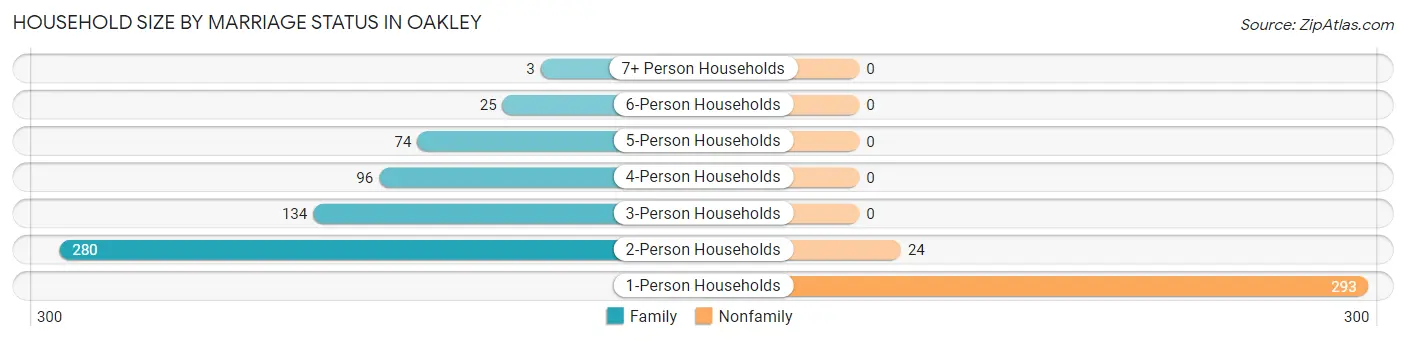
| Household Size | Family Households | Nonfamily Households |
| 1-Person Households | - | 293 (31.5%) |
| 2-Person Households | 280 (30.1%) | 24 (2.6%) |
| 3-Person Households | 134 (14.4%) | 0 (0.0%) |
| 4-Person Households | 96 (10.3%) | 0 (0.0%) |
| 5-Person Households | 74 (8.0%) | 0 (0.0%) |
| 6-Person Households | 25 (2.7%) | 0 (0.0%) |
| 7+ Person Households | 3 (0.3%) | 0 (0.0%) |
| Total | 612 (65.9%) | 317 (34.1%) |
Female Fertility in Oakley
Fertility by Age in Oakley
Average fertility rate in Oakley is 91.0 births per 1,000 women. Women in the age bracket of 35 to 50 years have the highest fertility rate with 147.0 births per 1,000 women. Women in the age bracket of 35 to 50 years acount for 84.2% of all women with births.
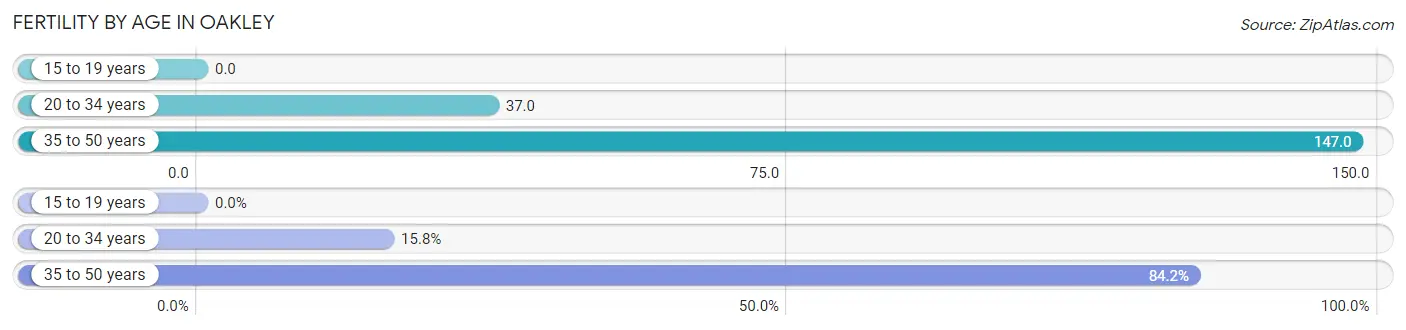
| Age Bracket | Women with Births | Births / 1,000 Women |
| 15 to 19 years | 0 (0.0%) | 0.0 |
| 20 to 34 years | 6 (15.8%) | 37.0 |
| 35 to 50 years | 32 (84.2%) | 147.0 |
| Total | 38 (100.0%) | 91.0 |
Fertility by Age by Marriage Status in Oakley
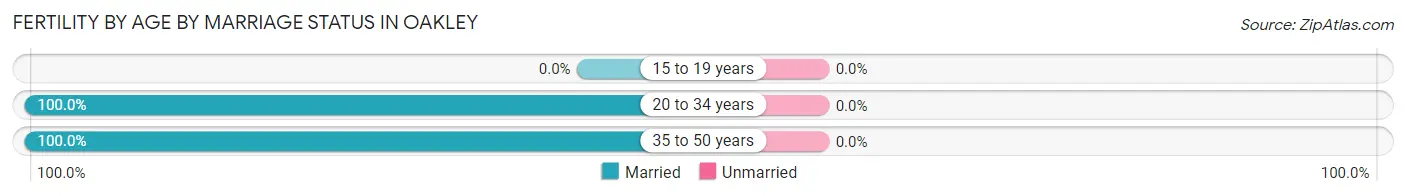
| Age Bracket | Married | Unmarried |
| 15 to 19 years | 0 (0.0%) | 0 (0.0%) |
| 20 to 34 years | 6 (100.0%) | 0 (0.0%) |
| 35 to 50 years | 32 (100.0%) | 0 (0.0%) |
| Total | 38 (100.0%) | 0 (0.0%) |
Fertility by Education in Oakley
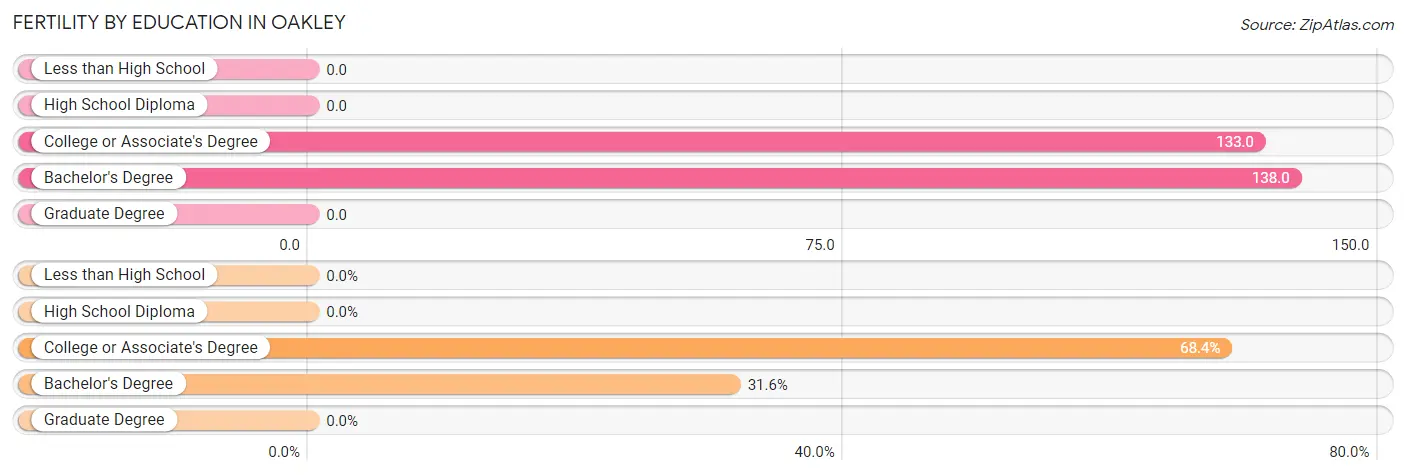
| Educational Attainment | Women with Births | Births / 1,000 Women |
| Less than High School | 0 (0.0%) | 0.0 |
| High School Diploma | 0 (0.0%) | 0.0 |
| College or Associate's Degree | 26 (68.4%) | 133.0 |
| Bachelor's Degree | 12 (31.6%) | 138.0 |
| Graduate Degree | 0 (0.0%) | 0.0 |
| Total | 38 (100.0%) | 91.0 |
Fertility by Education by Marriage Status in Oakley
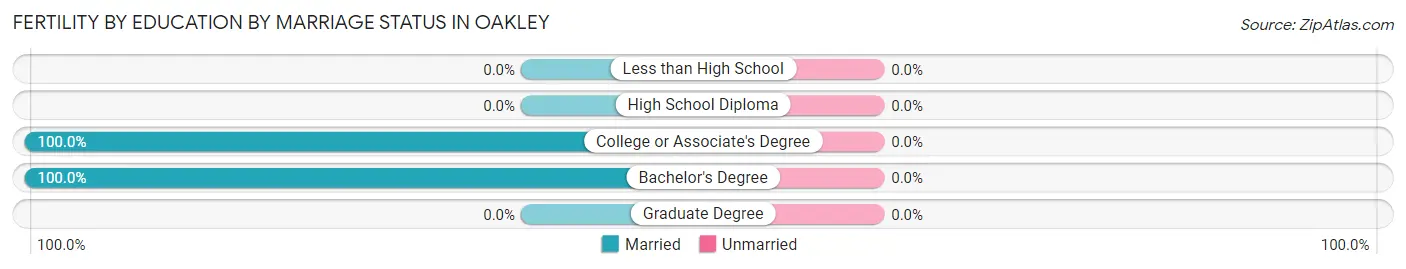
| Educational Attainment | Married | Unmarried |
| Less than High School | 0 (0.0%) | 0 (0.0%) |
| High School Diploma | 0 (0.0%) | 0 (0.0%) |
| College or Associate's Degree | 26 (100.0%) | 0 (0.0%) |
| Bachelor's Degree | 12 (100.0%) | 0 (0.0%) |
| Graduate Degree | 0 (0.0%) | 0 (0.0%) |
| Total | 38 (100.0%) | 0 (0.0%) |
Employment Characteristics in Oakley
Employment by Class of Employer in Oakley
Among the 1,062 employed individuals in Oakley, private company employees (569 | 53.6%), local government employees (144 | 13.6%), and not-for-profit organizations (135 | 12.7%) make up the most common classes of employment.
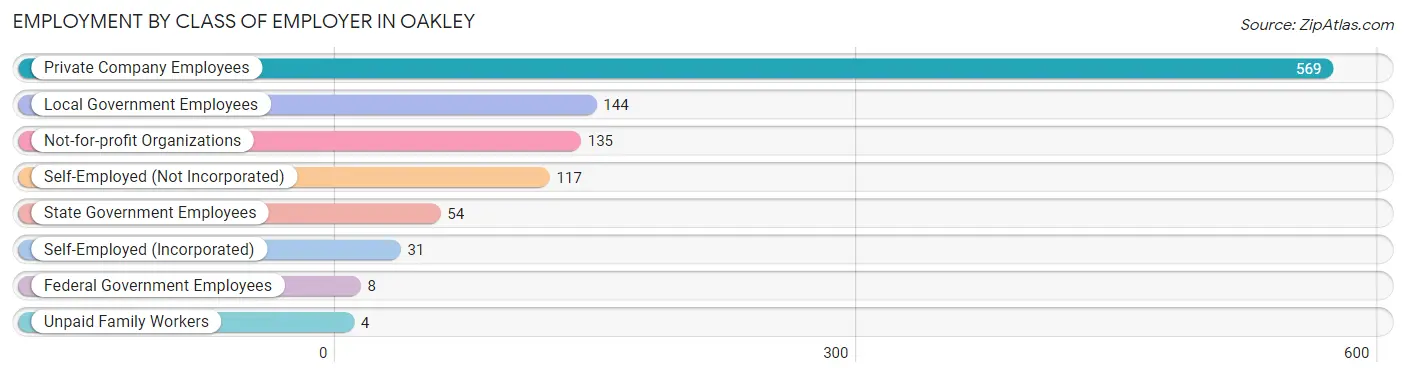
| Employer Class | # Employees | % Employees |
| Private Company Employees | 569 | 53.6% |
| Self-Employed (Incorporated) | 31 | 2.9% |
| Self-Employed (Not Incorporated) | 117 | 11.0% |
| Not-for-profit Organizations | 135 | 12.7% |
| Local Government Employees | 144 | 13.6% |
| State Government Employees | 54 | 5.1% |
| Federal Government Employees | 8 | 0.7% |
| Unpaid Family Workers | 4 | 0.4% |
| Total | 1,062 | 100.0% |
Employment Status by Age in Oakley
According to the labor force statistics for Oakley, out of the total population over 16 years of age (1,584), 67.3% or 1,066 individuals are in the labor force, with 0.3% or 3 of them unemployed. The age group with the highest labor force participation rate is 30 to 34 years, with 100.0% or 81 individuals in the labor force. Within the labor force, the 16 to 19 years age range has the highest percentage of unemployed individuals, with 5.9% or 3 of them being unemployed.
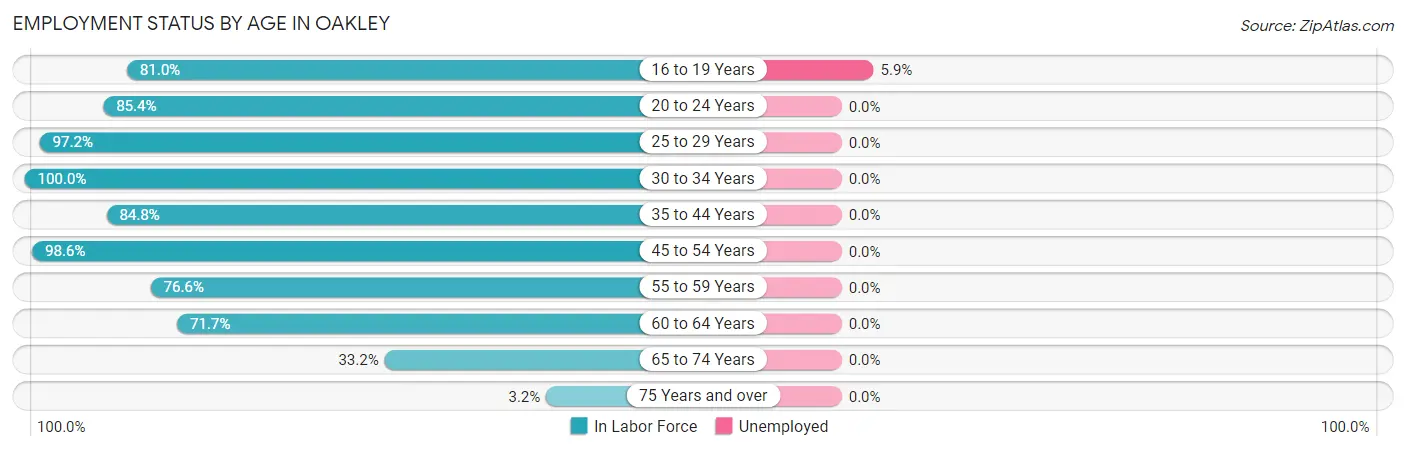
| Age Bracket | In Labor Force | Unemployed |
| 16 to 19 Years | 51 (81.0%) | 3 (5.9%) |
| 20 to 24 Years | 82 (85.4%) | 0 (0.0%) |
| 25 to 29 Years | 104 (97.2%) | 0 (0.0%) |
| 30 to 34 Years | 81 (100.0%) | 0 (0.0%) |
| 35 to 44 Years | 229 (84.8%) | 0 (0.0%) |
| 45 to 54 Years | 204 (98.6%) | 0 (0.0%) |
| 55 to 59 Years | 95 (76.6%) | 0 (0.0%) |
| 60 to 64 Years | 137 (71.7%) | 0 (0.0%) |
| 65 to 74 Years | 76 (33.2%) | 0 (0.0%) |
| 75 Years and over | 7 (3.2%) | 0 (0.0%) |
| Total | 1,066 (67.3%) | 3 (0.3%) |
Employment Status by Educational Attainment in Oakley
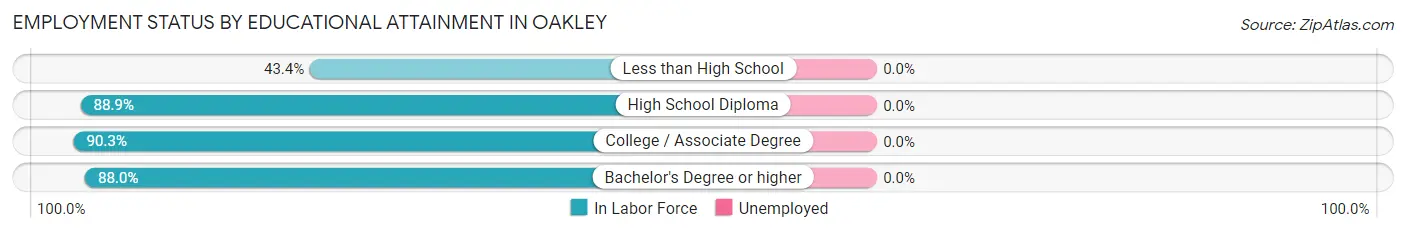
| Educational Attainment | In Labor Force | Unemployed |
| Less than High School | 23 (43.4%) | 0 (0.0%) |
| High School Diploma | 209 (88.9%) | 0 (0.0%) |
| College / Associate Degree | 346 (90.3%) | 0 (0.0%) |
| Bachelor's Degree or higher | 272 (88.0%) | 0 (0.0%) |
| Total | 850 (86.7%) | 0 (0.0%) |
Employment Occupations by Sex in Oakley
Management, Business, Science and Arts Occupations
The most common Management, Business, Science and Arts occupations in Oakley are Community & Social Service (159 | 15.0%), Management (107 | 10.1%), Education Instruction & Library (73 | 6.9%), Business & Financial (63 | 5.9%), and Health Diagnosing & Treating (47 | 4.4%).
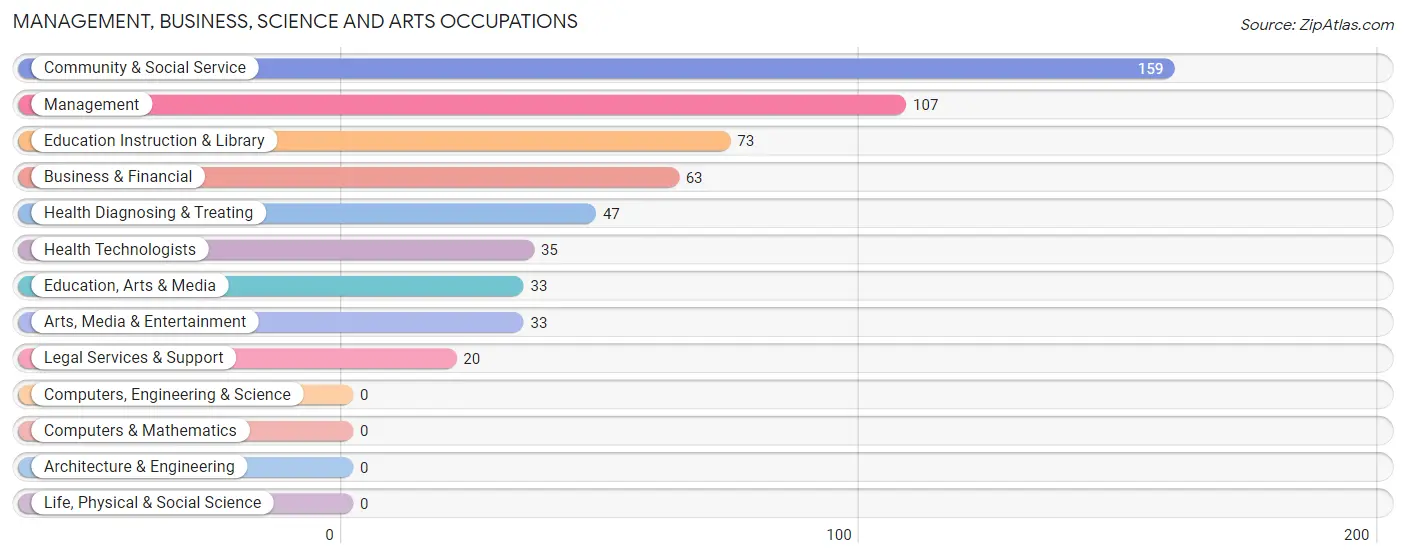
Management, Business, Science and Arts Occupations by Sex
Within the Management, Business, Science and Arts occupations in Oakley, the most male-oriented occupations are Education, Arts & Media (87.9%), Management (86.9%), and Business & Financial (42.9%), while the most female-oriented occupations are Legal Services & Support (100.0%), Education Instruction & Library (79.4%), and Health Diagnosing & Treating (70.2%).
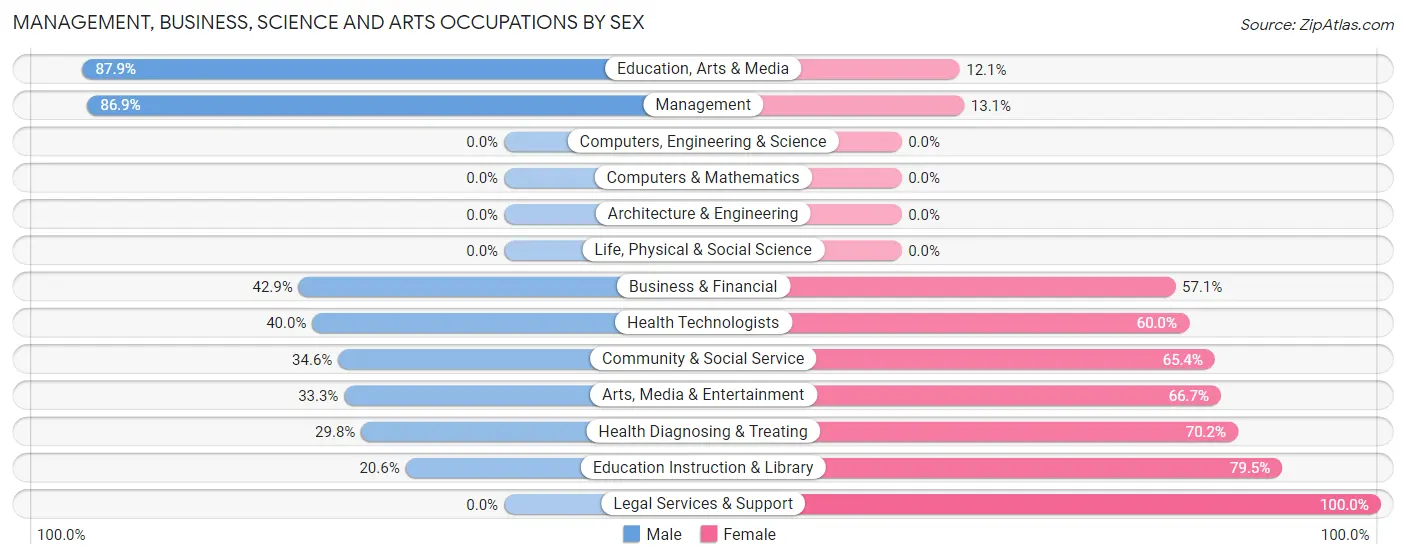
| Occupation | Male | Female |
| Management | 93 (86.9%) | 14 (13.1%) |
| Business & Financial | 27 (42.9%) | 36 (57.1%) |
| Computers, Engineering & Science | 0 (0.0%) | 0 (0.0%) |
| Computers & Mathematics | 0 (0.0%) | 0 (0.0%) |
| Architecture & Engineering | 0 (0.0%) | 0 (0.0%) |
| Life, Physical & Social Science | 0 (0.0%) | 0 (0.0%) |
| Community & Social Service | 55 (34.6%) | 104 (65.4%) |
| Education, Arts & Media | 29 (87.9%) | 4 (12.1%) |
| Legal Services & Support | 0 (0.0%) | 20 (100.0%) |
| Education Instruction & Library | 15 (20.5%) | 58 (79.4%) |
| Arts, Media & Entertainment | 11 (33.3%) | 22 (66.7%) |
| Health Diagnosing & Treating | 14 (29.8%) | 33 (70.2%) |
| Health Technologists | 14 (40.0%) | 21 (60.0%) |
| Total (Category) | 189 (50.3%) | 187 (49.7%) |
| Total (Overall) | 572 (53.8%) | 491 (46.2%) |
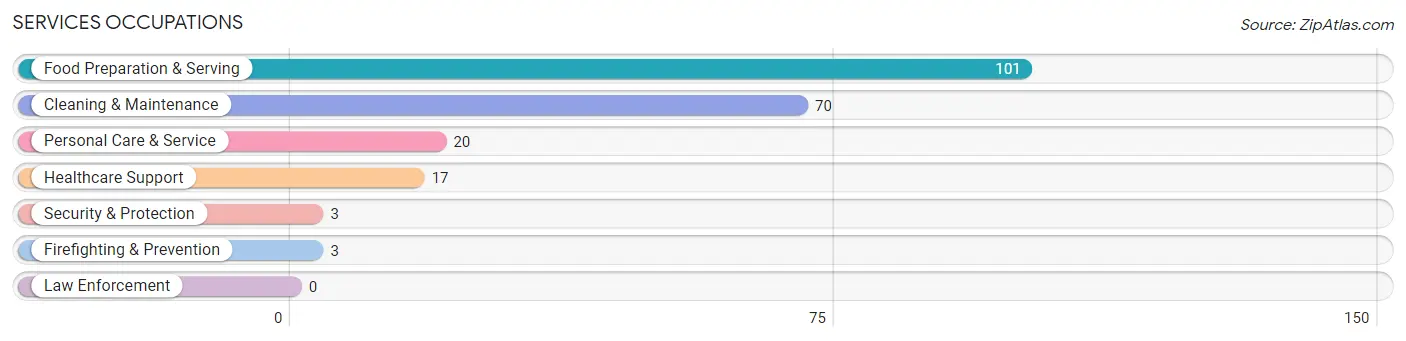
Services Occupations
The most common Services occupations in Oakley are Food Preparation & Serving (101 | 9.5%), Cleaning & Maintenance (70 | 6.6%), Personal Care & Service (20 | 1.9%), Healthcare Support (17 | 1.6%), and Security & Protection (3 | 0.3%).
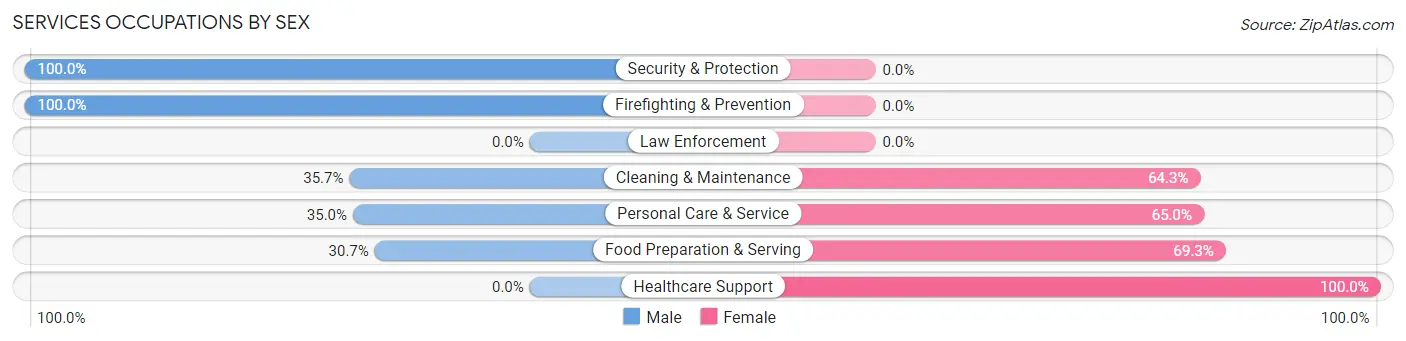
Services Occupations by Sex
Within the Services occupations in Oakley, the most male-oriented occupations are Security & Protection (100.0%), Firefighting & Prevention (100.0%), and Cleaning & Maintenance (35.7%), while the most female-oriented occupations are Healthcare Support (100.0%), Food Preparation & Serving (69.3%), and Personal Care & Service (65.0%).
| Occupation | Male | Female |
| Healthcare Support | 0 (0.0%) | 17 (100.0%) |
| Security & Protection | 3 (100.0%) | 0 (0.0%) |
| Firefighting & Prevention | 3 (100.0%) | 0 (0.0%) |
| Law Enforcement | 0 (0.0%) | 0 (0.0%) |
| Food Preparation & Serving | 31 (30.7%) | 70 (69.3%) |
| Cleaning & Maintenance | 25 (35.7%) | 45 (64.3%) |
| Personal Care & Service | 7 (35.0%) | 13 (65.0%) |
| Total (Category) | 66 (31.3%) | 145 (68.7%) |
| Total (Overall) | 572 (53.8%) | 491 (46.2%) |
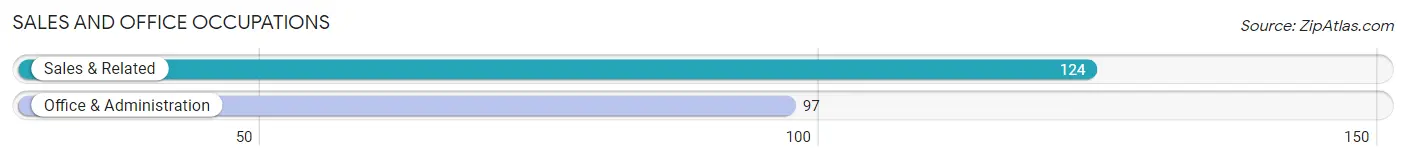
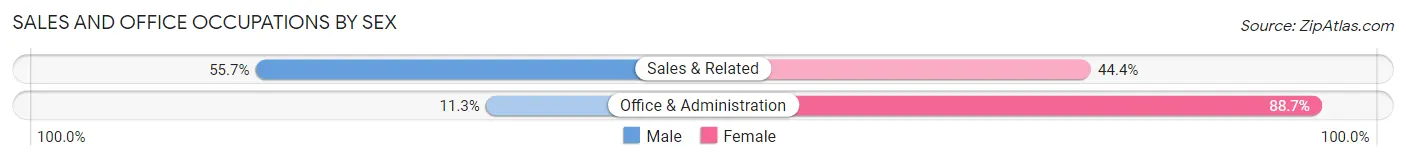
Sales and Office Occupations
The most common Sales and Office occupations in Oakley are Sales & Related (124 | 11.7%), and Office & Administration (97 | 9.1%).
Sales and Office Occupations by Sex
| Occupation | Male | Female |
| Sales & Related | 69 (55.6%) | 55 (44.4%) |
| Office & Administration | 11 (11.3%) | 86 (88.7%) |
| Total (Category) | 80 (36.2%) | 141 (63.8%) |
| Total (Overall) | 572 (53.8%) | 491 (46.2%) |
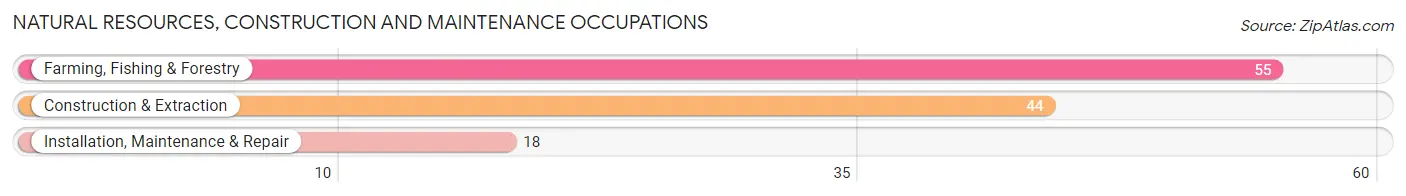
Natural Resources, Construction and Maintenance Occupations
The most common Natural Resources, Construction and Maintenance occupations in Oakley are Farming, Fishing & Forestry (55 | 5.2%), Construction & Extraction (44 | 4.1%), and Installation, Maintenance & Repair (18 | 1.7%).
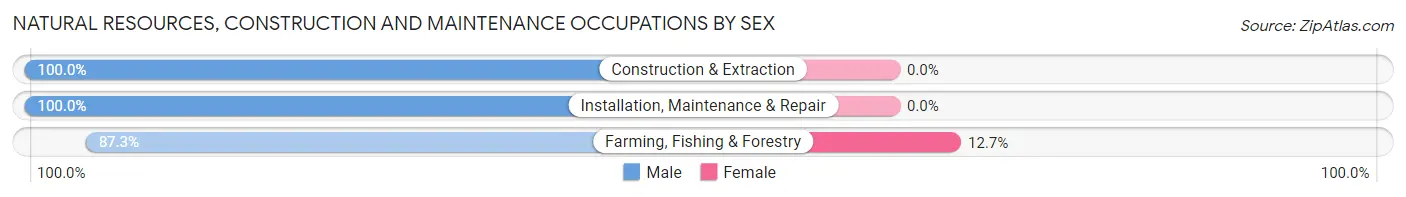
Natural Resources, Construction and Maintenance Occupations by Sex
| Occupation | Male | Female |
| Farming, Fishing & Forestry | 48 (87.3%) | 7 (12.7%) |
| Construction & Extraction | 44 (100.0%) | 0 (0.0%) |
| Installation, Maintenance & Repair | 18 (100.0%) | 0 (0.0%) |
| Total (Category) | 110 (94.0%) | 7 (6.0%) |
| Total (Overall) | 572 (53.8%) | 491 (46.2%) |
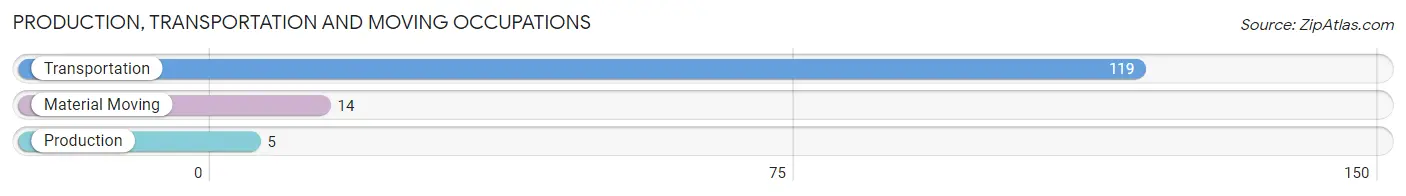
Production, Transportation and Moving Occupations
The most common Production, Transportation and Moving occupations in Oakley are Transportation (119 | 11.2%), Material Moving (14 | 1.3%), and Production (5 | 0.5%).
Production, Transportation and Moving Occupations by Sex
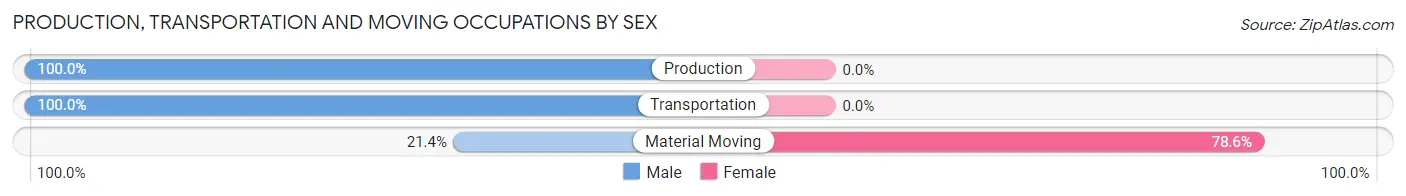
| Occupation | Male | Female |
| Production | 5 (100.0%) | 0 (0.0%) |
| Transportation | 119 (100.0%) | 0 (0.0%) |
| Material Moving | 3 (21.4%) | 11 (78.6%) |
| Total (Category) | 127 (92.0%) | 11 (8.0%) |
| Total (Overall) | 572 (53.8%) | 491 (46.2%) |
Employment Industries by Sex in Oakley
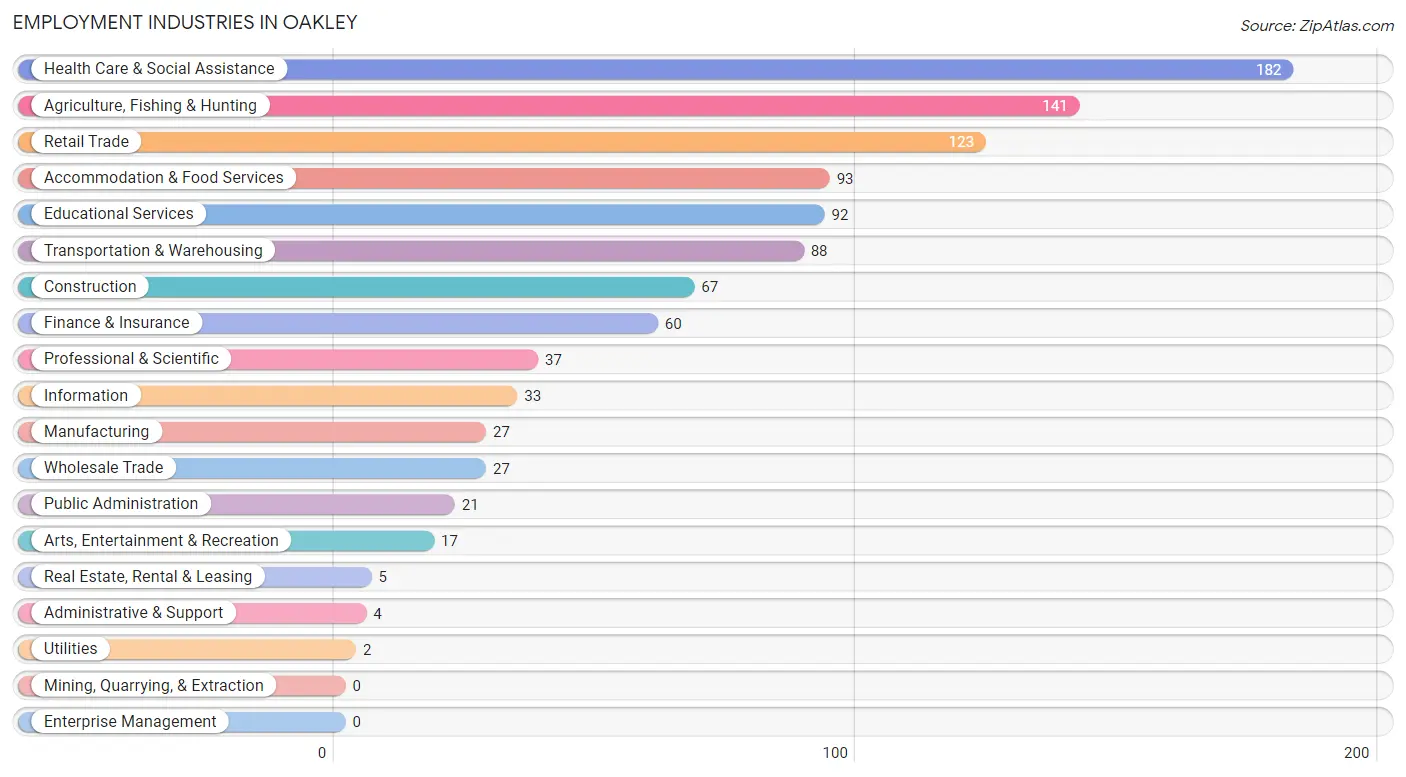
Employment Industries in Oakley
The major employment industries in Oakley include Health Care & Social Assistance (182 | 17.1%), Agriculture, Fishing & Hunting (141 | 13.3%), Retail Trade (123 | 11.6%), Accommodation & Food Services (93 | 8.7%), and Educational Services (92 | 8.6%).
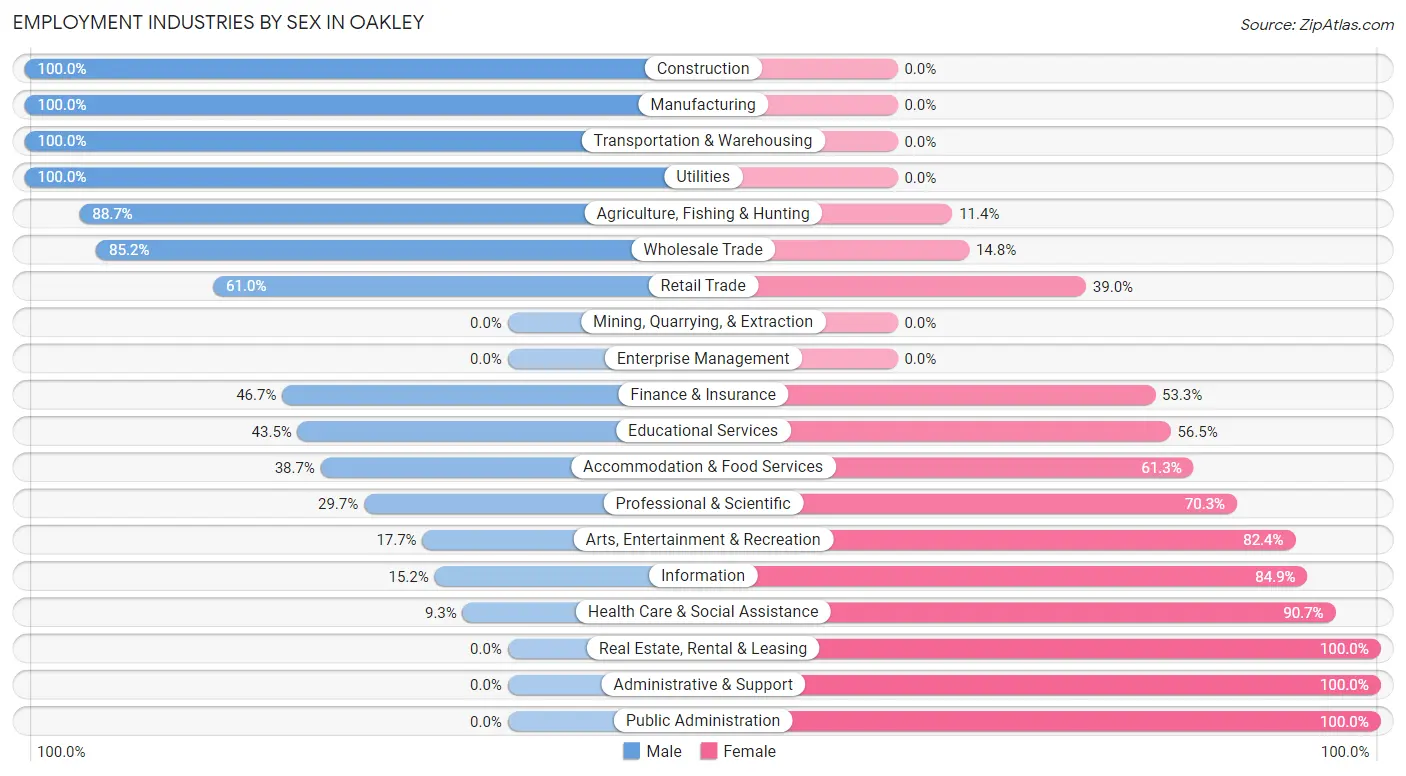
Employment Industries by Sex in Oakley
The Oakley industries that see more men than women are Construction (100.0%), Manufacturing (100.0%), and Transportation & Warehousing (100.0%), whereas the industries that tend to have a higher number of women are Real Estate, Rental & Leasing (100.0%), Administrative & Support (100.0%), and Public Administration (100.0%).
| Industry | Male | Female |
| Agriculture, Fishing & Hunting | 125 (88.6%) | 16 (11.4%) |
| Mining, Quarrying, & Extraction | 0 (0.0%) | 0 (0.0%) |
| Construction | 67 (100.0%) | 0 (0.0%) |
| Manufacturing | 27 (100.0%) | 0 (0.0%) |
| Wholesale Trade | 23 (85.2%) | 4 (14.8%) |
| Retail Trade | 75 (61.0%) | 48 (39.0%) |
| Transportation & Warehousing | 88 (100.0%) | 0 (0.0%) |
| Utilities | 2 (100.0%) | 0 (0.0%) |
| Information | 5 (15.1%) | 28 (84.9%) |
| Finance & Insurance | 28 (46.7%) | 32 (53.3%) |
| Real Estate, Rental & Leasing | 0 (0.0%) | 5 (100.0%) |
| Professional & Scientific | 11 (29.7%) | 26 (70.3%) |
| Enterprise Management | 0 (0.0%) | 0 (0.0%) |
| Administrative & Support | 0 (0.0%) | 4 (100.0%) |
| Educational Services | 40 (43.5%) | 52 (56.5%) |
| Health Care & Social Assistance | 17 (9.3%) | 165 (90.7%) |
| Arts, Entertainment & Recreation | 3 (17.6%) | 14 (82.4%) |
| Accommodation & Food Services | 36 (38.7%) | 57 (61.3%) |
| Public Administration | 0 (0.0%) | 21 (100.0%) |
| Total | 572 (53.8%) | 491 (46.2%) |
Education in Oakley
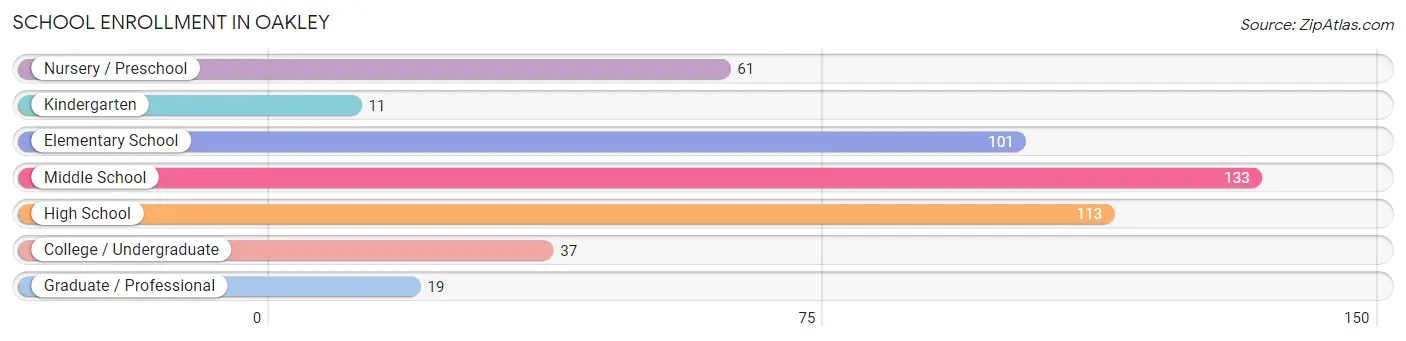
School Enrollment in Oakley
The most common levels of schooling among the 475 students in Oakley are middle school (133 | 28.0%), high school (113 | 23.8%), and elementary school (101 | 21.3%).
| School Level | # Students | % Students |
| Nursery / Preschool | 61 | 12.8% |
| Kindergarten | 11 | 2.3% |
| Elementary School | 101 | 21.3% |
| Middle School | 133 | 28.0% |
| High School | 113 | 23.8% |
| College / Undergraduate | 37 | 7.8% |
| Graduate / Professional | 19 | 4.0% |
| Total | 475 | 100.0% |
School Enrollment by Age by Funding Source in Oakley
Out of a total of 475 students who are enrolled in schools in Oakley, 38 (8.0%) attend a private institution, while the remaining 437 (92.0%) are enrolled in public schools. The age group of 35 years and over has the highest likelihood of being enrolled in private schools, with 18 (64.3% in the age bracket) enrolled. Conversely, the age group of 15 to 17 year olds has the lowest likelihood of being enrolled in a private school, with 77 (100.0% in the age bracket) attending a public institution.
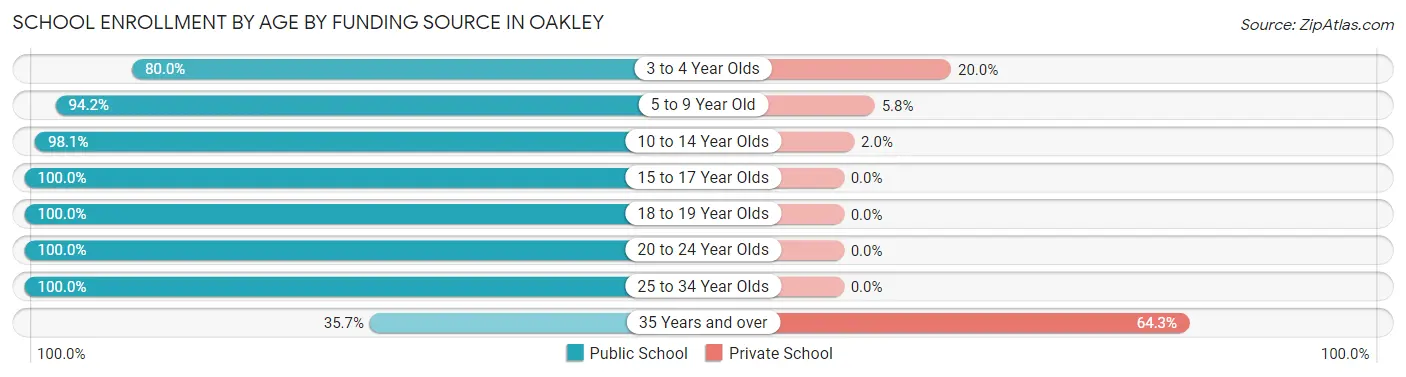
| Age Bracket | Public School | Private School |
| 3 to 4 Year Olds | 40 (80.0%) | 10 (20.0%) |
| 5 to 9 Year Old | 114 (94.2%) | 7 (5.8%) |
| 10 to 14 Year Olds | 151 (98.1%) | 3 (1.9%) |
| 15 to 17 Year Olds | 77 (100.0%) | 0 (0.0%) |
| 18 to 19 Year Olds | 20 (100.0%) | 0 (0.0%) |
| 20 to 24 Year Olds | 12 (100.0%) | 0 (0.0%) |
| 25 to 34 Year Olds | 13 (100.0%) | 0 (0.0%) |
| 35 Years and over | 10 (35.7%) | 18 (64.3%) |
| Total | 437 (92.0%) | 38 (8.0%) |
Educational Attainment by Field of Study in Oakley
Business (107 | 27.1%), education (75 | 19.0%), liberal arts & history (50 | 12.7%), social sciences (37 | 9.4%), and bio, nature & agricultural (35 | 8.9%) are the most common fields of study among 395 individuals in Oakley who have obtained a bachelor's degree or higher.
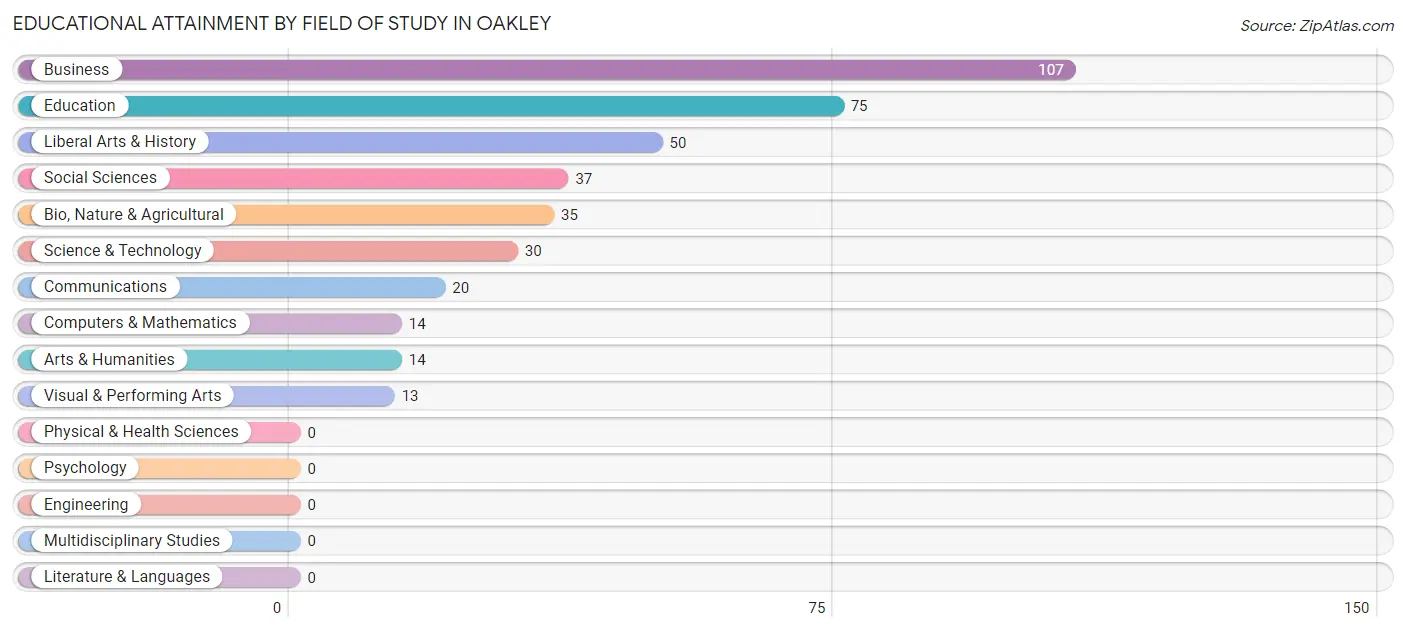
| Field of Study | # Graduates | % Graduates |
| Computers & Mathematics | 14 | 3.5% |
| Bio, Nature & Agricultural | 35 | 8.9% |
| Physical & Health Sciences | 0 | 0.0% |
| Psychology | 0 | 0.0% |
| Social Sciences | 37 | 9.4% |
| Engineering | 0 | 0.0% |
| Multidisciplinary Studies | 0 | 0.0% |
| Science & Technology | 30 | 7.6% |
| Business | 107 | 27.1% |
| Education | 75 | 19.0% |
| Literature & Languages | 0 | 0.0% |
| Liberal Arts & History | 50 | 12.7% |
| Visual & Performing Arts | 13 | 3.3% |
| Communications | 20 | 5.1% |
| Arts & Humanities | 14 | 3.5% |
| Total | 395 | 100.0% |
Transportation & Commute in Oakley
Vehicle Availability by Sex in Oakley
The most prevalent vehicle ownership categories in Oakley are males with 3 vehicles (198, accounting for 34.7%) and females with 3 vehicles (104, making up 40.3%).
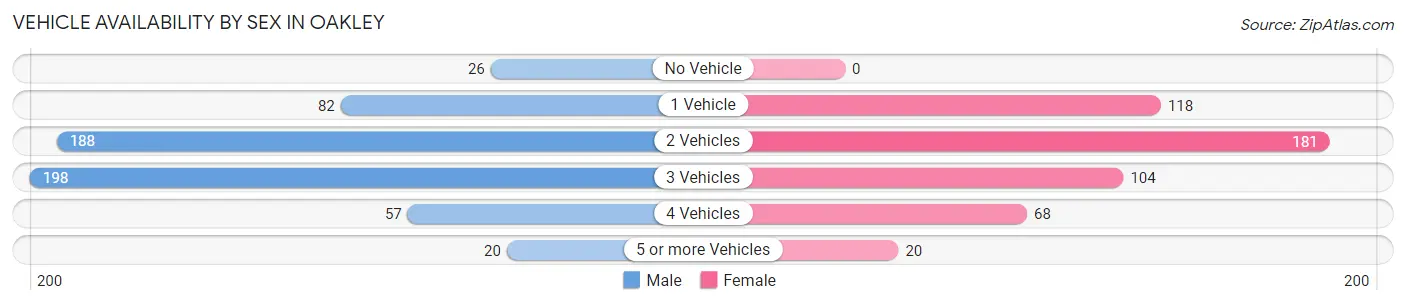
| Vehicles Available | Male | Female |
| No Vehicle | 26 (4.5%) | 0 (0.0%) |
| 1 Vehicle | 82 (14.4%) | 118 (24.0%) |
| 2 Vehicles | 188 (32.9%) | 181 (36.9%) |
| 3 Vehicles | 198 (34.7%) | 104 (21.2%) |
| 4 Vehicles | 57 (10.0%) | 68 (13.9%) |
| 5 or more Vehicles | 20 (3.5%) | 20 (4.1%) |
| Total | 571 (100.0%) | 491 (100.0%) |
Commute Time in Oakley
The most frequently occuring commute durations in Oakley are 5 to 9 minutes (320 commuters, 33.0%), less than 5 minutes (176 commuters, 18.1%), and 10 to 14 minutes (127 commuters, 13.1%).
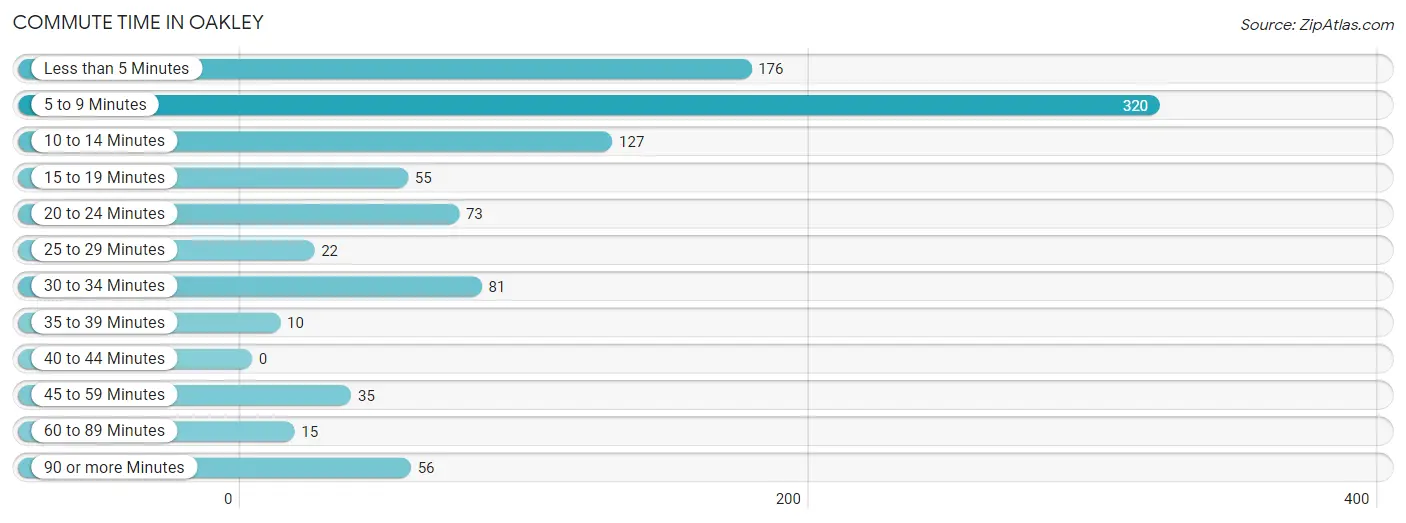
| Commute Time | # Commuters | % Commuters |
| Less than 5 Minutes | 176 | 18.1% |
| 5 to 9 Minutes | 320 | 33.0% |
| 10 to 14 Minutes | 127 | 13.1% |
| 15 to 19 Minutes | 55 | 5.7% |
| 20 to 24 Minutes | 73 | 7.5% |
| 25 to 29 Minutes | 22 | 2.3% |
| 30 to 34 Minutes | 81 | 8.4% |
| 35 to 39 Minutes | 10 | 1.0% |
| 40 to 44 Minutes | 0 | 0.0% |
| 45 to 59 Minutes | 35 | 3.6% |
| 60 to 89 Minutes | 15 | 1.5% |
| 90 or more Minutes | 56 | 5.8% |
Commute Time by Sex in Oakley
The most common commute times in Oakley are 5 to 9 minutes (167 commuters, 33.9%) for males and 5 to 9 minutes (153 commuters, 32.1%) for females.
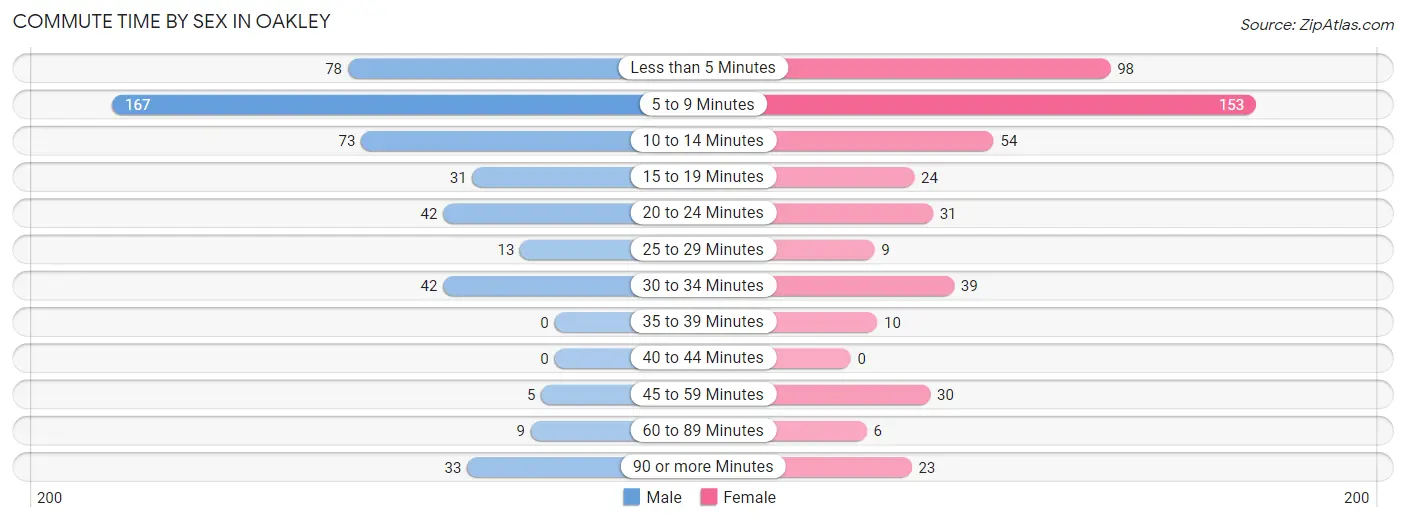
| Commute Time | Male | Female |
| Less than 5 Minutes | 78 (15.8%) | 98 (20.5%) |
| 5 to 9 Minutes | 167 (33.9%) | 153 (32.1%) |
| 10 to 14 Minutes | 73 (14.8%) | 54 (11.3%) |
| 15 to 19 Minutes | 31 (6.3%) | 24 (5.0%) |
| 20 to 24 Minutes | 42 (8.5%) | 31 (6.5%) |
| 25 to 29 Minutes | 13 (2.6%) | 9 (1.9%) |
| 30 to 34 Minutes | 42 (8.5%) | 39 (8.2%) |
| 35 to 39 Minutes | 0 (0.0%) | 10 (2.1%) |
| 40 to 44 Minutes | 0 (0.0%) | 0 (0.0%) |
| 45 to 59 Minutes | 5 (1.0%) | 30 (6.3%) |
| 60 to 89 Minutes | 9 (1.8%) | 6 (1.3%) |
| 90 or more Minutes | 33 (6.7%) | 23 (4.8%) |
Time of Departure to Work by Sex in Oakley
The most frequent times of departure to work in Oakley are 7:00 AM to 7:29 AM (98, 19.9%) for males and 7:30 AM to 7:59 AM (90, 18.9%) for females.
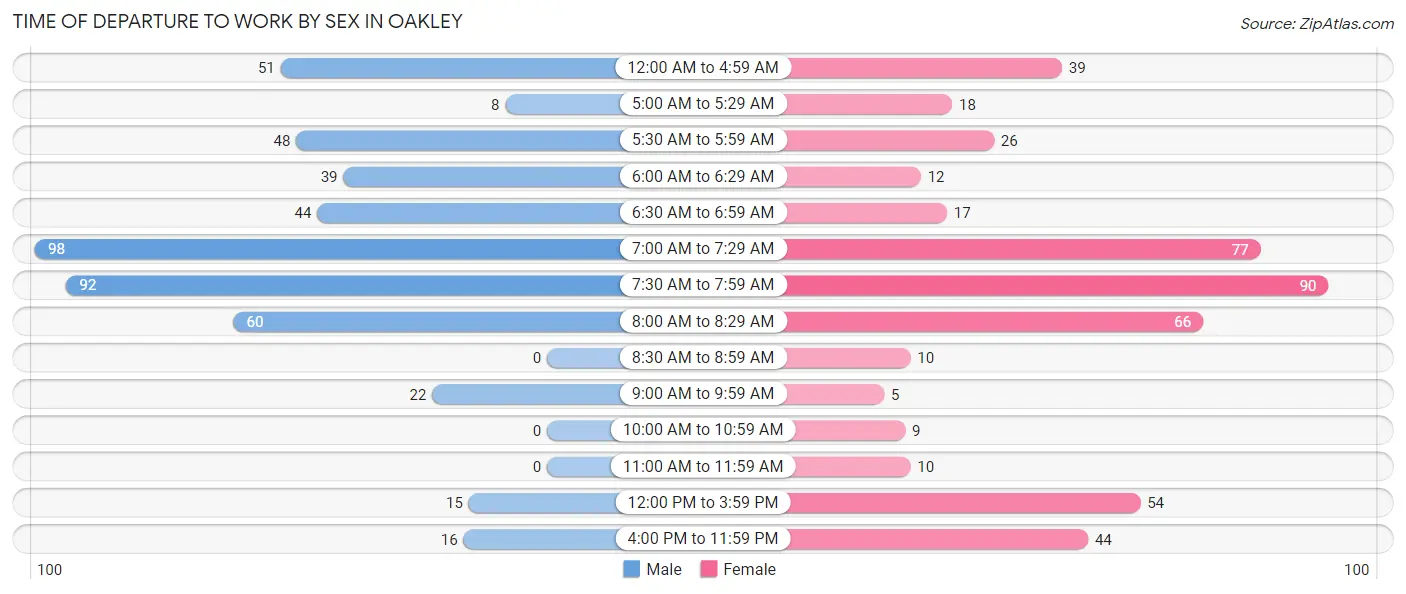
| Time of Departure | Male | Female |
| 12:00 AM to 4:59 AM | 51 (10.3%) | 39 (8.2%) |
| 5:00 AM to 5:29 AM | 8 (1.6%) | 18 (3.8%) |
| 5:30 AM to 5:59 AM | 48 (9.7%) | 26 (5.4%) |
| 6:00 AM to 6:29 AM | 39 (7.9%) | 12 (2.5%) |
| 6:30 AM to 6:59 AM | 44 (8.9%) | 17 (3.6%) |
| 7:00 AM to 7:29 AM | 98 (19.9%) | 77 (16.1%) |
| 7:30 AM to 7:59 AM | 92 (18.7%) | 90 (18.9%) |
| 8:00 AM to 8:29 AM | 60 (12.2%) | 66 (13.8%) |
| 8:30 AM to 8:59 AM | 0 (0.0%) | 10 (2.1%) |
| 9:00 AM to 9:59 AM | 22 (4.5%) | 5 (1.1%) |
| 10:00 AM to 10:59 AM | 0 (0.0%) | 9 (1.9%) |
| 11:00 AM to 11:59 AM | 0 (0.0%) | 10 (2.1%) |
| 12:00 PM to 3:59 PM | 15 (3.0%) | 54 (11.3%) |
| 4:00 PM to 11:59 PM | 16 (3.3%) | 44 (9.2%) |
| Total | 493 (100.0%) | 477 (100.0%) |
Housing Occupancy in Oakley
Occupancy by Ownership in Oakley
Of the total 929 dwellings in Oakley, owner-occupied units account for 581 (62.5%), while renter-occupied units make up 348 (37.5%).

| Occupancy | # Housing Units | % Housing Units |
| Owner Occupied Housing Units | 581 | 62.5% |
| Renter-Occupied Housing Units | 348 | 37.5% |
| Total Occupied Housing Units | 929 | 100.0% |
Occupancy by Household Size in Oakley
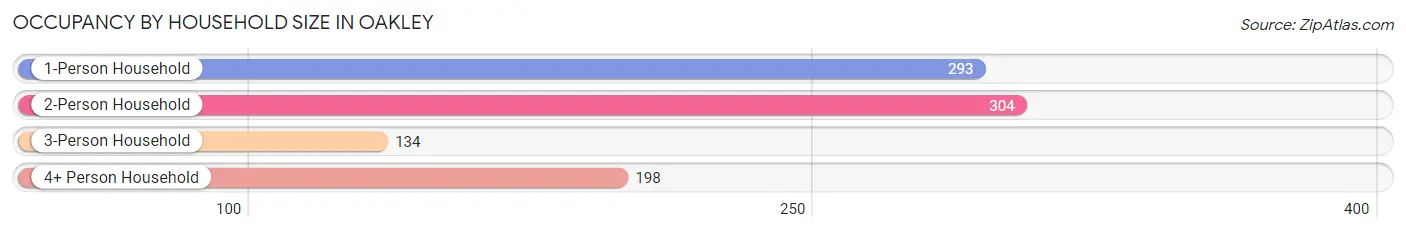
| Household Size | # Housing Units | % Housing Units |
| 1-Person Household | 293 | 31.5% |
| 2-Person Household | 304 | 32.7% |
| 3-Person Household | 134 | 14.4% |
| 4+ Person Household | 198 | 21.3% |
| Total Housing Units | 929 | 100.0% |
Occupancy by Ownership by Household Size in Oakley
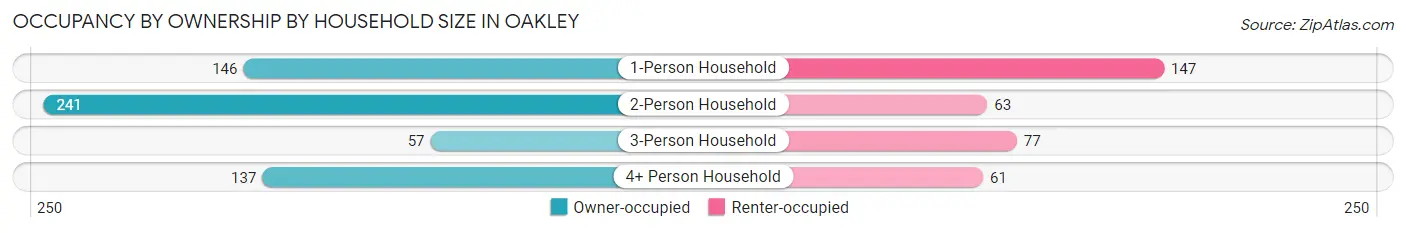
| Household Size | Owner-occupied | Renter-occupied |
| 1-Person Household | 146 (49.8%) | 147 (50.2%) |
| 2-Person Household | 241 (79.3%) | 63 (20.7%) |
| 3-Person Household | 57 (42.5%) | 77 (57.5%) |
| 4+ Person Household | 137 (69.2%) | 61 (30.8%) |
| Total Housing Units | 581 (62.5%) | 348 (37.5%) |
Occupancy by Educational Attainment in Oakley
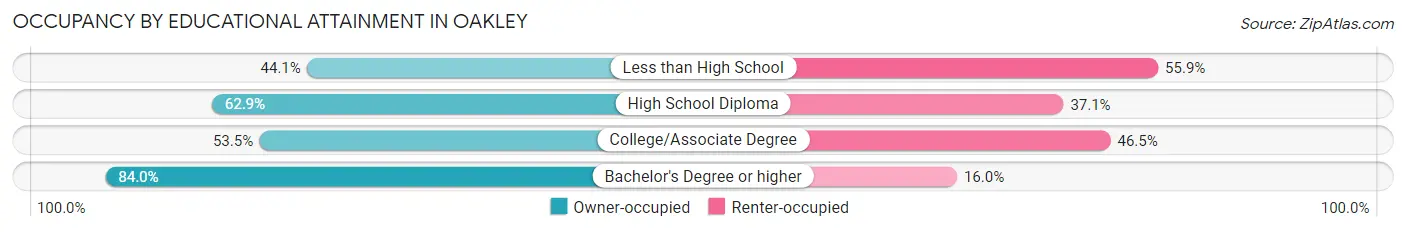
| Household Size | Owner-occupied | Renter-occupied |
| Less than High School | 41 (44.1%) | 52 (55.9%) |
| High School Diploma | 149 (62.9%) | 88 (37.1%) |
| College/Associate Degree | 197 (53.5%) | 171 (46.5%) |
| Bachelor's Degree or higher | 194 (84.0%) | 37 (16.0%) |
Occupancy by Age of Householder in Oakley
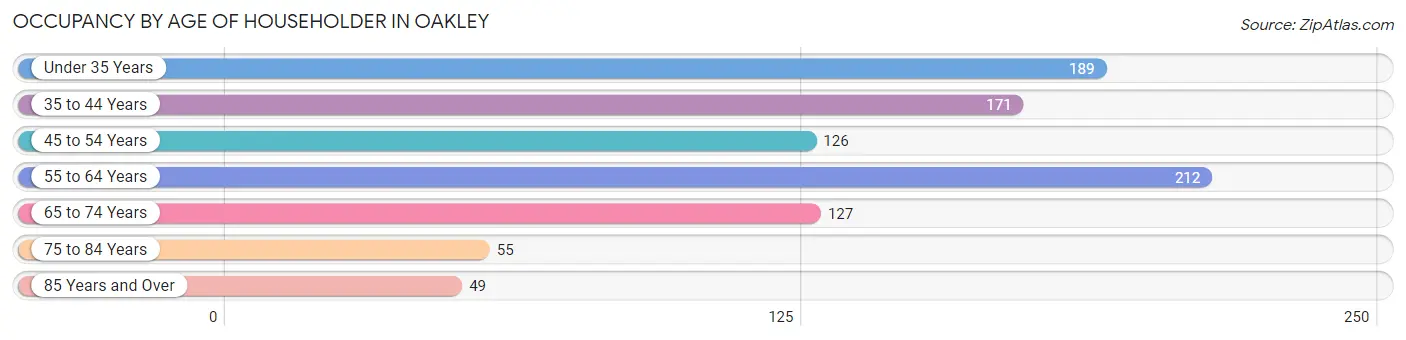
| Age Bracket | # Households | % Households |
| Under 35 Years | 189 | 20.3% |
| 35 to 44 Years | 171 | 18.4% |
| 45 to 54 Years | 126 | 13.6% |
| 55 to 64 Years | 212 | 22.8% |
| 65 to 74 Years | 127 | 13.7% |
| 75 to 84 Years | 55 | 5.9% |
| 85 Years and Over | 49 | 5.3% |
| Total | 929 | 100.0% |
Housing Finances in Oakley
Median Income by Occupancy in Oakley
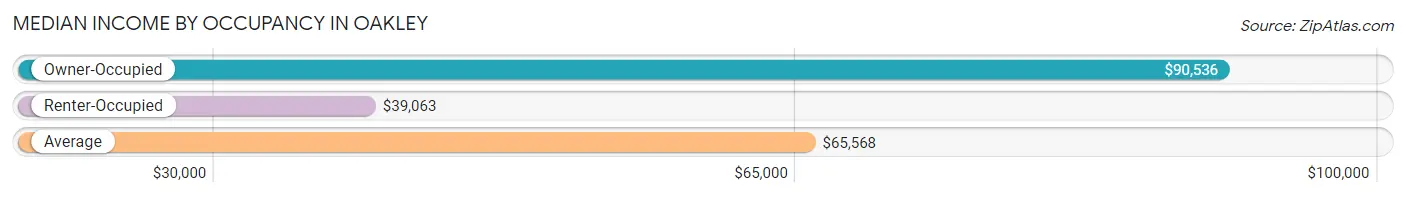
| Occupancy Type | # Households | Median Income |
| Owner-Occupied | 581 (62.5%) | $90,536 |
| Renter-Occupied | 348 (37.5%) | $39,063 |
| Average | 929 (100.0%) | $65,568 |
Occupancy by Householder Income Bracket in Oakley
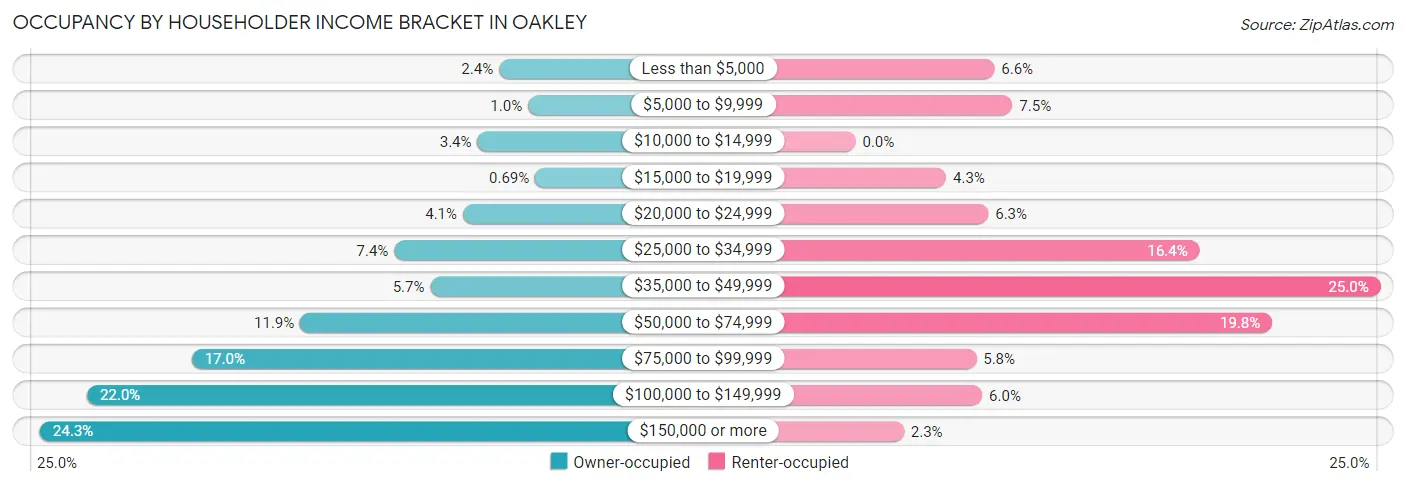
| Income Bracket | Owner-occupied | Renter-occupied |
| Less than $5,000 | 14 (2.4%) | 23 (6.6%) |
| $5,000 to $9,999 | 6 (1.0%) | 26 (7.5%) |
| $10,000 to $14,999 | 20 (3.4%) | 0 (0.0%) |
| $15,000 to $19,999 | 4 (0.7%) | 15 (4.3%) |
| $20,000 to $24,999 | 24 (4.1%) | 22 (6.3%) |
| $25,000 to $34,999 | 43 (7.4%) | 57 (16.4%) |
| $35,000 to $49,999 | 33 (5.7%) | 87 (25.0%) |
| $50,000 to $74,999 | 69 (11.9%) | 69 (19.8%) |
| $75,000 to $99,999 | 99 (17.0%) | 20 (5.8%) |
| $100,000 to $149,999 | 128 (22.0%) | 21 (6.0%) |
| $150,000 or more | 141 (24.3%) | 8 (2.3%) |
| Total | 581 (100.0%) | 348 (100.0%) |
Monthly Housing Cost Tiers in Oakley
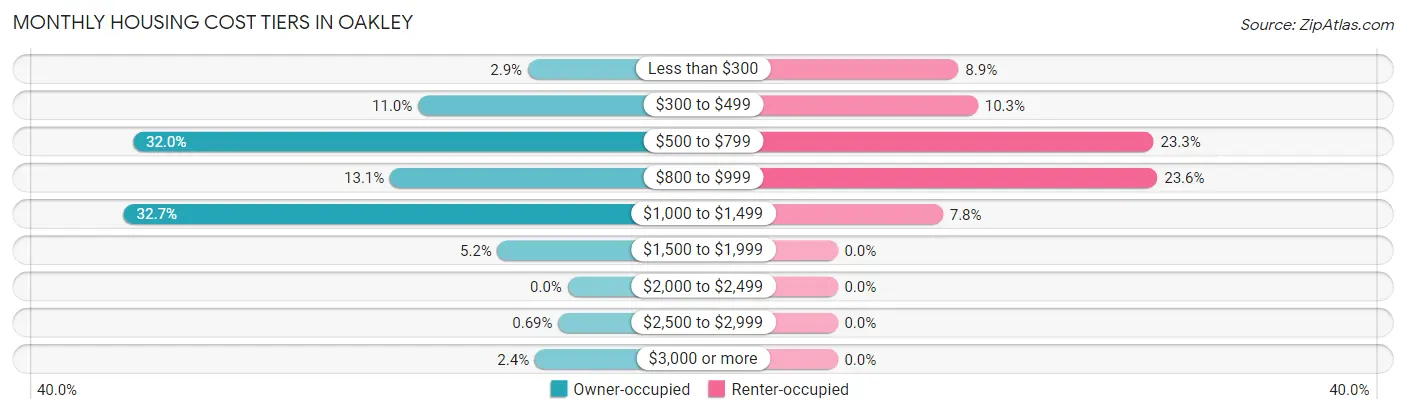
| Monthly Cost | Owner-occupied | Renter-occupied |
| Less than $300 | 17 (2.9%) | 31 (8.9%) |
| $300 to $499 | 64 (11.0%) | 36 (10.3%) |
| $500 to $799 | 186 (32.0%) | 81 (23.3%) |
| $800 to $999 | 76 (13.1%) | 82 (23.6%) |
| $1,000 to $1,499 | 190 (32.7%) | 27 (7.8%) |
| $1,500 to $1,999 | 30 (5.2%) | 0 (0.0%) |
| $2,000 to $2,499 | 0 (0.0%) | 0 (0.0%) |
| $2,500 to $2,999 | 4 (0.7%) | 0 (0.0%) |
| $3,000 or more | 14 (2.4%) | 0 (0.0%) |
| Total | 581 (100.0%) | 348 (100.0%) |
Physical Housing Characteristics in Oakley
Housing Structures in Oakley
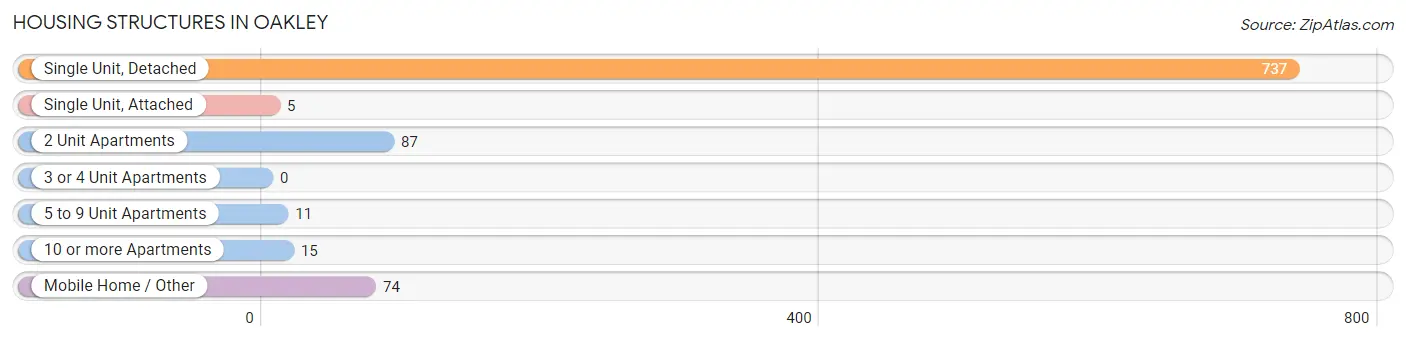
| Structure Type | # Housing Units | % Housing Units |
| Single Unit, Detached | 737 | 79.3% |
| Single Unit, Attached | 5 | 0.5% |
| 2 Unit Apartments | 87 | 9.4% |
| 3 or 4 Unit Apartments | 0 | 0.0% |
| 5 to 9 Unit Apartments | 11 | 1.2% |
| 10 or more Apartments | 15 | 1.6% |
| Mobile Home / Other | 74 | 8.0% |
| Total | 929 | 100.0% |
Housing Structures by Occupancy in Oakley
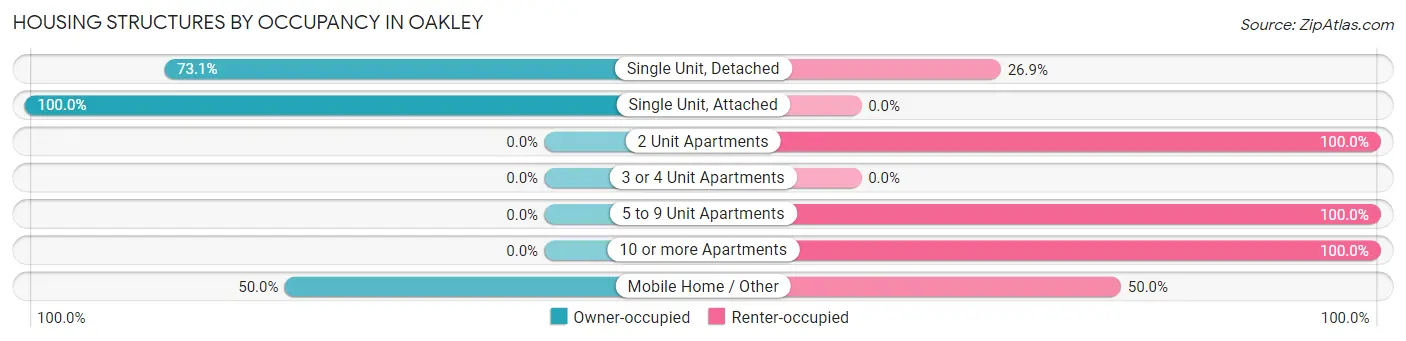
| Structure Type | Owner-occupied | Renter-occupied |
| Single Unit, Detached | 539 (73.1%) | 198 (26.9%) |
| Single Unit, Attached | 5 (100.0%) | 0 (0.0%) |
| 2 Unit Apartments | 0 (0.0%) | 87 (100.0%) |
| 3 or 4 Unit Apartments | 0 (0.0%) | 0 (0.0%) |
| 5 to 9 Unit Apartments | 0 (0.0%) | 11 (100.0%) |
| 10 or more Apartments | 0 (0.0%) | 15 (100.0%) |
| Mobile Home / Other | 37 (50.0%) | 37 (50.0%) |
| Total | 581 (62.5%) | 348 (37.5%) |
Housing Structures by Number of Rooms in Oakley
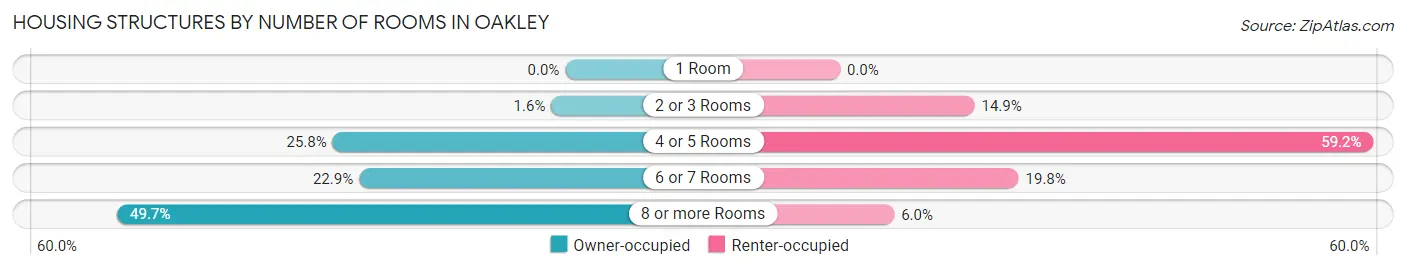
| Number of Rooms | Owner-occupied | Renter-occupied |
| 1 Room | 0 (0.0%) | 0 (0.0%) |
| 2 or 3 Rooms | 9 (1.5%) | 52 (14.9%) |
| 4 or 5 Rooms | 150 (25.8%) | 206 (59.2%) |
| 6 or 7 Rooms | 133 (22.9%) | 69 (19.8%) |
| 8 or more Rooms | 289 (49.7%) | 21 (6.0%) |
| Total | 581 (100.0%) | 348 (100.0%) |
Housing Structure by Heating Type in Oakley
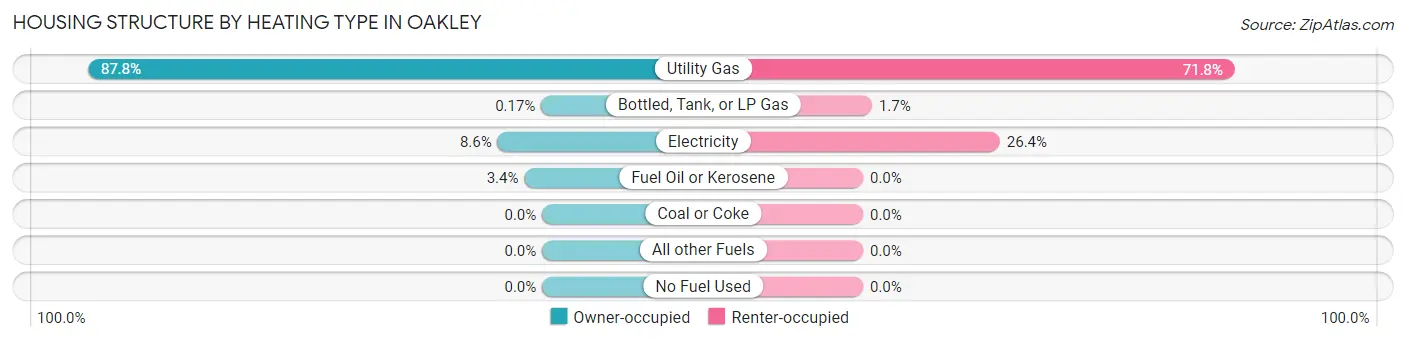
| Heating Type | Owner-occupied | Renter-occupied |
| Utility Gas | 510 (87.8%) | 250 (71.8%) |
| Bottled, Tank, or LP Gas | 1 (0.2%) | 6 (1.7%) |
| Electricity | 50 (8.6%) | 92 (26.4%) |
| Fuel Oil or Kerosene | 20 (3.4%) | 0 (0.0%) |
| Coal or Coke | 0 (0.0%) | 0 (0.0%) |
| All other Fuels | 0 (0.0%) | 0 (0.0%) |
| No Fuel Used | 0 (0.0%) | 0 (0.0%) |
| Total | 581 (100.0%) | 348 (100.0%) |
Household Vehicle Usage in Oakley
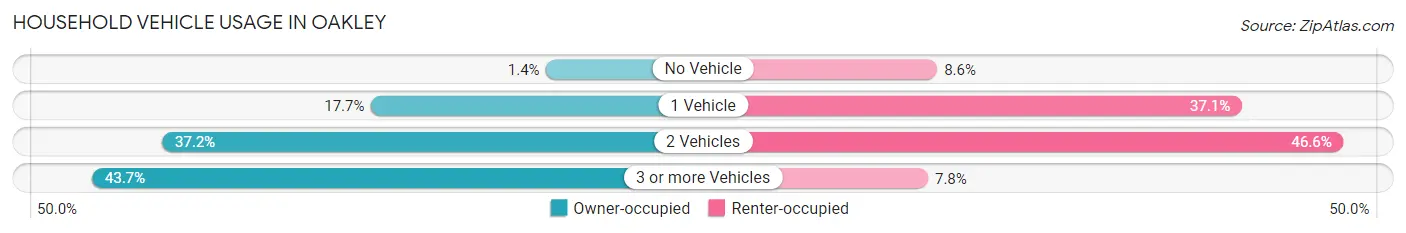
| Vehicles per Household | Owner-occupied | Renter-occupied |
| No Vehicle | 8 (1.4%) | 30 (8.6%) |
| 1 Vehicle | 103 (17.7%) | 129 (37.1%) |
| 2 Vehicles | 216 (37.2%) | 162 (46.6%) |
| 3 or more Vehicles | 254 (43.7%) | 27 (7.8%) |
| Total | 581 (100.0%) | 348 (100.0%) |
Real Estate & Mortgages in Oakley
Real Estate and Mortgage Overview in Oakley
| Characteristic | Without Mortgage | With Mortgage |
| Housing Units | 274 | 307 |
| Median Property Value | $156,100 | $117,600 |
| Median Household Income | $66,897 | $72 |
| Monthly Housing Costs | $630 | $14 |
| Real Estate Taxes | $2,199 | $0 |
Property Value by Mortgage Status in Oakley
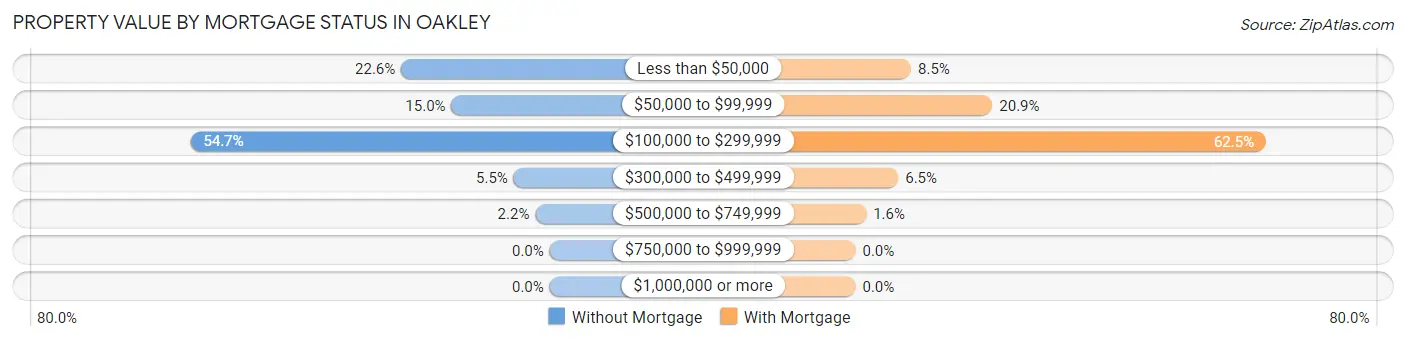
| Property Value | Without Mortgage | With Mortgage |
| Less than $50,000 | 62 (22.6%) | 26 (8.5%) |
| $50,000 to $99,999 | 41 (15.0%) | 64 (20.8%) |
| $100,000 to $299,999 | 150 (54.7%) | 192 (62.5%) |
| $300,000 to $499,999 | 15 (5.5%) | 20 (6.5%) |
| $500,000 to $749,999 | 6 (2.2%) | 5 (1.6%) |
| $750,000 to $999,999 | 0 (0.0%) | 0 (0.0%) |
| $1,000,000 or more | 0 (0.0%) | 0 (0.0%) |
| Total | 274 (100.0%) | 307 (100.0%) |
Household Income by Mortgage Status in Oakley
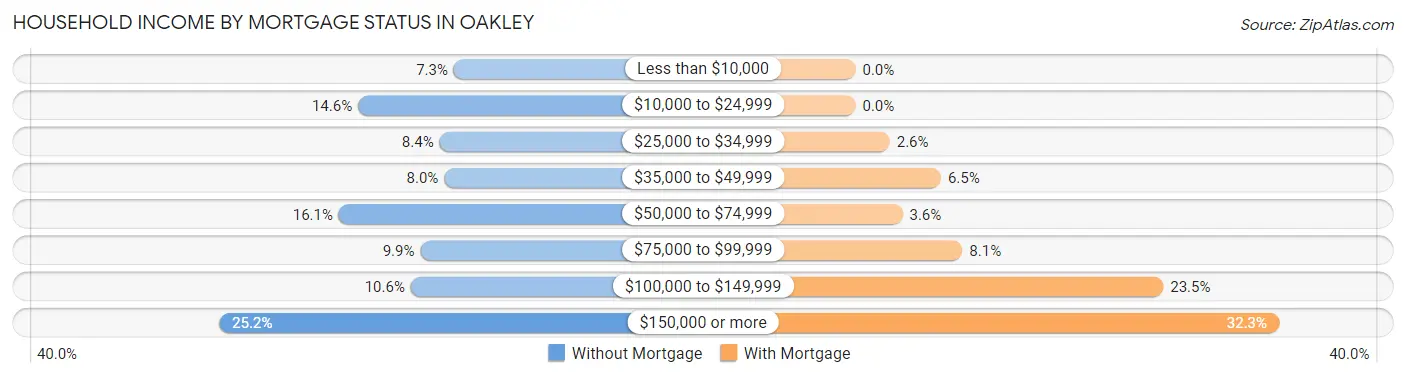
| Household Income | Without Mortgage | With Mortgage |
| Less than $10,000 | 20 (7.3%) | 0 (0.0%) |
| $10,000 to $24,999 | 40 (14.6%) | 0 (0.0%) |
| $25,000 to $34,999 | 23 (8.4%) | 8 (2.6%) |
| $35,000 to $49,999 | 22 (8.0%) | 20 (6.5%) |
| $50,000 to $74,999 | 44 (16.1%) | 11 (3.6%) |
| $75,000 to $99,999 | 27 (9.9%) | 25 (8.1%) |
| $100,000 to $149,999 | 29 (10.6%) | 72 (23.4%) |
| $150,000 or more | 69 (25.2%) | 99 (32.3%) |
| Total | 274 (100.0%) | 307 (100.0%) |
Property Value to Household Income Ratio in Oakley
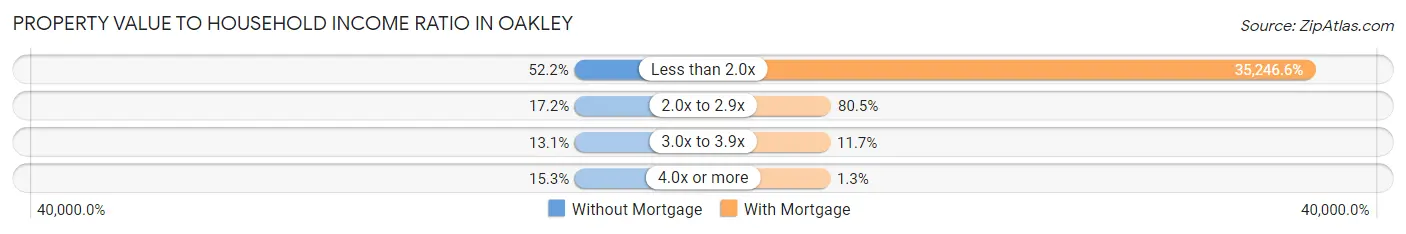
| Value-to-Income Ratio | Without Mortgage | With Mortgage |
| Less than 2.0x | 143 (52.2%) | 108,207 (35,246.6%) |
| 2.0x to 2.9x | 47 (17.2%) | 247 (80.5%) |
| 3.0x to 3.9x | 36 (13.1%) | 36 (11.7%) |
| 4.0x or more | 42 (15.3%) | 4 (1.3%) |
| Total | 274 (100.0%) | 307 (100.0%) |
Real Estate Taxes by Mortgage Status in Oakley
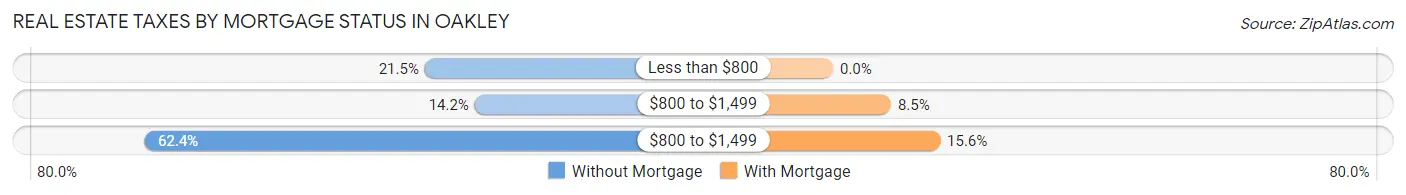
| Property Taxes | Without Mortgage | With Mortgage |
| Less than $800 | 59 (21.5%) | 0 (0.0%) |
| $800 to $1,499 | 39 (14.2%) | 26 (8.5%) |
| $800 to $1,499 | 171 (62.4%) | 48 (15.6%) |
| Total | 274 (100.0%) | 307 (100.0%) |
Health & Disability in Oakley
Health Insurance Coverage by Age in Oakley
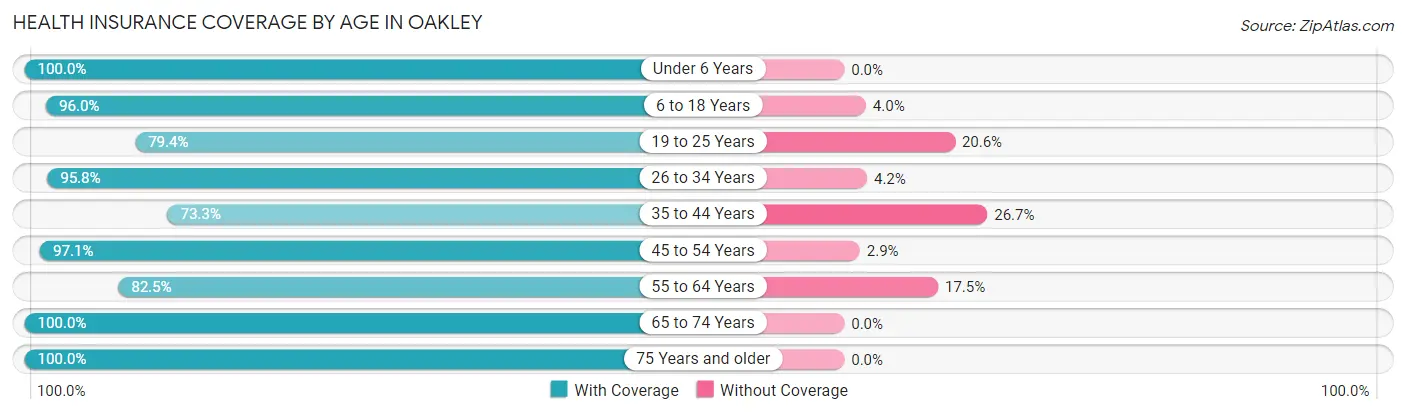
| Age Bracket | With Coverage | Without Coverage |
| Under 6 Years | 163 (100.0%) | 0 (0.0%) |
| 6 to 18 Years | 357 (96.0%) | 15 (4.0%) |
| 19 to 25 Years | 100 (79.4%) | 26 (20.6%) |
| 26 to 34 Years | 158 (95.8%) | 7 (4.2%) |
| 35 to 44 Years | 198 (73.3%) | 72 (26.7%) |
| 45 to 54 Years | 201 (97.1%) | 6 (2.9%) |
| 55 to 64 Years | 255 (82.5%) | 54 (17.5%) |
| 65 to 74 Years | 227 (100.0%) | 0 (0.0%) |
| 75 Years and older | 193 (100.0%) | 0 (0.0%) |
| Total | 1,852 (91.1%) | 180 (8.9%) |
Health Insurance Coverage by Citizenship Status in Oakley
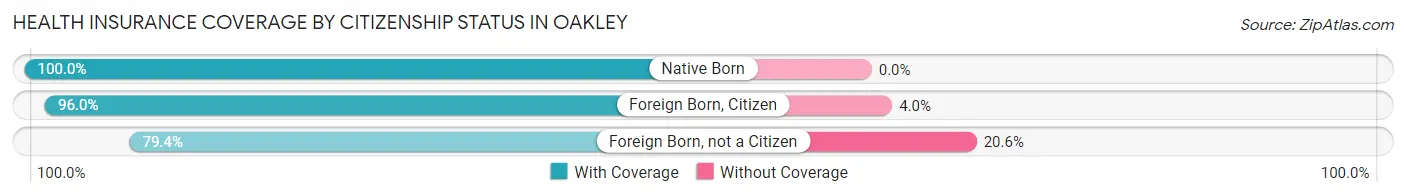
| Citizenship Status | With Coverage | Without Coverage |
| Native Born | 163 (100.0%) | 0 (0.0%) |
| Foreign Born, Citizen | 357 (96.0%) | 15 (4.0%) |
| Foreign Born, not a Citizen | 100 (79.4%) | 26 (20.6%) |
Health Insurance Coverage by Household Income in Oakley
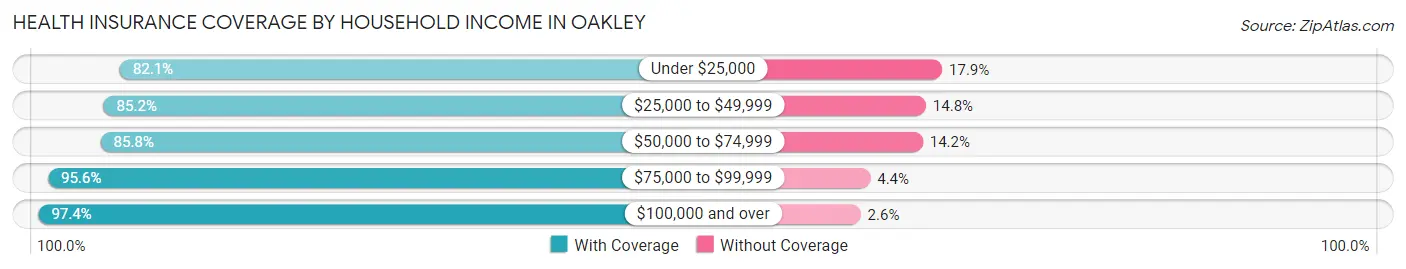
| Household Income | With Coverage | Without Coverage |
| Under $25,000 | 207 (82.1%) | 45 (17.9%) |
| $25,000 to $49,999 | 339 (85.2%) | 59 (14.8%) |
| $50,000 to $74,999 | 253 (85.8%) | 42 (14.2%) |
| $75,000 to $99,999 | 304 (95.6%) | 14 (4.4%) |
| $100,000 and over | 749 (97.4%) | 20 (2.6%) |
Public vs Private Health Insurance Coverage by Age in Oakley
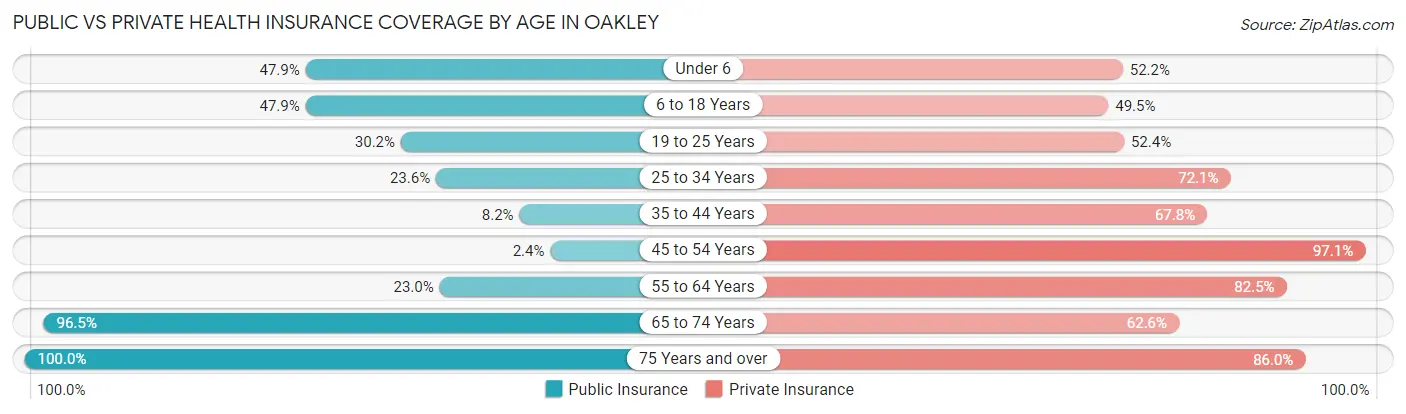
| Age Bracket | Public Insurance | Private Insurance |
| Under 6 | 78 (47.8%) | 85 (52.1%) |
| 6 to 18 Years | 178 (47.8%) | 184 (49.5%) |
| 19 to 25 Years | 38 (30.2%) | 66 (52.4%) |
| 25 to 34 Years | 39 (23.6%) | 119 (72.1%) |
| 35 to 44 Years | 22 (8.2%) | 183 (67.8%) |
| 45 to 54 Years | 5 (2.4%) | 201 (97.1%) |
| 55 to 64 Years | 71 (23.0%) | 255 (82.5%) |
| 65 to 74 Years | 219 (96.5%) | 142 (62.6%) |
| 75 Years and over | 193 (100.0%) | 166 (86.0%) |
| Total | 843 (41.5%) | 1,401 (69.0%) |
Disability Status by Sex by Age in Oakley
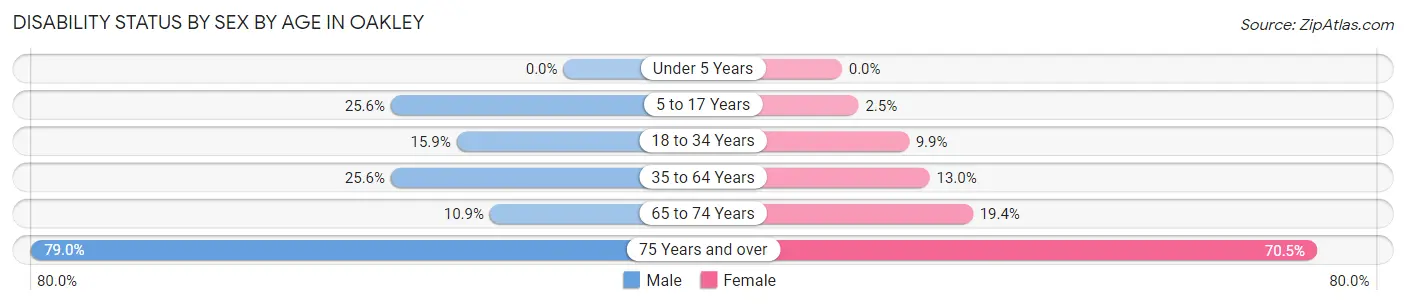
| Age Bracket | Male | Female |
| Under 5 Years | 0 (0.0%) | 0 (0.0%) |
| 5 to 17 Years | 52 (25.6%) | 4 (2.5%) |
| 18 to 34 Years | 23 (15.9%) | 17 (9.9%) |
| 35 to 64 Years | 105 (25.6%) | 49 (13.0%) |
| 65 to 74 Years | 13 (10.9%) | 21 (19.4%) |
| 75 Years and over | 64 (79.0%) | 79 (70.5%) |
Disability Class by Sex by Age in Oakley
Disability Class: Hearing Difficulty
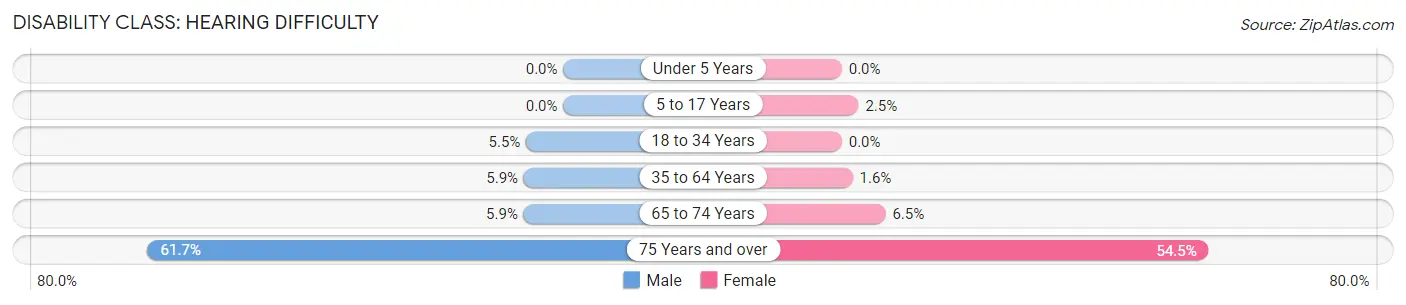
| Age Bracket | Male | Female |
| Under 5 Years | 0 (0.0%) | 0 (0.0%) |
| 5 to 17 Years | 0 (0.0%) | 4 (2.5%) |
| 18 to 34 Years | 8 (5.5%) | 0 (0.0%) |
| 35 to 64 Years | 24 (5.9%) | 6 (1.6%) |
| 65 to 74 Years | 7 (5.9%) | 7 (6.5%) |
| 75 Years and over | 50 (61.7%) | 61 (54.5%) |
Disability Class: Vision Difficulty
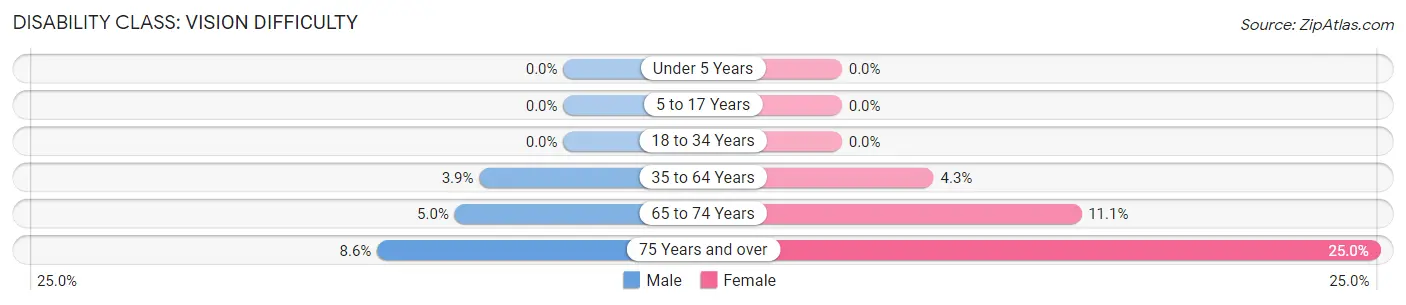
| Age Bracket | Male | Female |
| Under 5 Years | 0 (0.0%) | 0 (0.0%) |
| 5 to 17 Years | 0 (0.0%) | 0 (0.0%) |
| 18 to 34 Years | 0 (0.0%) | 0 (0.0%) |
| 35 to 64 Years | 16 (3.9%) | 16 (4.3%) |
| 65 to 74 Years | 6 (5.0%) | 12 (11.1%) |
| 75 Years and over | 7 (8.6%) | 28 (25.0%) |
Disability Class: Cognitive Difficulty
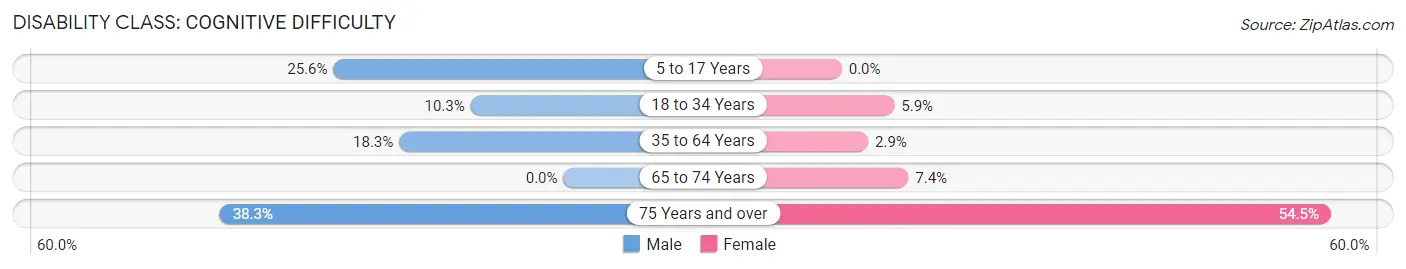
| Age Bracket | Male | Female |
| 5 to 17 Years | 52 (25.6%) | 0 (0.0%) |
| 18 to 34 Years | 15 (10.3%) | 10 (5.9%) |
| 35 to 64 Years | 75 (18.3%) | 11 (2.9%) |
| 65 to 74 Years | 0 (0.0%) | 8 (7.4%) |
| 75 Years and over | 31 (38.3%) | 61 (54.5%) |
Disability Class: Ambulatory Difficulty
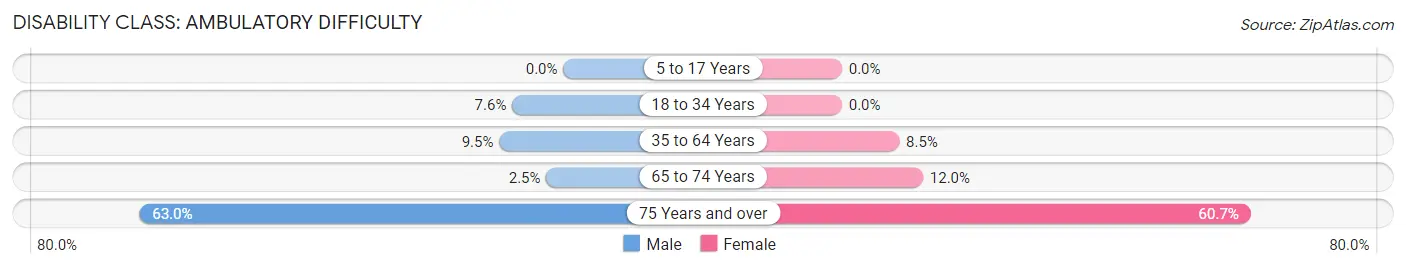
| Age Bracket | Male | Female |
| 5 to 17 Years | 0 (0.0%) | 0 (0.0%) |
| 18 to 34 Years | 11 (7.6%) | 0 (0.0%) |
| 35 to 64 Years | 39 (9.5%) | 32 (8.5%) |
| 65 to 74 Years | 3 (2.5%) | 13 (12.0%) |
| 75 Years and over | 51 (63.0%) | 68 (60.7%) |
Disability Class: Self-Care Difficulty
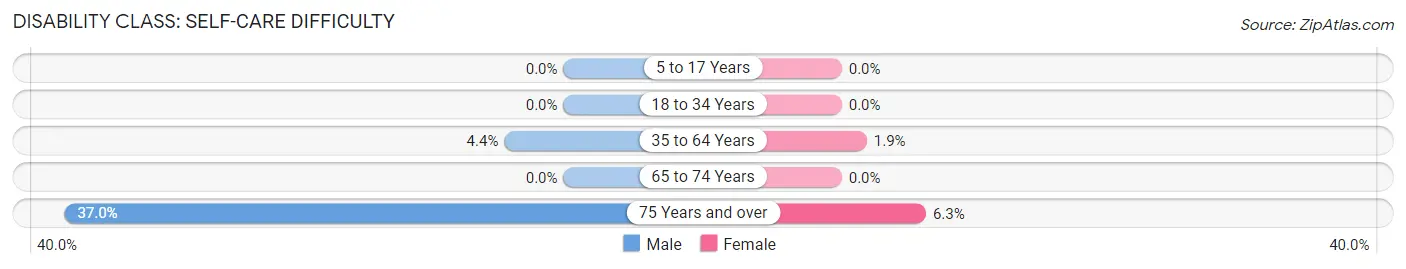
| Age Bracket | Male | Female |
| 5 to 17 Years | 0 (0.0%) | 0 (0.0%) |
| 18 to 34 Years | 0 (0.0%) | 0 (0.0%) |
| 35 to 64 Years | 18 (4.4%) | 7 (1.9%) |
| 65 to 74 Years | 0 (0.0%) | 0 (0.0%) |
| 75 Years and over | 30 (37.0%) | 7 (6.2%) |
Technology Access in Oakley
Computing Device Access in Oakley
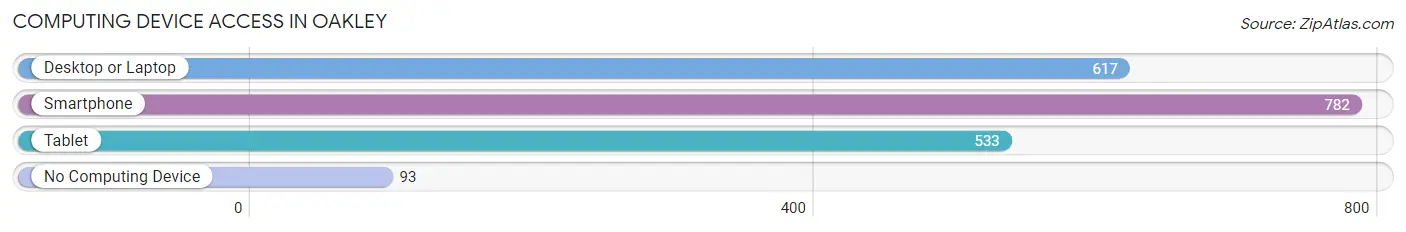
| Device Type | # Households | % Households |
| Desktop or Laptop | 617 | 66.4% |
| Smartphone | 782 | 84.2% |
| Tablet | 533 | 57.4% |
| No Computing Device | 93 | 10.0% |
| Total | 929 | 100.0% |
Internet Access in Oakley
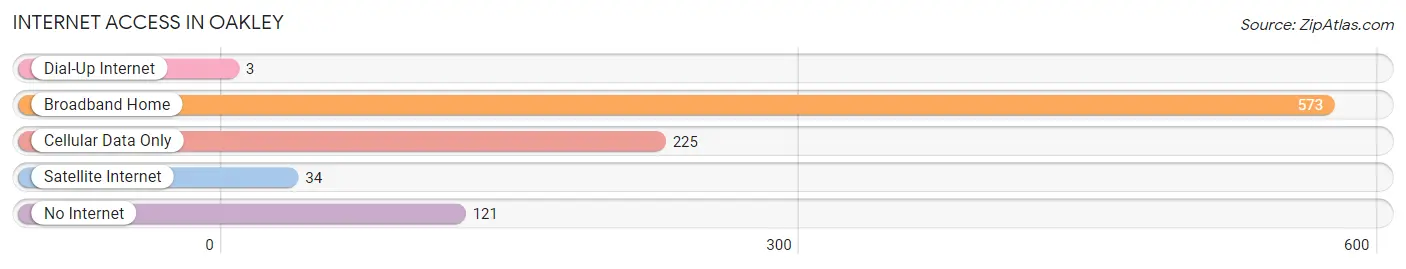
| Internet Type | # Households | % Households |
| Dial-Up Internet | 3 | 0.3% |
| Broadband Home | 573 | 61.7% |
| Cellular Data Only | 225 | 24.2% |
| Satellite Internet | 34 | 3.7% |
| No Internet | 121 | 13.0% |
| Total | 929 | 100.0% |
Oakley Summary
Oakley, Kansas is a small city located in the northwest corner of the state, in the county of Logan. It is situated on the banks of the Smoky Hill River, and is the county seat of Logan County. The city has a population of approximately 2,000 people, and is the largest city in the county.
Oakley is located in the High Plains region of Kansas, and is part of the Great Plains region of the United States. The city is situated at an elevation of 2,845 feet above sea level, and is located at the intersection of U.S. Route 40 and U.S. Route 83. The city is located approximately 100 miles west of Wichita, and is approximately 200 miles east of Denver, Colorado.
The city of Oakley has a rich history, dating back to the late 1800s. The city was founded in 1885, when the Union Pacific Railroad was extended to the area. The city was named after the Oakley family, who were early settlers in the area. The city was incorporated in 1887, and has remained a small, rural community ever since.
The economy of Oakley is largely based on agriculture, with the majority of the population employed in the farming and ranching industries. The city is also home to several small businesses, including a grocery store, a hardware store, and a few restaurants. The city is also home to a small airport, which serves the surrounding area.
The demographics of Oakley are largely white, with a small percentage of African Americans, Hispanics, and Native Americans. The median household income in Oakley is approximately $35,000, and the median home value is approximately $90,000. The city has a low unemployment rate, and the poverty rate is below the national average.
Oakley is a small, rural community with a rich history and a strong sense of community. The city is home to a variety of businesses, and is a great place to live and work. The city is also home to a variety of recreational activities, including fishing, hunting, and camping. The city is also home to a variety of cultural events, including the annual Oakley Days Festival, which celebrates the city's history and culture.
Common Questions
What is Per Capita Income in Oakley?
Per Capita income in Oakley is $37,008.
What is the Median Family Income in Oakley?
Median Family Income in Oakley is $86,250.
What is the Median Household income in Oakley?
Median Household Income in Oakley is $65,568.
What is Income or Wage Gap in Oakley?
Income or Wage Gap in Oakley is 40.6%.
Women in Oakley earn 59.4 cents for every dollar earned by a man.
What is Inequality or Gini Index in Oakley?
Inequality or Gini Index in Oakley is 0.46.
What is the Total Population of Oakley?
Total Population of Oakley is 2,063.
What is the Total Male Population of Oakley?
Total Male Population of Oakley is 1,047.
What is the Total Female Population of Oakley?
Total Female Population of Oakley is 1,016.
What is the Ratio of Males per 100 Females in Oakley?
There are 103.05 Males per 100 Females in Oakley.
What is the Ratio of Females per 100 Males in Oakley?
There are 97.04 Females per 100 Males in Oakley.
What is the Median Population Age in Oakley?
Median Population Age in Oakley is 42.0 Years.
What is the Average Family Size in Oakley
Average Family Size in Oakley is 2.7 People.
What is the Average Household Size in Oakley
Average Household Size in Oakley is 2.2 People.
How Large is the Labor Force in Oakley?
There are 1,066 People in the Labor Forcein in Oakley.
What is the Percentage of People in the Labor Force in Oakley?
67.3% of People are in the Labor Force in Oakley.
What is the Unemployment Rate in Oakley?
Unemployment Rate in Oakley is 0.3%.