Ulysses, KS Map & Demographics
Ulysses Map
Ulysses Overview
$33,602
PER CAPITA INCOME
$66,746
AVG FAMILY INCOME
$62,138
AVG HOUSEHOLD INCOME
50.6%
WAGE / INCOME GAP [ % ]
49.4¢/ $1
WAGE / INCOME GAP [ $ ]
0.41
INEQUALITY / GINI INDEX
5,834
TOTAL POPULATION
3,323
MALE POPULATION
2,511
FEMALE POPULATION
132.34
MALES / 100 FEMALES
75.56
FEMALES / 100 MALES
32.3
MEDIAN AGE
3.8
AVG FAMILY SIZE
3.2
AVG HOUSEHOLD SIZE
2,948
LABOR FORCE [ PEOPLE ]
71.7%
PERCENT IN LABOR FORCE
4.5%
UNEMPLOYMENT RATE
Ulysses Zip Codes
Ulysses Area Codes
Income in Ulysses
Income Overview in Ulysses
Per Capita Income in Ulysses is $33,602, while median incomes of families and households are $66,746 and $62,138 respectively.
| Characteristic | Number | Measure |
| Per Capita Income | 5,834 | $33,602 |
| Median Family Income | 1,399 | $66,746 |
| Mean Family Income | 1,399 | $102,925 |
| Median Household Income | 1,803 | $62,138 |
| Mean Household Income | 1,803 | $98,875 |
| Income Deficit | 1,399 | $0 |
| Wage / Income Gap (%) | 5,834 | 50.55% |
| Wage / Income Gap ($) | 5,834 | 49.45¢ per $1 |
| Gini / Inequality Index | 5,834 | 0.41 |
Earnings by Sex in Ulysses
Average Earnings in Ulysses are $50,053, $56,520 for men and $27,948 for women, a difference of 50.5%.
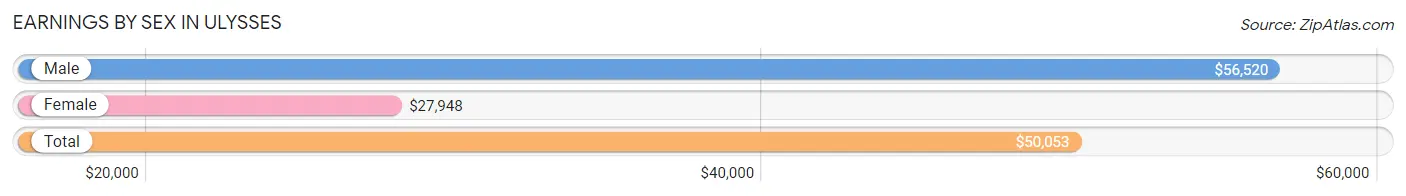
| Sex | Number | Average Earnings |
| Male | 1,730 (60.2%) | $56,520 |
| Female | 1,144 (39.8%) | $27,948 |
| Total | 2,874 (100.0%) | $50,053 |
Earnings by Sex by Income Bracket in Ulysses
The most common earnings brackets in Ulysses are $55,000 to $64,999 for men (394 | 22.8%) and $25,000 to $29,999 for women (175 | 15.3%).
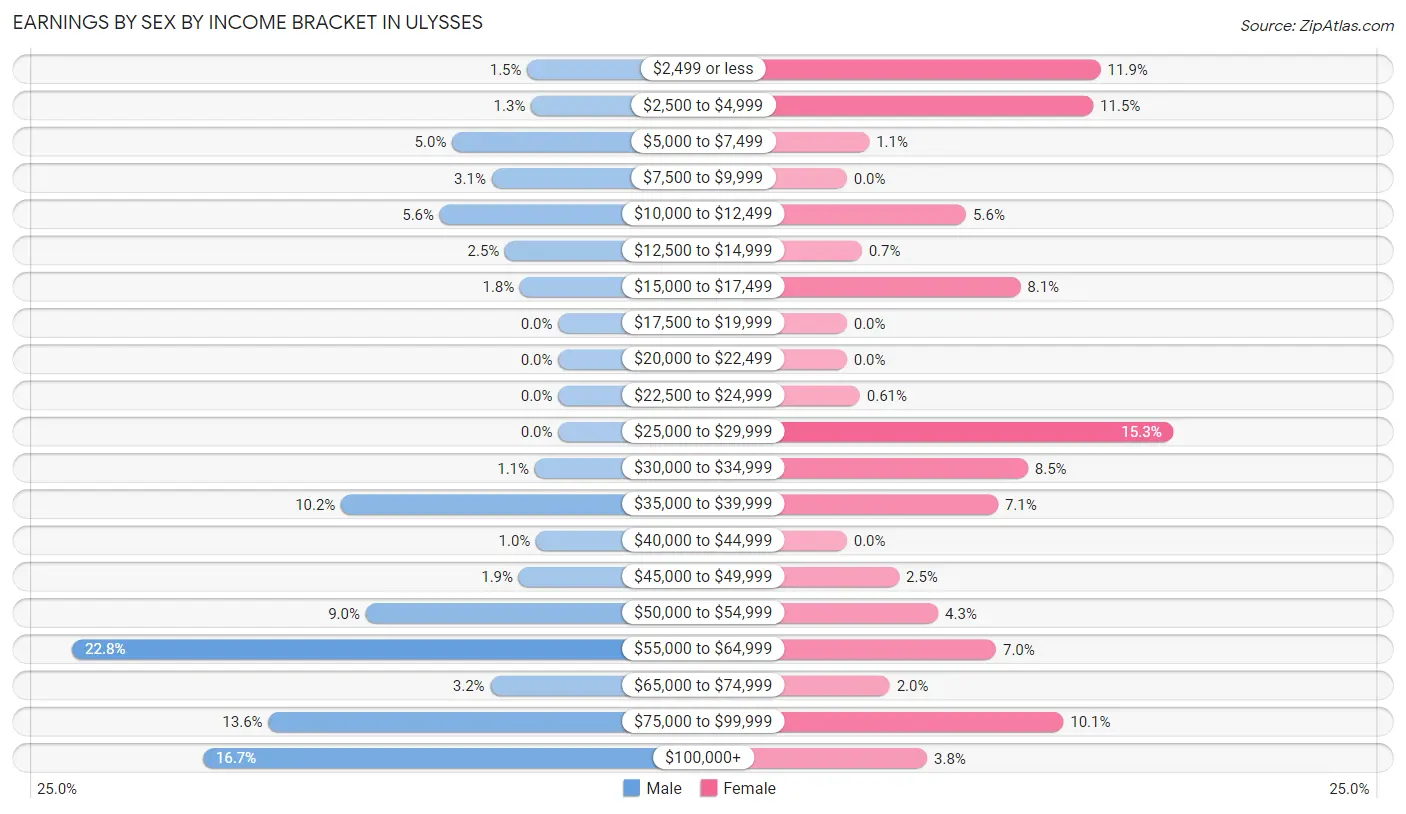
| Income | Male | Female |
| $2,499 or less | 25 (1.5%) | 136 (11.9%) |
| $2,500 to $4,999 | 22 (1.3%) | 132 (11.5%) |
| $5,000 to $7,499 | 86 (5.0%) | 12 (1.1%) |
| $7,500 to $9,999 | 54 (3.1%) | 0 (0.0%) |
| $10,000 to $12,499 | 96 (5.6%) | 64 (5.6%) |
| $12,500 to $14,999 | 43 (2.5%) | 8 (0.7%) |
| $15,000 to $17,499 | 31 (1.8%) | 93 (8.1%) |
| $17,500 to $19,999 | 0 (0.0%) | 0 (0.0%) |
| $20,000 to $22,499 | 0 (0.0%) | 0 (0.0%) |
| $22,500 to $24,999 | 0 (0.0%) | 7 (0.6%) |
| $25,000 to $29,999 | 0 (0.0%) | 175 (15.3%) |
| $30,000 to $34,999 | 19 (1.1%) | 97 (8.5%) |
| $35,000 to $39,999 | 176 (10.2%) | 81 (7.1%) |
| $40,000 to $44,999 | 18 (1.0%) | 0 (0.0%) |
| $45,000 to $49,999 | 32 (1.8%) | 28 (2.5%) |
| $50,000 to $54,999 | 156 (9.0%) | 49 (4.3%) |
| $55,000 to $64,999 | 394 (22.8%) | 80 (7.0%) |
| $65,000 to $74,999 | 55 (3.2%) | 23 (2.0%) |
| $75,000 to $99,999 | 235 (13.6%) | 116 (10.1%) |
| $100,000+ | 288 (16.7%) | 43 (3.8%) |
| Total | 1,730 (100.0%) | 1,144 (100.0%) |
Earnings by Sex by Educational Attainment in Ulysses
Average earnings in Ulysses are $58,545 for men and $29,160 for women, a difference of 50.2%. Men with an educational attainment of college or associate's degree enjoy the highest average annual earnings of $87,938, while those with less than high school education earn the least with $56,442. Women with an educational attainment of graduate degree earn the most with the average annual earnings of $90,213, while those with high school diploma education have the smallest earnings of $26,238.
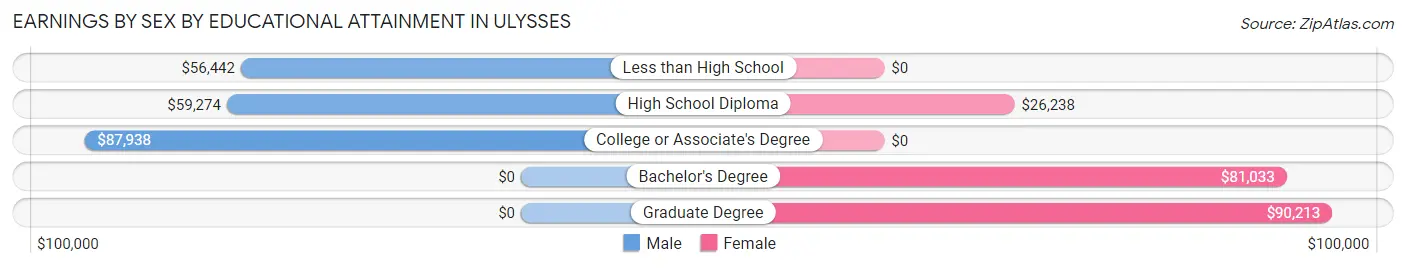
| Educational Attainment | Male Income | Female Income |
| Less than High School | $56,442 | $0 |
| High School Diploma | $59,274 | $26,238 |
| College or Associate's Degree | $87,938 | $0 |
| Bachelor's Degree | - | - |
| Graduate Degree | - | - |
| Total | $58,545 | $29,160 |
Family Income in Ulysses
Family Income Brackets in Ulysses
According to the Ulysses family income data, there are 526 families falling into the $50,000 to $74,999 income range, which is the most common income bracket and makes up 37.6% of all families. Conversely, the less than $10,000 income bracket is the least frequent group with only 13 families (0.9%) belonging to this category.
| Income Bracket | # Families | % Families |
| Less than $10,000 | 13 | 0.9% |
| $10,000 to $14,999 | 27 | 1.9% |
| $15,000 to $24,999 | 34 | 2.4% |
| $25,000 to $34,999 | 28 | 2.0% |
| $35,000 to $49,999 | 113 | 8.1% |
| $50,000 to $74,999 | 526 | 37.6% |
| $75,000 to $99,999 | 87 | 6.2% |
| $100,000 to $149,999 | 257 | 18.4% |
| $150,000 to $199,999 | 222 | 15.9% |
| $200,000+ | 94 | 6.7% |
Family Income by Famaliy Size in Ulysses
2-person families (487 | 34.8%) account for the highest median family income in Ulysses with $126,759 per family, while 2-person families (487 | 34.8%) have the highest median income of $63,380 per family member.
| Income Bracket | # Families | Median Income |
| 2-Person Families | 487 (34.8%) | $126,759 |
| 3-Person Families | 332 (23.7%) | $61,067 |
| 4-Person Families | 405 (28.9%) | $56,850 |
| 5-Person Families | 138 (9.9%) | $89,038 |
| 6-Person Families | 37 (2.6%) | $0 |
| 7+ Person Families | 0 (0.0%) | $0 |
| Total | 1,399 (100.0%) | $66,746 |
Family Income by Number of Earners in Ulysses
| Number of Earners | # Families | Median Income |
| No Earners | 83 (5.9%) | $0 |
| 1 Earner | 594 (42.5%) | $57,230 |
| 2 Earners | 642 (45.9%) | $127,164 |
| 3+ Earners | 80 (5.7%) | $116,250 |
| Total | 1,399 (100.0%) | $66,746 |
Household Income in Ulysses
Household Income Brackets in Ulysses
With 530 households falling in the category, the $50,000 to $74,999 income range is the most frequent in Ulysses, accounting for 29.4% of all households. In contrast, only 34 households (1.9%) fall into the $10,000 to $14,999 income bracket, making it the least populous group.
| Income Bracket | # Households | % Households |
| Less than $10,000 | 45 | 2.5% |
| $10,000 to $14,999 | 34 | 1.9% |
| $15,000 to $24,999 | 105 | 5.8% |
| $25,000 to $34,999 | 78 | 4.3% |
| $35,000 to $49,999 | 207 | 11.5% |
| $50,000 to $74,999 | 530 | 29.4% |
| $75,000 to $99,999 | 142 | 7.9% |
| $100,000 to $149,999 | 292 | 16.2% |
| $150,000 to $199,999 | 256 | 14.2% |
| $200,000+ | 112 | 6.2% |
Household Income by Householder Age in Ulysses
The median household income in Ulysses is $62,138, with the highest median household income of $99,881 found in the 45 to 64 years age bracket for the primary householder. A total of 582 households (32.3%) fall into this category. Meanwhile, the 15 to 24 years age bracket for the primary householder has the lowest median household income of $0, with 18 households (1.0%) in this group.
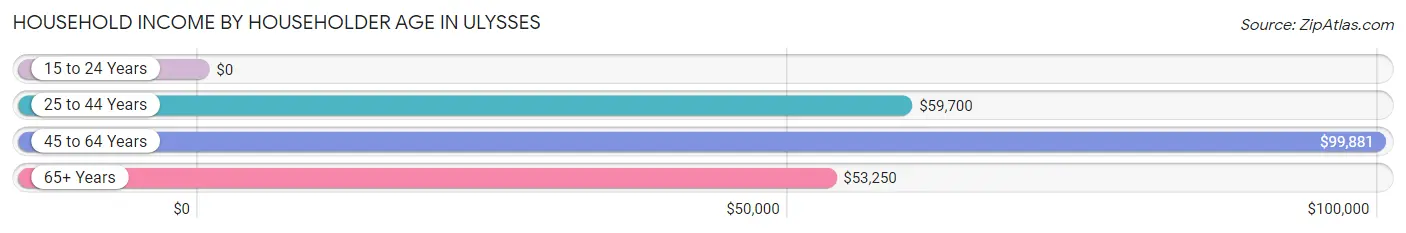
| Income Bracket | # Households | Median Income |
| 15 to 24 Years | 18 (1.0%) | $0 |
| 25 to 44 Years | 868 (48.1%) | $59,700 |
| 45 to 64 Years | 582 (32.3%) | $99,881 |
| 65+ Years | 335 (18.6%) | $53,250 |
| Total | 1,803 (100.0%) | $62,138 |
Poverty in Ulysses
Income Below Poverty by Sex and Age in Ulysses
With 4.8% poverty level for males and 7.5% for females among the residents of Ulysses, 6 to 11 year old males and 18 to 24 year old females are the most vulnerable to poverty, with 55 males (13.4%) and 62 females (41.6%) in their respective age groups living below the poverty level.
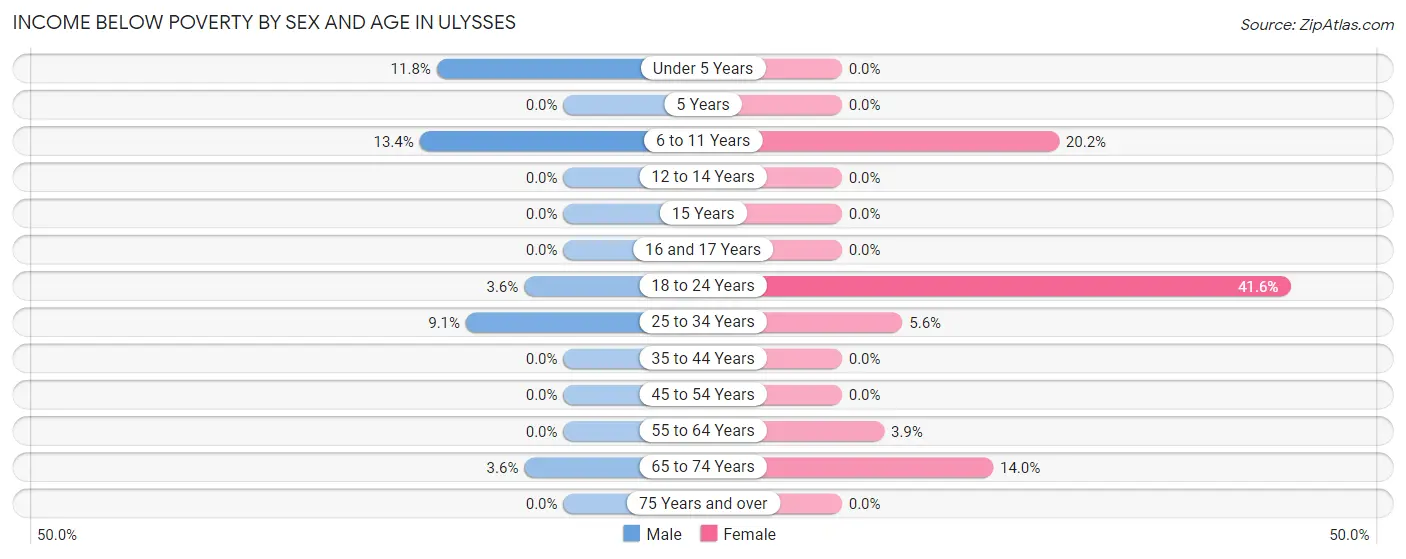
| Age Bracket | Male | Female |
| Under 5 Years | 36 (11.8%) | 0 (0.0%) |
| 5 Years | 0 (0.0%) | 0 (0.0%) |
| 6 to 11 Years | 55 (13.4%) | 55 (20.2%) |
| 12 to 14 Years | 0 (0.0%) | 0 (0.0%) |
| 15 Years | 0 (0.0%) | 0 (0.0%) |
| 16 and 17 Years | 0 (0.0%) | 0 (0.0%) |
| 18 to 24 Years | 11 (3.6%) | 62 (41.6%) |
| 25 to 34 Years | 43 (9.0%) | 26 (5.6%) |
| 35 to 44 Years | 0 (0.0%) | 0 (0.0%) |
| 45 to 54 Years | 0 (0.0%) | 0 (0.0%) |
| 55 to 64 Years | 0 (0.0%) | 8 (3.9%) |
| 65 to 74 Years | 12 (3.6%) | 33 (14.0%) |
| 75 Years and over | 0 (0.0%) | 0 (0.0%) |
| Total | 157 (4.8%) | 184 (7.5%) |
Income Above Poverty by Sex and Age in Ulysses
According to the poverty statistics in Ulysses, males aged 5 years and females aged under 5 years are the age groups that are most secure financially, with 100.0% of males and 100.0% of females in these age groups living above the poverty line.
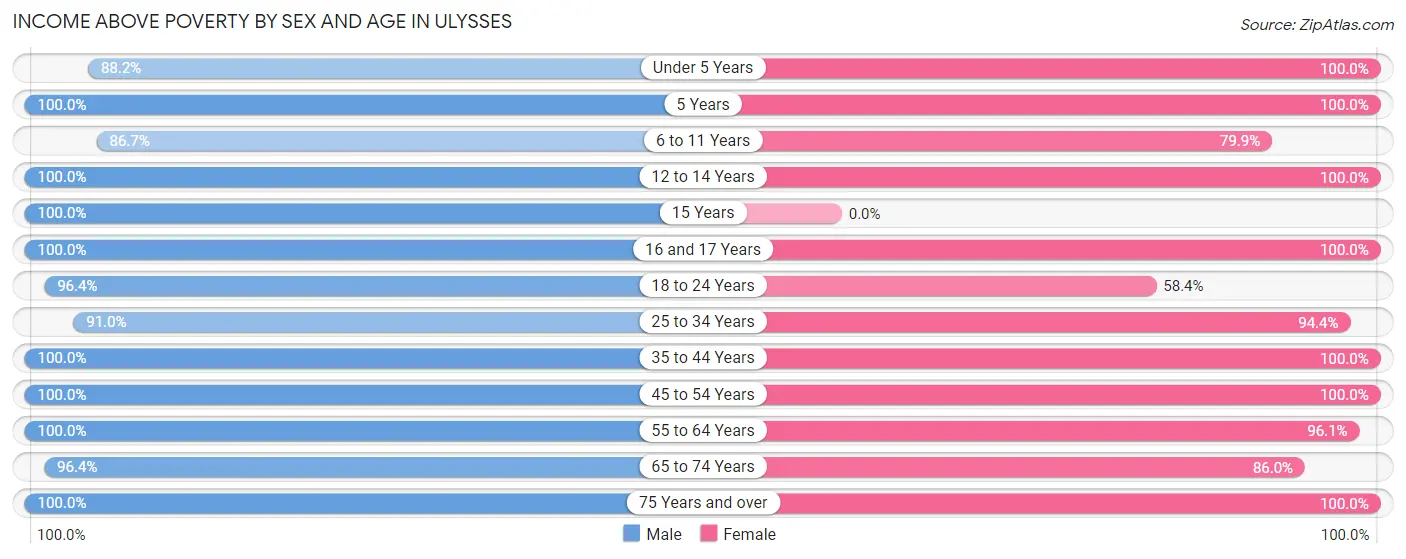
| Age Bracket | Male | Female |
| Under 5 Years | 270 (88.2%) | 86 (100.0%) |
| 5 Years | 24 (100.0%) | 100 (100.0%) |
| 6 to 11 Years | 357 (86.7%) | 218 (79.8%) |
| 12 to 14 Years | 289 (100.0%) | 181 (100.0%) |
| 15 Years | 29 (100.0%) | 0 (0.0%) |
| 16 and 17 Years | 147 (100.0%) | 48 (100.0%) |
| 18 to 24 Years | 291 (96.4%) | 87 (58.4%) |
| 25 to 34 Years | 432 (90.9%) | 437 (94.4%) |
| 35 to 44 Years | 259 (100.0%) | 248 (100.0%) |
| 45 to 54 Years | 299 (100.0%) | 364 (100.0%) |
| 55 to 64 Years | 380 (100.0%) | 196 (96.1%) |
| 65 to 74 Years | 319 (96.4%) | 202 (86.0%) |
| 75 Years and over | 49 (100.0%) | 95 (100.0%) |
| Total | 3,145 (95.3%) | 2,262 (92.5%) |
Income Below Poverty Among Married-Couple Families in Ulysses
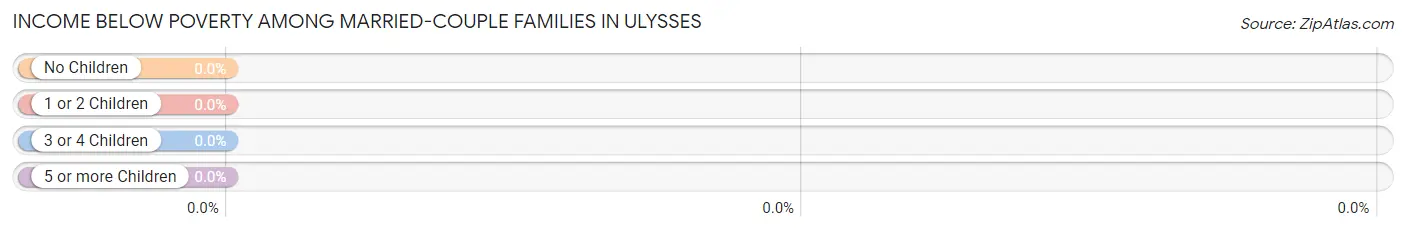
| Children | Above Poverty | Below Poverty |
| No Children | 448 (100.0%) | 0 (0.0%) |
| 1 or 2 Children | 647 (100.0%) | 0 (0.0%) |
| 3 or 4 Children | 164 (100.0%) | 0 (0.0%) |
| 5 or more Children | 0 (0.0%) | 0 (0.0%) |
| Total | 1,259 (100.0%) | 0 (0.0%) |
Income Below Poverty Among Single-Parent Households in Ulysses
According to the poverty data in Ulysses, 69.7% or 23 single-father households and 24.3% or 26 single-mother households are living below the poverty line. Among single-father households, those with 1 or 2 children have the highest poverty rate, with 23 households (69.7%) experiencing poverty. Likewise, among single-mother households, those with 1 or 2 children have the highest poverty rate, with 26 households (78.8%) falling below the poverty line.
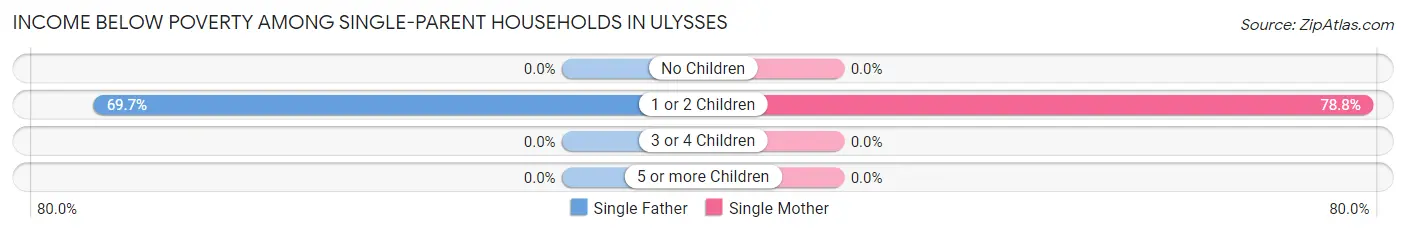
| Children | Single Father | Single Mother |
| No Children | 0 (0.0%) | 0 (0.0%) |
| 1 or 2 Children | 23 (69.7%) | 26 (78.8%) |
| 3 or 4 Children | 0 (0.0%) | 0 (0.0%) |
| 5 or more Children | 0 (0.0%) | 0 (0.0%) |
| Total | 23 (69.7%) | 26 (24.3%) |
Income Below Poverty Among Married-Couple vs Single-Parent Households in Ulysses
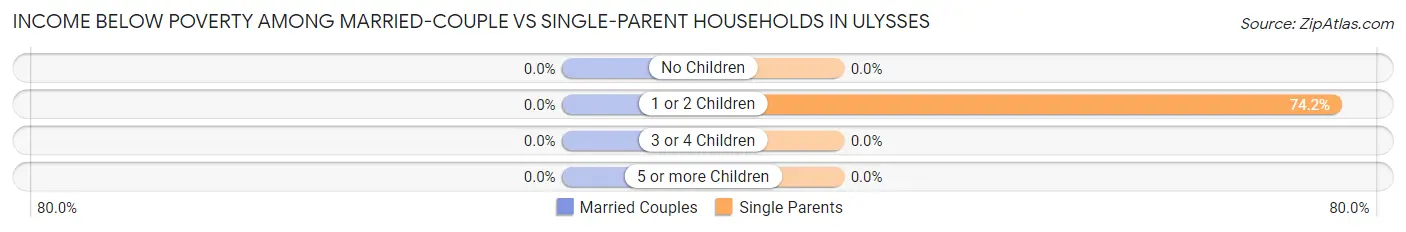
| Children | Married-Couple Families | Single-Parent Households |
| No Children | 0 (0.0%) | 0 (0.0%) |
| 1 or 2 Children | 0 (0.0%) | 49 (74.2%) |
| 3 or 4 Children | 0 (0.0%) | 0 (0.0%) |
| 5 or more Children | 0 (0.0%) | 0 (0.0%) |
| Total | 0 (0.0%) | 49 (35.0%) |
Race in Ulysses
The most populous races in Ulysses are White / Caucasian (4,316 | 74.0%), Hispanic or Latino (2,977 | 51.0%), and Two or more Races (1,278 | 21.9%).
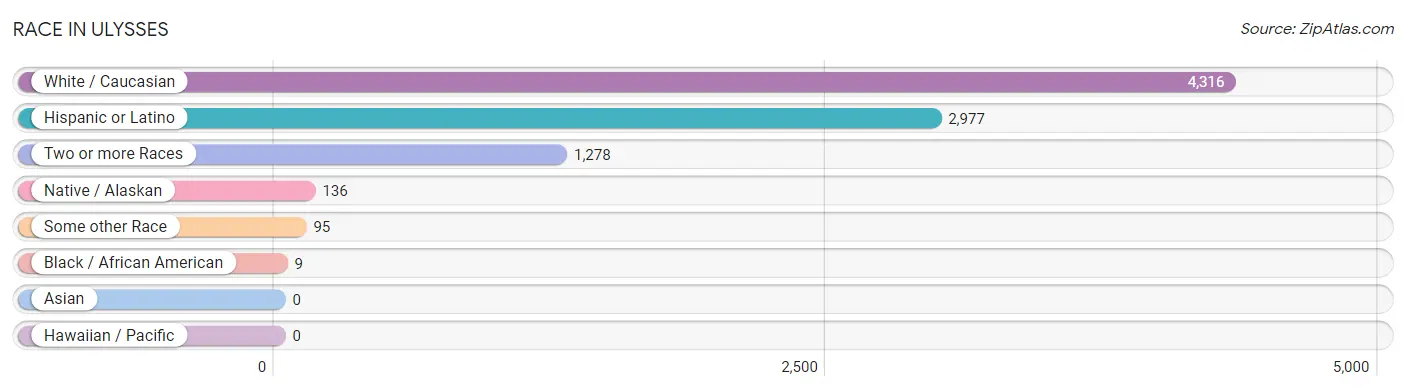
| Race | # Population | % Population |
| Asian | 0 | 0.0% |
| Black / African American | 9 | 0.2% |
| Hawaiian / Pacific | 0 | 0.0% |
| Hispanic or Latino | 2,977 | 51.0% |
| Native / Alaskan | 136 | 2.3% |
| White / Caucasian | 4,316 | 74.0% |
| Two or more Races | 1,278 | 21.9% |
| Some other Race | 95 | 1.6% |
| Total | 5,834 | 100.0% |
Ancestry in Ulysses
The most populous ancestries reported in Ulysses are Mexican (2,949 | 50.5%), German (1,033 | 17.7%), Irish (564 | 9.7%), English (193 | 3.3%), and Mexican American Indian (170 | 2.9%), together accounting for 84.2% of all Ulysses residents.
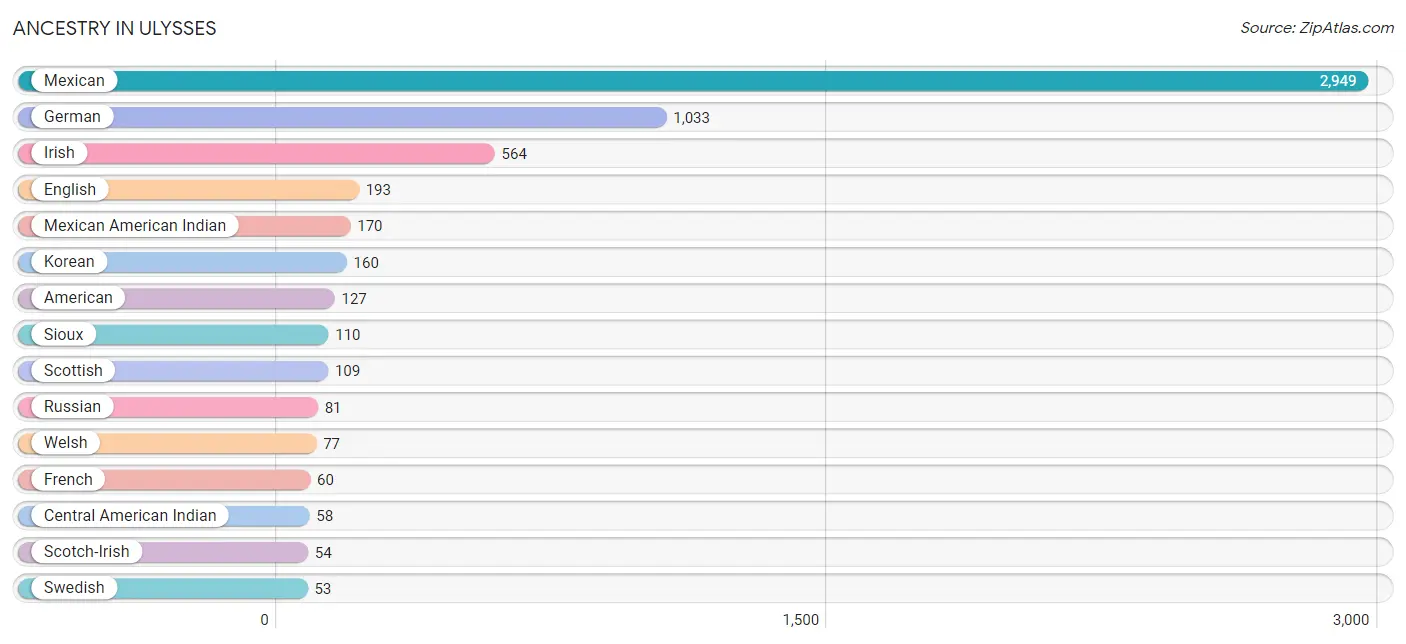
| Ancestry | # Population | % Population |
| American | 127 | 2.2% |
| Belgian | 41 | 0.7% |
| Cajun | 11 | 0.2% |
| Central American Indian | 58 | 1.0% |
| Cherokee | 5 | 0.1% |
| Choctaw | 2 | 0.0% |
| Cuban | 28 | 0.5% |
| Dutch | 48 | 0.8% |
| English | 193 | 3.3% |
| French | 60 | 1.0% |
| German | 1,033 | 17.7% |
| German Russian | 3 | 0.1% |
| Irish | 564 | 9.7% |
| Korean | 160 | 2.7% |
| Mexican | 2,949 | 50.5% |
| Mexican American Indian | 170 | 2.9% |
| Pennsylvania German | 20 | 0.3% |
| Polish | 1 | 0.0% |
| Potawatomi | 4 | 0.1% |
| Russian | 81 | 1.4% |
| Scotch-Irish | 54 | 0.9% |
| Scottish | 109 | 1.9% |
| Sioux | 110 | 1.9% |
| Swedish | 53 | 0.9% |
| Swiss | 40 | 0.7% |
| Welsh | 77 | 1.3% | View All 26 Rows |
Immigrants in Ulysses
The most numerous immigrant groups reported in Ulysses came from Central America (1,154 | 19.8%), Latin America (1,154 | 19.8%), Mexico (1,154 | 19.8%), Europe (96 | 1.7%), and Germany (96 | 1.7%), together accounting for 62.6% of all Ulysses residents.
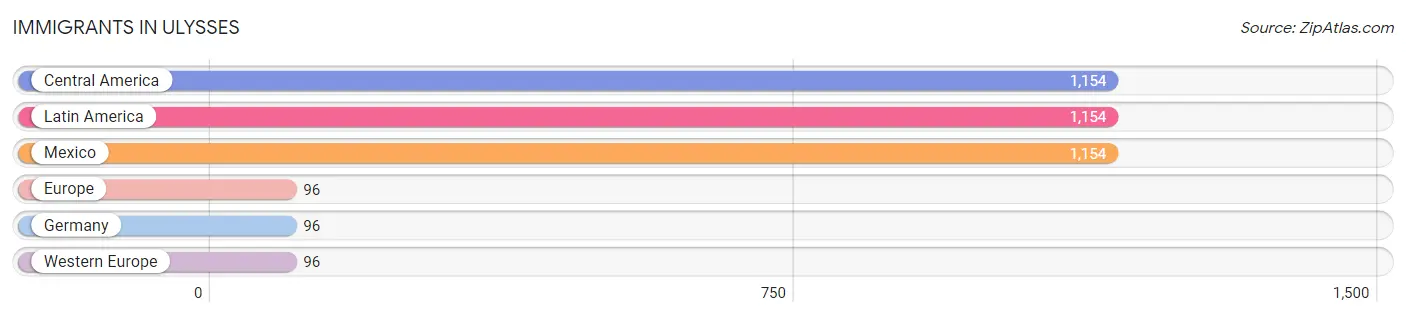
| Immigration Origin | # Population | % Population |
| Central America | 1,154 | 19.8% |
| Europe | 96 | 1.7% |
| Germany | 96 | 1.7% |
| Latin America | 1,154 | 19.8% |
| Mexico | 1,154 | 19.8% |
| Western Europe | 96 | 1.7% | View All 6 Rows |
Sex and Age in Ulysses
Sex and Age in Ulysses
The most populous age groups in Ulysses are 15 to 19 Years (467 | 14.1%) for men and 10 to 14 Years (339 | 13.5%) for women.
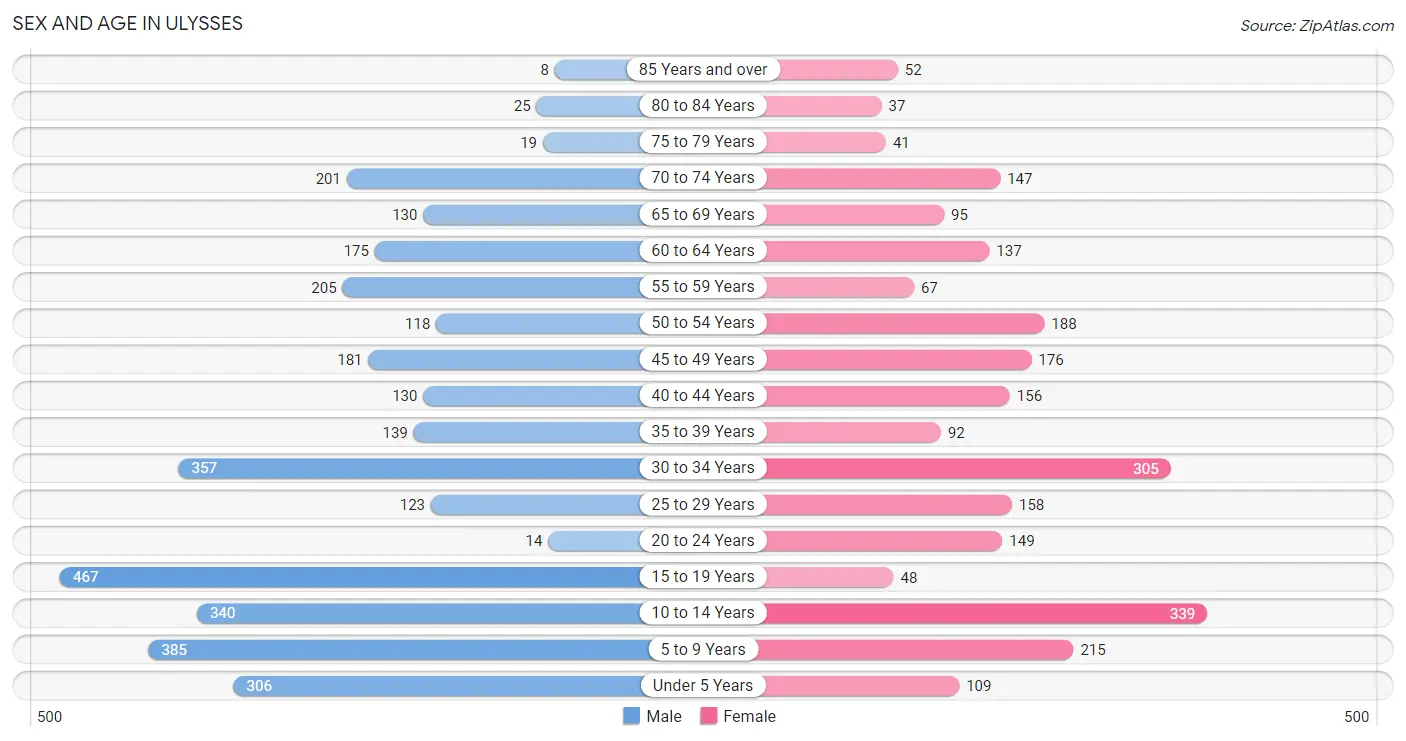
| Age Bracket | Male | Female |
| Under 5 Years | 306 (9.2%) | 109 (4.3%) |
| 5 to 9 Years | 385 (11.6%) | 215 (8.6%) |
| 10 to 14 Years | 340 (10.2%) | 339 (13.5%) |
| 15 to 19 Years | 467 (14.1%) | 48 (1.9%) |
| 20 to 24 Years | 14 (0.4%) | 149 (5.9%) |
| 25 to 29 Years | 123 (3.7%) | 158 (6.3%) |
| 30 to 34 Years | 357 (10.7%) | 305 (12.1%) |
| 35 to 39 Years | 139 (4.2%) | 92 (3.7%) |
| 40 to 44 Years | 130 (3.9%) | 156 (6.2%) |
| 45 to 49 Years | 181 (5.4%) | 176 (7.0%) |
| 50 to 54 Years | 118 (3.5%) | 188 (7.5%) |
| 55 to 59 Years | 205 (6.2%) | 67 (2.7%) |
| 60 to 64 Years | 175 (5.3%) | 137 (5.5%) |
| 65 to 69 Years | 130 (3.9%) | 95 (3.8%) |
| 70 to 74 Years | 201 (6.0%) | 147 (5.9%) |
| 75 to 79 Years | 19 (0.6%) | 41 (1.6%) |
| 80 to 84 Years | 25 (0.7%) | 37 (1.5%) |
| 85 Years and over | 8 (0.2%) | 52 (2.1%) |
| Total | 3,323 (100.0%) | 2,511 (100.0%) |
Families and Households in Ulysses
Median Family Size in Ulysses
The median family size in Ulysses is 3.76 persons per family, with single female/mother families (107 | 7.6%) accounting for the largest median family size of 4.39 persons per family. On the other hand, single male/father families (33 | 2.4%) represent the smallest median family size with 2.97 persons per family.
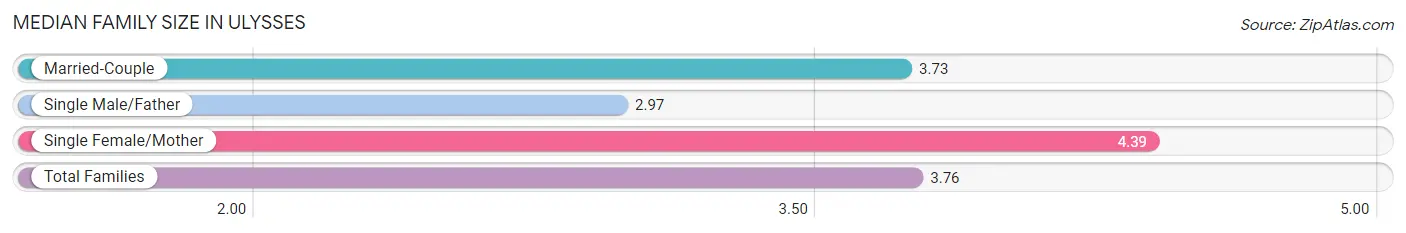
| Family Type | # Families | Family Size |
| Married-Couple | 1,259 (90.0%) | 3.73 |
| Single Male/Father | 33 (2.4%) | 2.97 |
| Single Female/Mother | 107 (7.6%) | 4.39 |
| Total Families | 1,399 (100.0%) | 3.76 |
Median Household Size in Ulysses
The median household size in Ulysses is 3.20 persons per household, with single female/mother households (107 | 5.9%) accounting for the largest median household size of 4.39 persons per household. non-family households (404 | 22.4%) represent the smallest median household size with 1.18 persons per household.
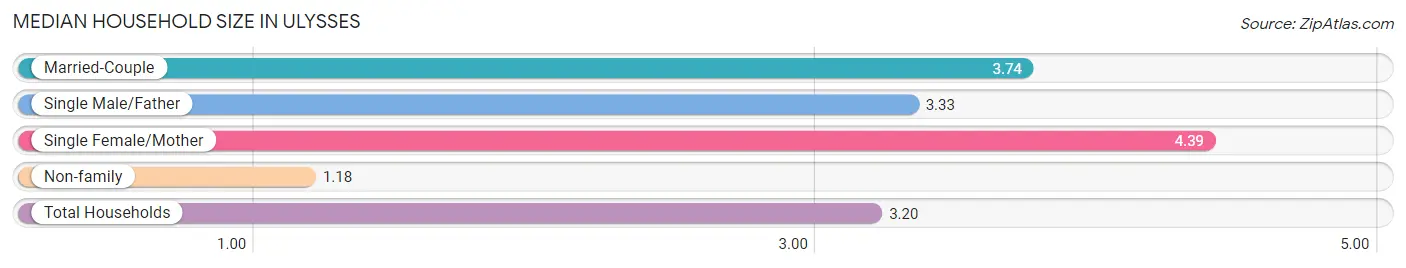
| Household Type | # Households | Household Size |
| Married-Couple | 1,259 (69.8%) | 3.74 |
| Single Male/Father | 33 (1.8%) | 3.33 |
| Single Female/Mother | 107 (5.9%) | 4.39 |
| Non-family | 404 (22.4%) | 1.18 |
| Total Households | 1,803 (100.0%) | 3.20 |
Household Size by Marriage Status in Ulysses
Out of a total of 1,803 households in Ulysses, 1,399 (77.6%) are family households, while 404 (22.4%) are nonfamily households. The most numerous type of family households are 2-person households, comprising 476, and the most common type of nonfamily households are 1-person households, comprising 342.
| Household Size | Family Households | Nonfamily Households |
| 1-Person Households | - | 342 (19.0%) |
| 2-Person Households | 476 (26.4%) | 62 (3.4%) |
| 3-Person Households | 285 (15.8%) | 0 (0.0%) |
| 4-Person Households | 463 (25.7%) | 0 (0.0%) |
| 5-Person Households | 138 (7.6%) | 0 (0.0%) |
| 6-Person Households | 37 (2.1%) | 0 (0.0%) |
| 7+ Person Households | 0 (0.0%) | 0 (0.0%) |
| Total | 1,399 (77.6%) | 404 (22.4%) |
Female Fertility in Ulysses
Fertility by Age in Ulysses
Average fertility rate in Ulysses is 208.0 births per 1,000 women. Women in the age bracket of 20 to 34 years have the highest fertility rate with 389.0 births per 1,000 women. Women in the age bracket of 20 to 34 years acount for 100.0% of all women with births.
| Age Bracket | Women with Births | Births / 1,000 Women |
| 15 to 19 years | 0 (0.0%) | 0.0 |
| 20 to 34 years | 238 (100.0%) | 389.0 |
| 35 to 50 years | 0 (0.0%) | 0.0 |
| Total | 238 (100.0%) | 208.0 |
Fertility by Age by Marriage Status in Ulysses
67.2% of women with births (238) in Ulysses are married. The highest percentage of unmarried women with births falls into 20 to 34 years age bracket with 32.8% of them unmarried at the time of birth, while the lowest percentage of unmarried women with births belong to 20 to 34 years age bracket with 32.8% of them unmarried.
| Age Bracket | Married | Unmarried |
| 15 to 19 years | 0 (0.0%) | 0 (0.0%) |
| 20 to 34 years | 160 (67.2%) | 78 (32.8%) |
| 35 to 50 years | 0 (0.0%) | 0 (0.0%) |
| Total | 160 (67.2%) | 78 (32.8%) |
Fertility by Education in Ulysses
| Educational Attainment | Women with Births | Births / 1,000 Women |
| Less than High School | 0 (0.0%) | 0.0 |
| High School Diploma | 13 (5.5%) | 52.0 |
| College or Associate's Degree | 78 (32.8%) | 177.0 |
| Bachelor's Degree | 0 (0.0%) | 0.0 |
| Graduate Degree | 147 (61.8%) | 717.0 |
| Total | 238 (100.0%) | 208.0 |
Fertility by Education by Marriage Status in Ulysses
32.8% of women with births in Ulysses are unmarried. Women with the educational attainment of high school diploma are most likely to be married with 100.0% of them married at childbirth, while women with the educational attainment of college or associate's degree are least likely to be married with 100.0% of them unmarried at childbirth.
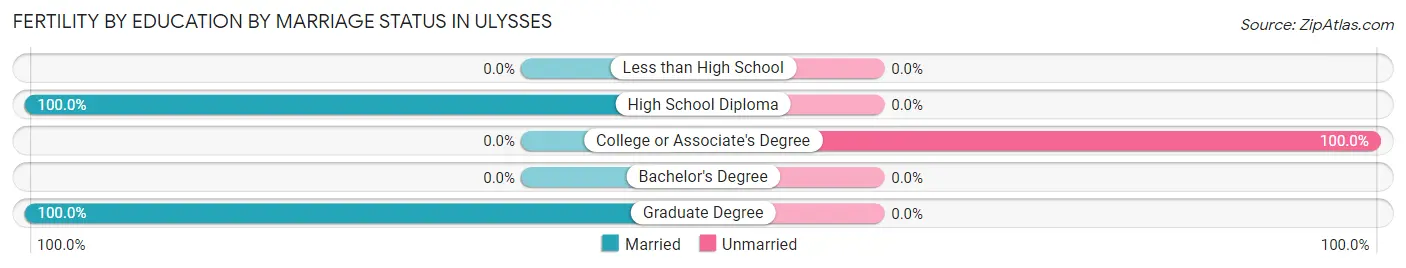
| Educational Attainment | Married | Unmarried |
| Less than High School | 0 (0.0%) | 0 (0.0%) |
| High School Diploma | 13 (100.0%) | 0 (0.0%) |
| College or Associate's Degree | 0 (0.0%) | 78 (100.0%) |
| Bachelor's Degree | 0 (0.0%) | 0 (0.0%) |
| Graduate Degree | 147 (100.0%) | 0 (0.0%) |
| Total | 160 (67.2%) | 78 (32.8%) |
Employment Characteristics in Ulysses
Employment by Class of Employer in Ulysses
Among the 2,757 employed individuals in Ulysses, private company employees (2,190 | 79.4%), local government employees (184 | 6.7%), and self-employed (not incorporated) (117 | 4.2%) make up the most common classes of employment.
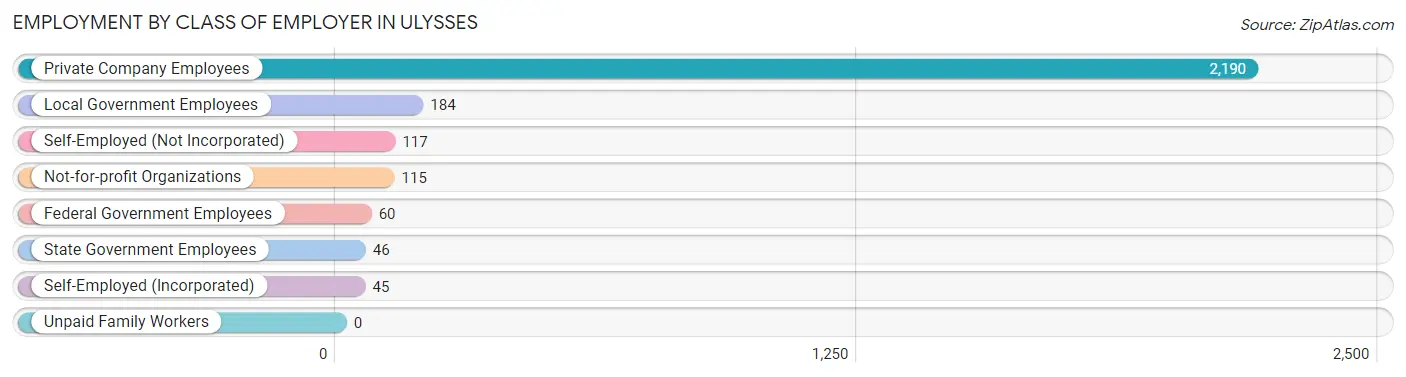
| Employer Class | # Employees | % Employees |
| Private Company Employees | 2,190 | 79.4% |
| Self-Employed (Incorporated) | 45 | 1.6% |
| Self-Employed (Not Incorporated) | 117 | 4.2% |
| Not-for-profit Organizations | 115 | 4.2% |
| Local Government Employees | 184 | 6.7% |
| State Government Employees | 46 | 1.7% |
| Federal Government Employees | 60 | 2.2% |
| Unpaid Family Workers | 0 | 0.0% |
| Total | 2,757 | 100.0% |
Employment Status by Age in Ulysses
According to the labor force statistics for Ulysses, out of the total population over 16 years of age (4,111), 71.7% or 2,948 individuals are in the labor force, with 4.5% or 133 of them unemployed. The age group with the highest labor force participation rate is 55 to 59 years, with 100.0% or 272 individuals in the labor force. Within the labor force, the 16 to 19 years age range has the highest percentage of unemployed individuals, with 21.9% or 75 of them being unemployed.
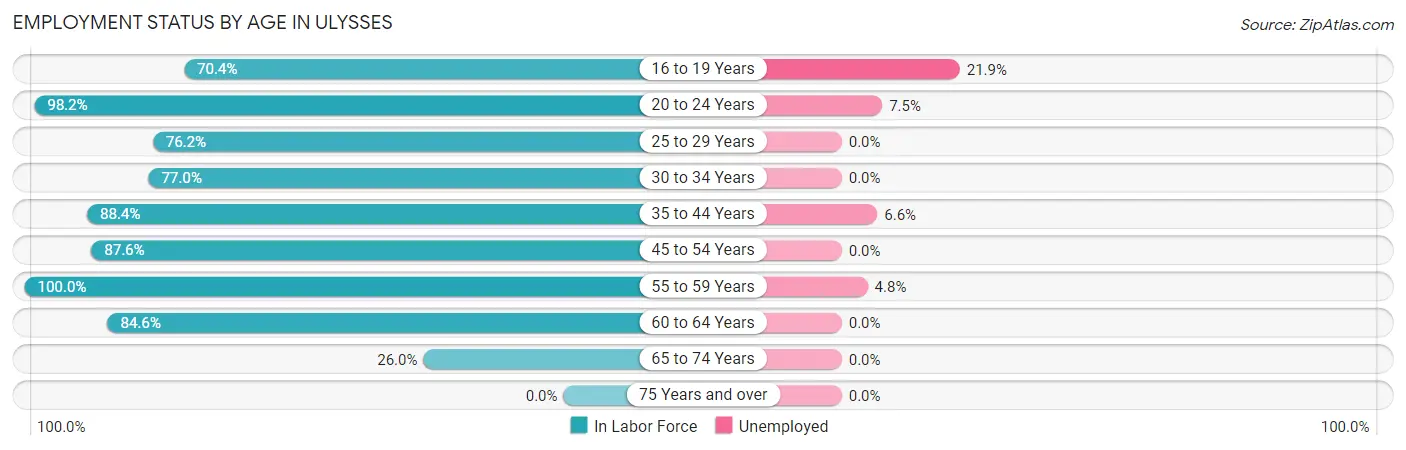
| Age Bracket | In Labor Force | Unemployed |
| 16 to 19 Years | 342 (70.4%) | 75 (21.9%) |
| 20 to 24 Years | 160 (98.2%) | 12 (7.5%) |
| 25 to 29 Years | 214 (76.2%) | 0 (0.0%) |
| 30 to 34 Years | 510 (77.0%) | 0 (0.0%) |
| 35 to 44 Years | 457 (88.4%) | 30 (6.6%) |
| 45 to 54 Years | 581 (87.6%) | 0 (0.0%) |
| 55 to 59 Years | 272 (100.0%) | 13 (4.8%) |
| 60 to 64 Years | 264 (84.6%) | 0 (0.0%) |
| 65 to 74 Years | 149 (26.0%) | 0 (0.0%) |
| 75 Years and over | 0 (0.0%) | 0 (0.0%) |
| Total | 2,948 (71.7%) | 133 (4.5%) |
Employment Status by Educational Attainment in Ulysses
According to labor force statistics for Ulysses, 84.9% of individuals (2,298) out of the total population between 25 and 64 years of age (2,707) are in the labor force, with 1.9% or 44 of them being unemployed. The group with the highest labor force participation rate are those with the educational attainment of college / associate degree, with 89.9% or 930 individuals in the labor force. Within the labor force, individuals with college / associate degree education have the highest percentage of unemployment, with 4.9% or 46 of them being unemployed.
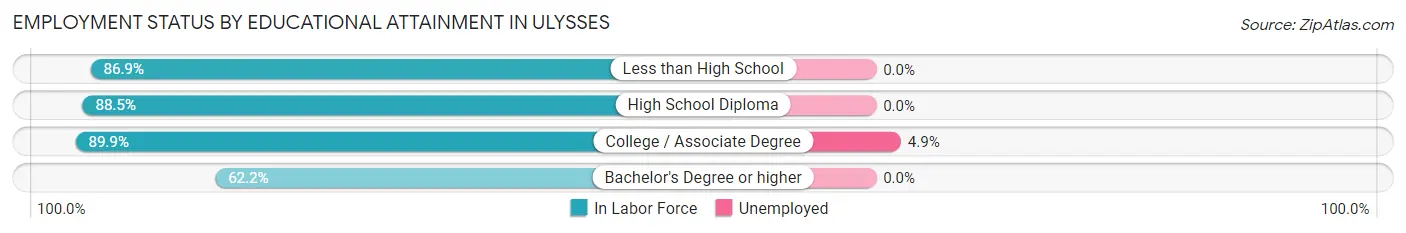
| Educational Attainment | In Labor Force | Unemployed |
| Less than High School | 493 (86.9%) | 0 (0.0%) |
| High School Diploma | 630 (88.5%) | 0 (0.0%) |
| College / Associate Degree | 930 (89.9%) | 51 (4.9%) |
| Bachelor's Degree or higher | 245 (62.2%) | 0 (0.0%) |
| Total | 2,298 (84.9%) | 51 (1.9%) |
Employment Occupations by Sex in Ulysses
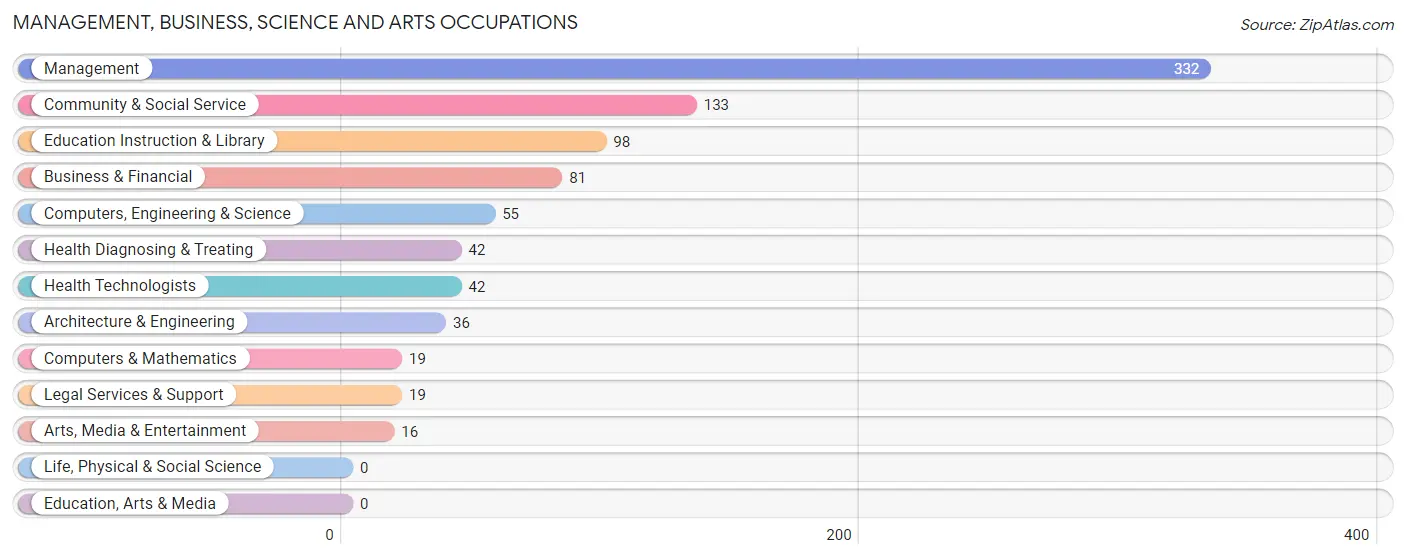
Management, Business, Science and Arts Occupations
The most common Management, Business, Science and Arts occupations in Ulysses are Management (332 | 12.0%), Community & Social Service (133 | 4.8%), Education Instruction & Library (98 | 3.5%), Business & Financial (81 | 2.9%), and Computers, Engineering & Science (55 | 2.0%).
Management, Business, Science and Arts Occupations by Sex
Within the Management, Business, Science and Arts occupations in Ulysses, the most male-oriented occupations are Computers, Engineering & Science (100.0%), Computers & Mathematics (100.0%), and Architecture & Engineering (100.0%), while the most female-oriented occupations are Community & Social Service (100.0%), Legal Services & Support (100.0%), and Education Instruction & Library (100.0%).
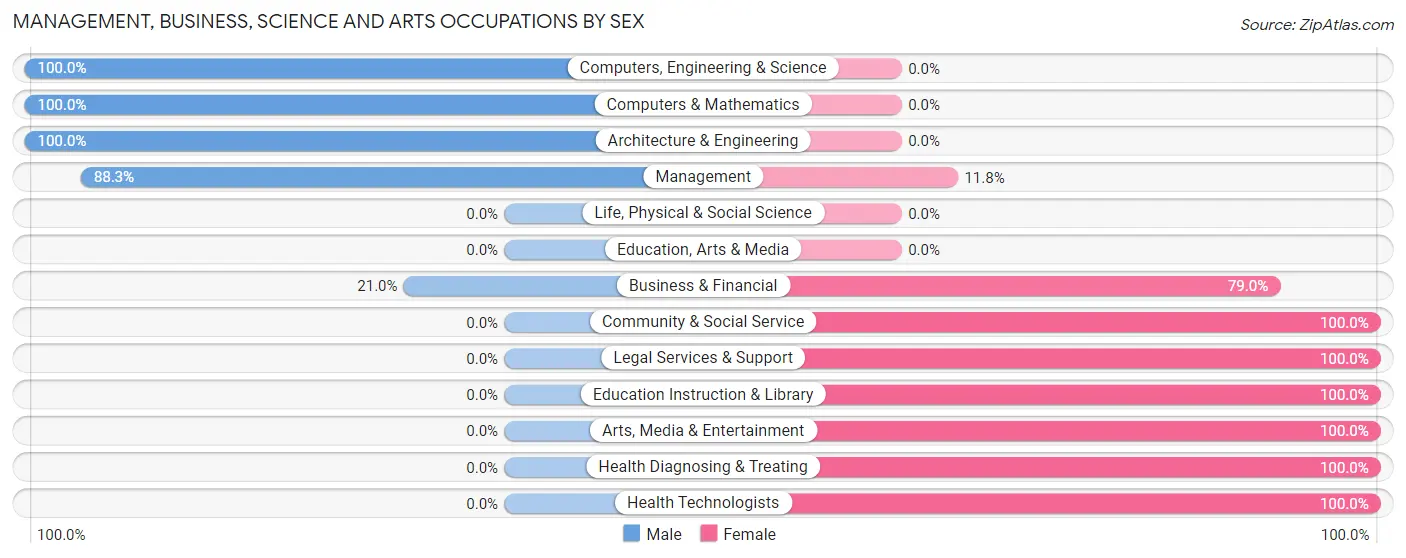
| Occupation | Male | Female |
| Management | 293 (88.2%) | 39 (11.7%) |
| Business & Financial | 17 (21.0%) | 64 (79.0%) |
| Computers, Engineering & Science | 55 (100.0%) | 0 (0.0%) |
| Computers & Mathematics | 19 (100.0%) | 0 (0.0%) |
| Architecture & Engineering | 36 (100.0%) | 0 (0.0%) |
| Life, Physical & Social Science | 0 (0.0%) | 0 (0.0%) |
| Community & Social Service | 0 (0.0%) | 133 (100.0%) |
| Education, Arts & Media | 0 (0.0%) | 0 (0.0%) |
| Legal Services & Support | 0 (0.0%) | 19 (100.0%) |
| Education Instruction & Library | 0 (0.0%) | 98 (100.0%) |
| Arts, Media & Entertainment | 0 (0.0%) | 16 (100.0%) |
| Health Diagnosing & Treating | 0 (0.0%) | 42 (100.0%) |
| Health Technologists | 0 (0.0%) | 42 (100.0%) |
| Total (Category) | 365 (56.8%) | 278 (43.2%) |
| Total (Overall) | 1,640 (59.4%) | 1,119 (40.6%) |
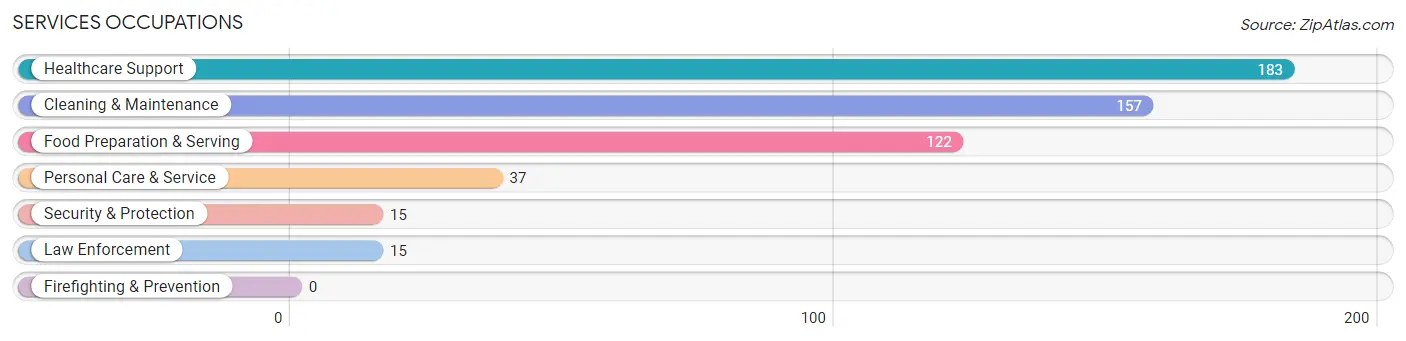
Services Occupations
The most common Services occupations in Ulysses are Healthcare Support (183 | 6.6%), Cleaning & Maintenance (157 | 5.7%), Food Preparation & Serving (122 | 4.4%), Personal Care & Service (37 | 1.3%), and Security & Protection (15 | 0.5%).
Services Occupations by Sex
Within the Services occupations in Ulysses, the most male-oriented occupations are Security & Protection (100.0%), Law Enforcement (100.0%), and Cleaning & Maintenance (34.4%), while the most female-oriented occupations are Healthcare Support (100.0%), Personal Care & Service (100.0%), and Food Preparation & Serving (80.3%).
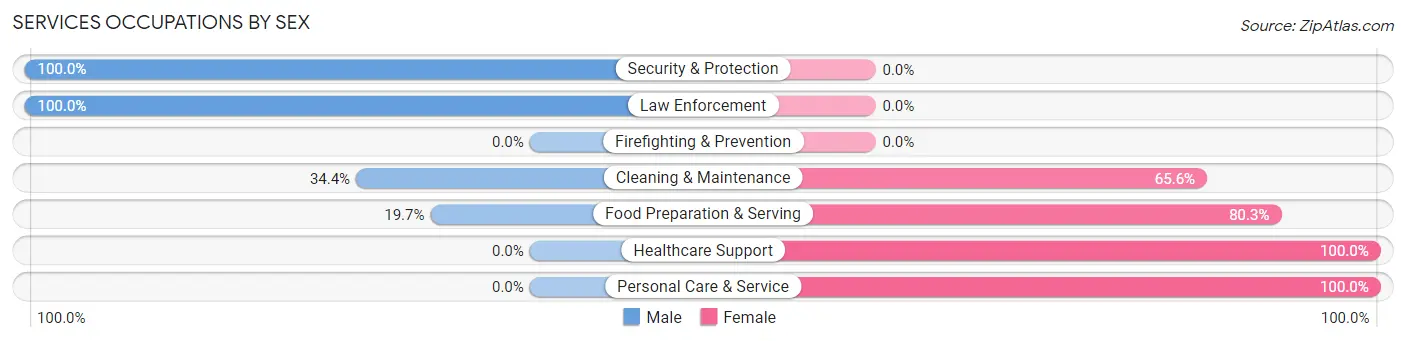
| Occupation | Male | Female |
| Healthcare Support | 0 (0.0%) | 183 (100.0%) |
| Security & Protection | 15 (100.0%) | 0 (0.0%) |
| Firefighting & Prevention | 0 (0.0%) | 0 (0.0%) |
| Law Enforcement | 15 (100.0%) | 0 (0.0%) |
| Food Preparation & Serving | 24 (19.7%) | 98 (80.3%) |
| Cleaning & Maintenance | 54 (34.4%) | 103 (65.6%) |
| Personal Care & Service | 0 (0.0%) | 37 (100.0%) |
| Total (Category) | 93 (18.1%) | 421 (81.9%) |
| Total (Overall) | 1,640 (59.4%) | 1,119 (40.6%) |
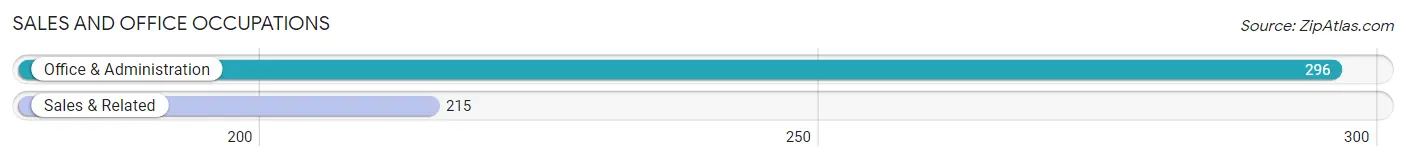
Sales and Office Occupations
The most common Sales and Office occupations in Ulysses are Office & Administration (296 | 10.7%), and Sales & Related (215 | 7.8%).
Sales and Office Occupations by Sex
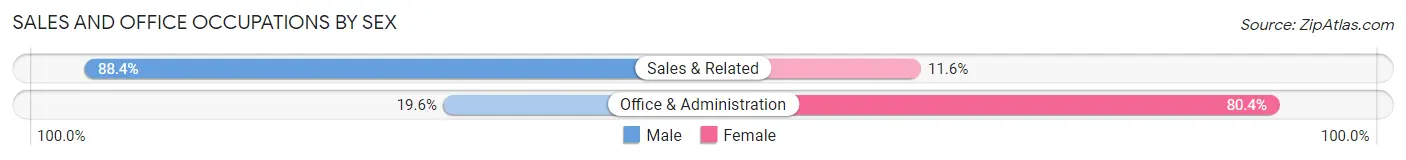
| Occupation | Male | Female |
| Sales & Related | 190 (88.4%) | 25 (11.6%) |
| Office & Administration | 58 (19.6%) | 238 (80.4%) |
| Total (Category) | 248 (48.5%) | 263 (51.5%) |
| Total (Overall) | 1,640 (59.4%) | 1,119 (40.6%) |
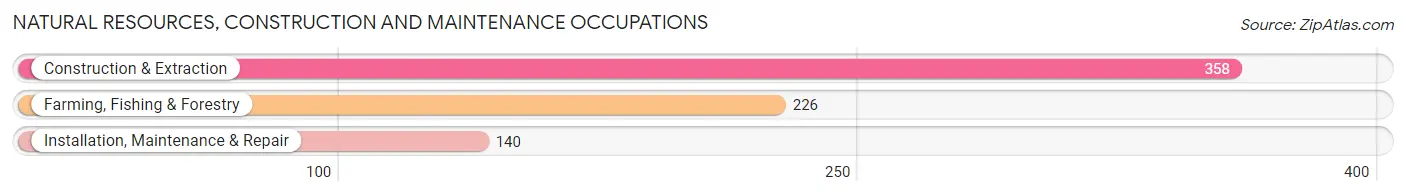
Natural Resources, Construction and Maintenance Occupations
The most common Natural Resources, Construction and Maintenance occupations in Ulysses are Construction & Extraction (358 | 13.0%), Farming, Fishing & Forestry (226 | 8.2%), and Installation, Maintenance & Repair (140 | 5.1%).
Natural Resources, Construction and Maintenance Occupations by Sex
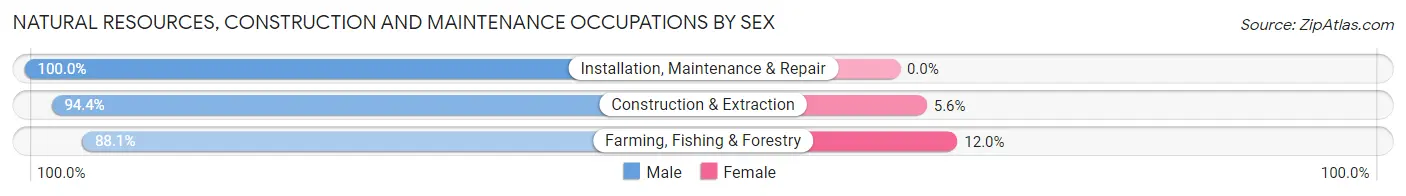
| Occupation | Male | Female |
| Farming, Fishing & Forestry | 199 (88.0%) | 27 (11.9%) |
| Construction & Extraction | 338 (94.4%) | 20 (5.6%) |
| Installation, Maintenance & Repair | 140 (100.0%) | 0 (0.0%) |
| Total (Category) | 677 (93.5%) | 47 (6.5%) |
| Total (Overall) | 1,640 (59.4%) | 1,119 (40.6%) |
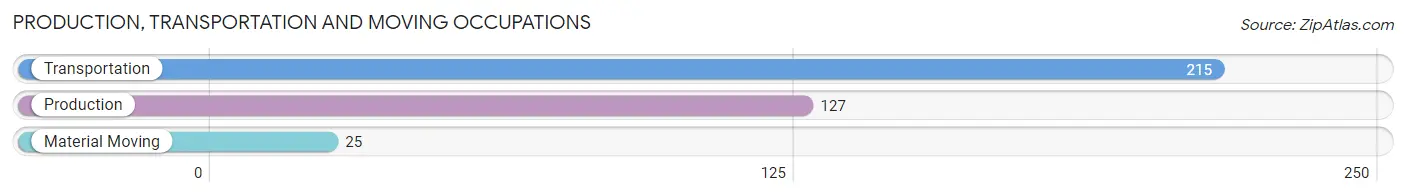
Production, Transportation and Moving Occupations
The most common Production, Transportation and Moving occupations in Ulysses are Transportation (215 | 7.8%), Production (127 | 4.6%), and Material Moving (25 | 0.9%).
Production, Transportation and Moving Occupations by Sex
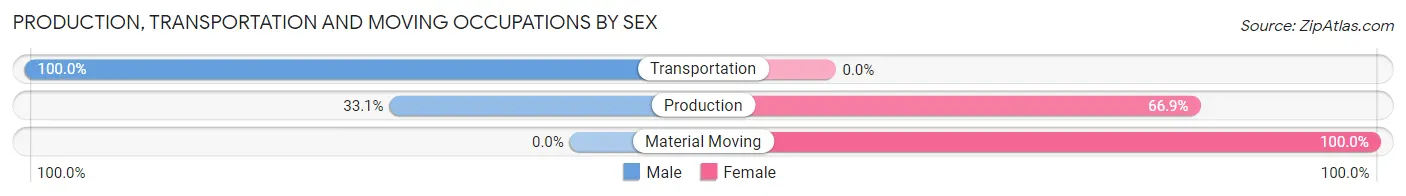
| Occupation | Male | Female |
| Production | 42 (33.1%) | 85 (66.9%) |
| Transportation | 215 (100.0%) | 0 (0.0%) |
| Material Moving | 0 (0.0%) | 25 (100.0%) |
| Total (Category) | 257 (70.0%) | 110 (30.0%) |
| Total (Overall) | 1,640 (59.4%) | 1,119 (40.6%) |
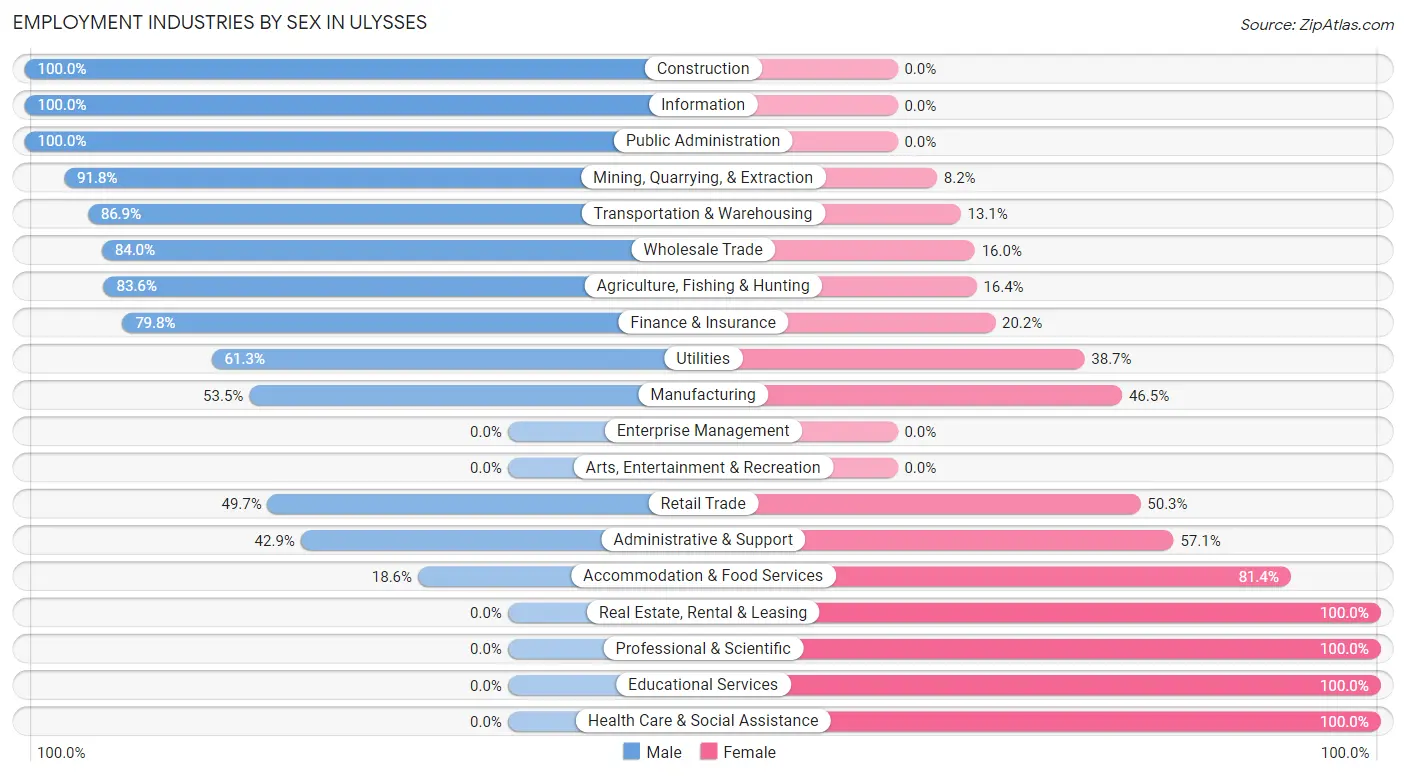
Employment Industries by Sex in Ulysses
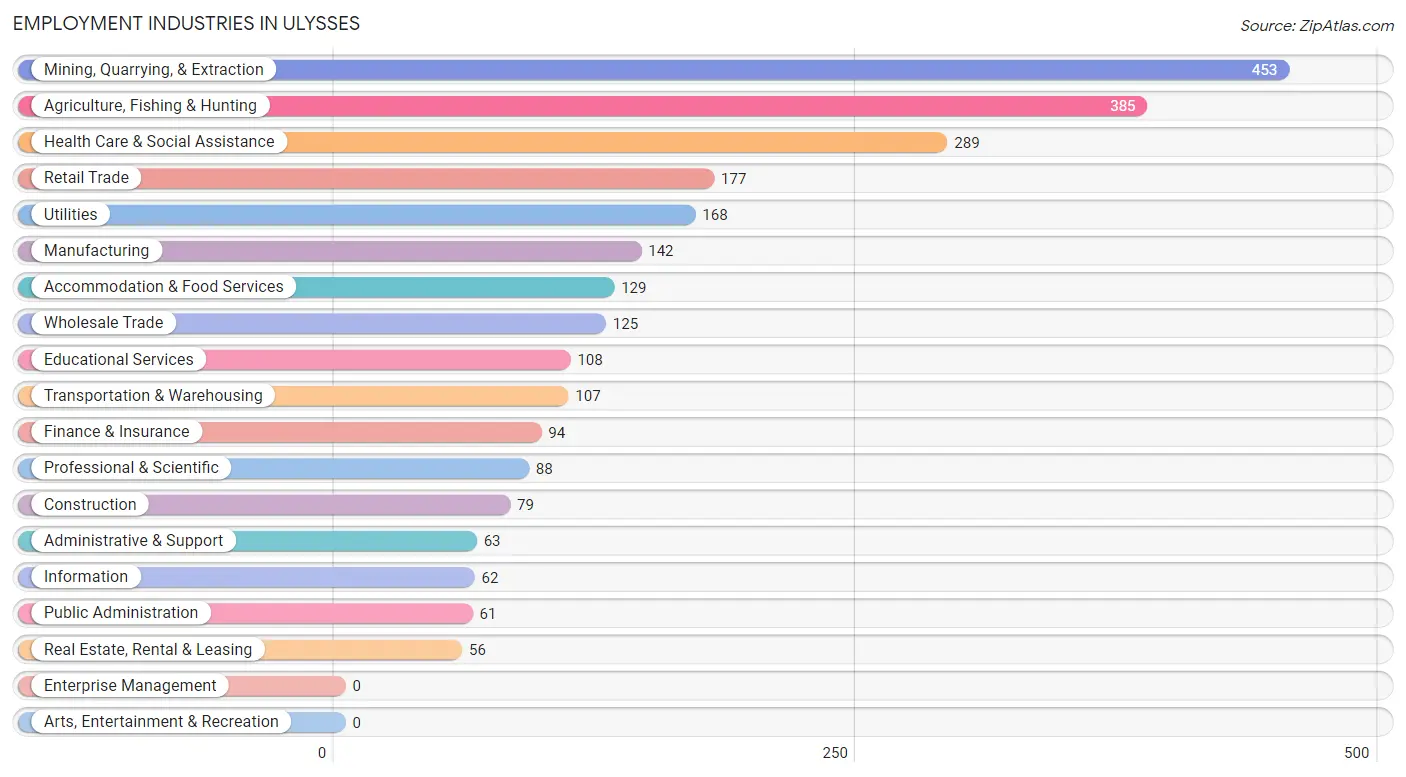
Employment Industries in Ulysses
The major employment industries in Ulysses include Mining, Quarrying, & Extraction (453 | 16.4%), Agriculture, Fishing & Hunting (385 | 14.0%), Health Care & Social Assistance (289 | 10.5%), Retail Trade (177 | 6.4%), and Utilities (168 | 6.1%).
Employment Industries by Sex in Ulysses
The Ulysses industries that see more men than women are Construction (100.0%), Information (100.0%), and Public Administration (100.0%), whereas the industries that tend to have a higher number of women are Real Estate, Rental & Leasing (100.0%), Professional & Scientific (100.0%), and Educational Services (100.0%).
| Industry | Male | Female |
| Agriculture, Fishing & Hunting | 322 (83.6%) | 63 (16.4%) |
| Mining, Quarrying, & Extraction | 416 (91.8%) | 37 (8.2%) |
| Construction | 79 (100.0%) | 0 (0.0%) |
| Manufacturing | 76 (53.5%) | 66 (46.5%) |
| Wholesale Trade | 105 (84.0%) | 20 (16.0%) |
| Retail Trade | 88 (49.7%) | 89 (50.3%) |
| Transportation & Warehousing | 93 (86.9%) | 14 (13.1%) |
| Utilities | 103 (61.3%) | 65 (38.7%) |
| Information | 62 (100.0%) | 0 (0.0%) |
| Finance & Insurance | 75 (79.8%) | 19 (20.2%) |
| Real Estate, Rental & Leasing | 0 (0.0%) | 56 (100.0%) |
| Professional & Scientific | 0 (0.0%) | 88 (100.0%) |
| Enterprise Management | 0 (0.0%) | 0 (0.0%) |
| Administrative & Support | 27 (42.9%) | 36 (57.1%) |
| Educational Services | 0 (0.0%) | 108 (100.0%) |
| Health Care & Social Assistance | 0 (0.0%) | 289 (100.0%) |
| Arts, Entertainment & Recreation | 0 (0.0%) | 0 (0.0%) |
| Accommodation & Food Services | 24 (18.6%) | 105 (81.4%) |
| Public Administration | 61 (100.0%) | 0 (0.0%) |
| Total | 1,640 (59.4%) | 1,119 (40.6%) |
Education in Ulysses
School Enrollment in Ulysses
The most common levels of schooling among the 1,756 students in Ulysses are elementary school (529 | 30.1%), middle school (509 | 29.0%), and high school (429 | 24.4%).
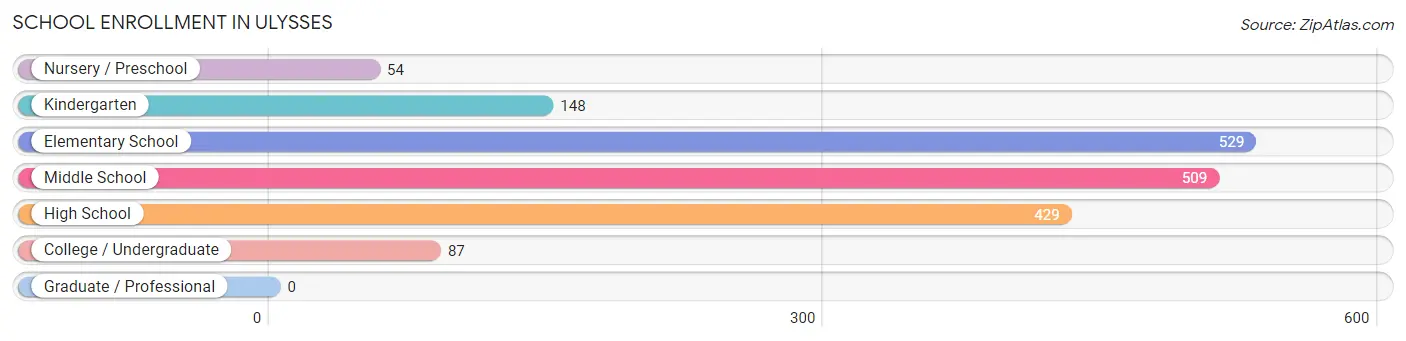
| School Level | # Students | % Students |
| Nursery / Preschool | 54 | 3.1% |
| Kindergarten | 148 | 8.4% |
| Elementary School | 529 | 30.1% |
| Middle School | 509 | 29.0% |
| High School | 429 | 24.4% |
| College / Undergraduate | 87 | 5.0% |
| Graduate / Professional | 0 | 0.0% |
| Total | 1,756 | 100.0% |
School Enrollment by Age by Funding Source in Ulysses
Out of a total of 1,756 students who are enrolled in schools in Ulysses, 104 (5.9%) attend a private institution, while the remaining 1,652 (94.1%) are enrolled in public schools. The age group of 15 to 17 year olds has the highest likelihood of being enrolled in private schools, with 53 (23.7% in the age bracket) enrolled. Conversely, the age group of 3 to 4 year olds has the lowest likelihood of being enrolled in a private school, with 54 (100.0% in the age bracket) attending a public institution.
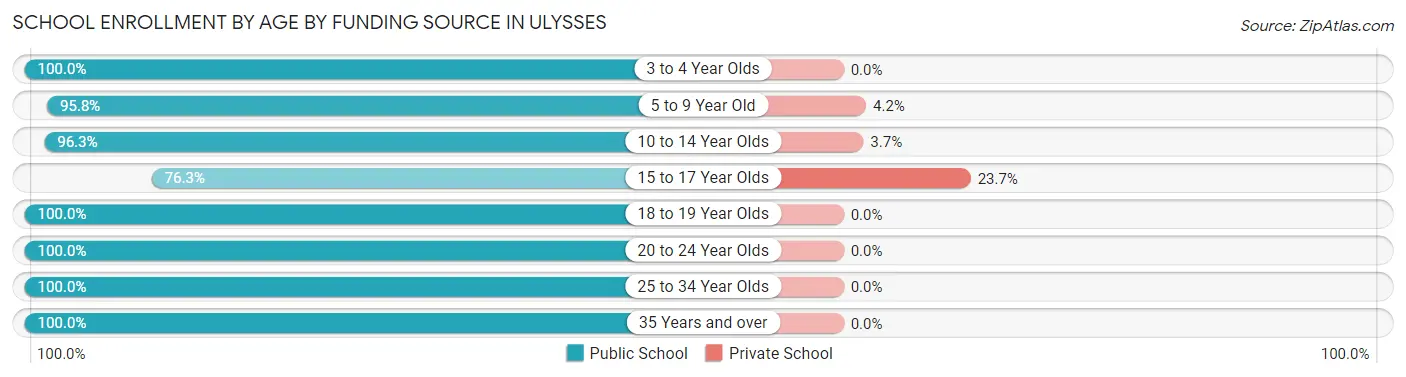
| Age Bracket | Public School | Private School |
| 3 to 4 Year Olds | 54 (100.0%) | 0 (0.0%) |
| 5 to 9 Year Old | 575 (95.8%) | 25 (4.2%) |
| 10 to 14 Year Olds | 654 (96.3%) | 25 (3.7%) |
| 15 to 17 Year Olds | 171 (76.3%) | 53 (23.7%) |
| 18 to 19 Year Olds | 112 (100.0%) | 0 (0.0%) |
| 20 to 24 Year Olds | 12 (100.0%) | 0 (0.0%) |
| 25 to 34 Year Olds | 62 (100.0%) | 0 (0.0%) |
| 35 Years and over | 13 (100.0%) | 0 (0.0%) |
| Total | 1,652 (94.1%) | 104 (5.9%) |
Educational Attainment by Field of Study in Ulysses
Education (153 | 24.2%), science & technology (147 | 23.2%), business (105 | 16.6%), arts & humanities (63 | 10.0%), and bio, nature & agricultural (38 | 6.0%) are the most common fields of study among 633 individuals in Ulysses who have obtained a bachelor's degree or higher.
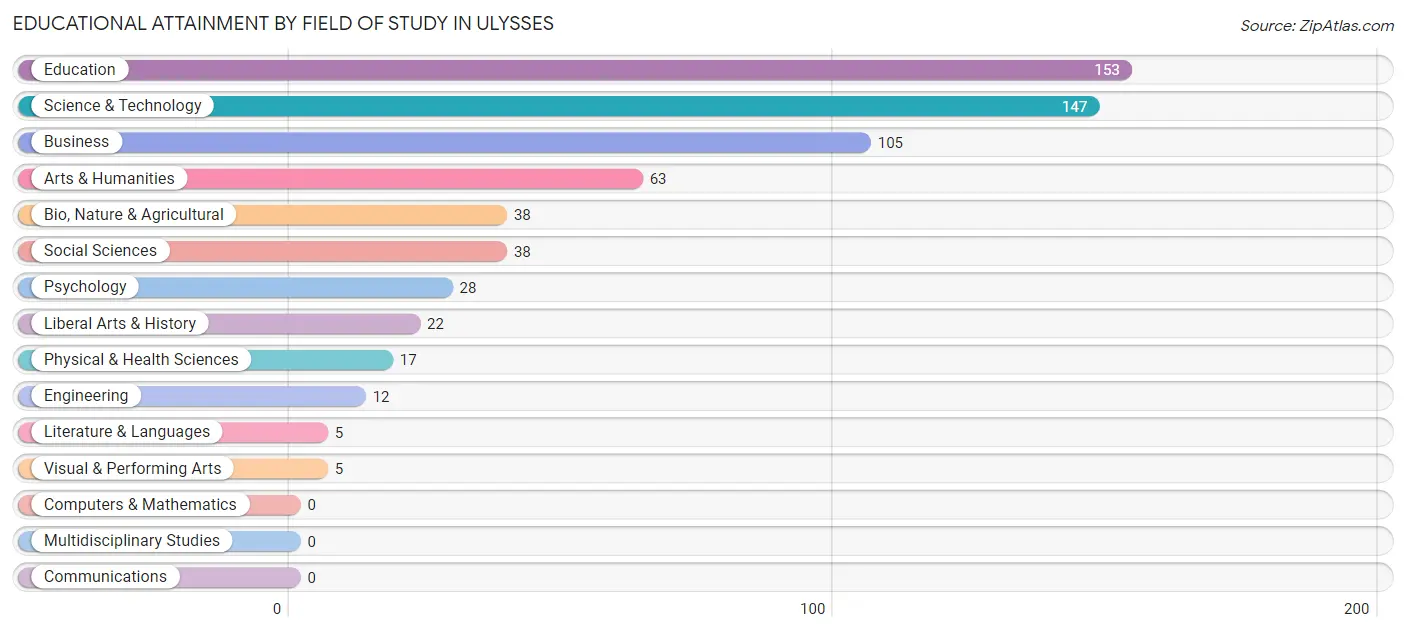
| Field of Study | # Graduates | % Graduates |
| Computers & Mathematics | 0 | 0.0% |
| Bio, Nature & Agricultural | 38 | 6.0% |
| Physical & Health Sciences | 17 | 2.7% |
| Psychology | 28 | 4.4% |
| Social Sciences | 38 | 6.0% |
| Engineering | 12 | 1.9% |
| Multidisciplinary Studies | 0 | 0.0% |
| Science & Technology | 147 | 23.2% |
| Business | 105 | 16.6% |
| Education | 153 | 24.2% |
| Literature & Languages | 5 | 0.8% |
| Liberal Arts & History | 22 | 3.5% |
| Visual & Performing Arts | 5 | 0.8% |
| Communications | 0 | 0.0% |
| Arts & Humanities | 63 | 10.0% |
| Total | 633 | 100.0% |
Transportation & Commute in Ulysses
Vehicle Availability by Sex in Ulysses
The most prevalent vehicle ownership categories in Ulysses are males with 3 vehicles (507, accounting for 29.8%) and females with 3 vehicles (244, making up 48.0%).
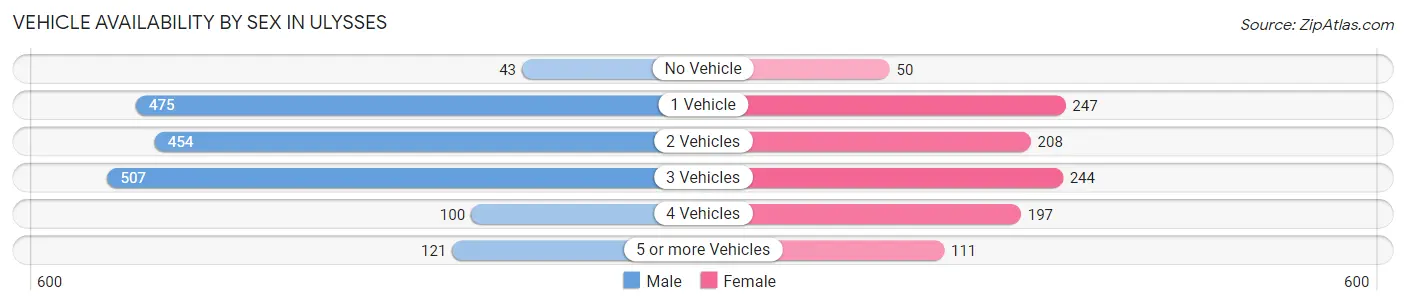
| Vehicles Available | Male | Female |
| No Vehicle | 43 (2.5%) | 50 (4.7%) |
| 1 Vehicle | 475 (27.9%) | 247 (23.4%) |
| 2 Vehicles | 454 (26.7%) | 208 (19.7%) |
| 3 Vehicles | 507 (29.8%) | 244 (23.1%) |
| 4 Vehicles | 100 (5.9%) | 197 (18.6%) |
| 5 or more Vehicles | 121 (7.1%) | 111 (10.5%) |
| Total | 1,700 (100.0%) | 1,057 (100.0%) |
Commute Time in Ulysses
The most frequently occuring commute durations in Ulysses are 5 to 9 minutes (1,068 commuters, 41.2%), 10 to 14 minutes (526 commuters, 20.3%), and less than 5 minutes (271 commuters, 10.5%).
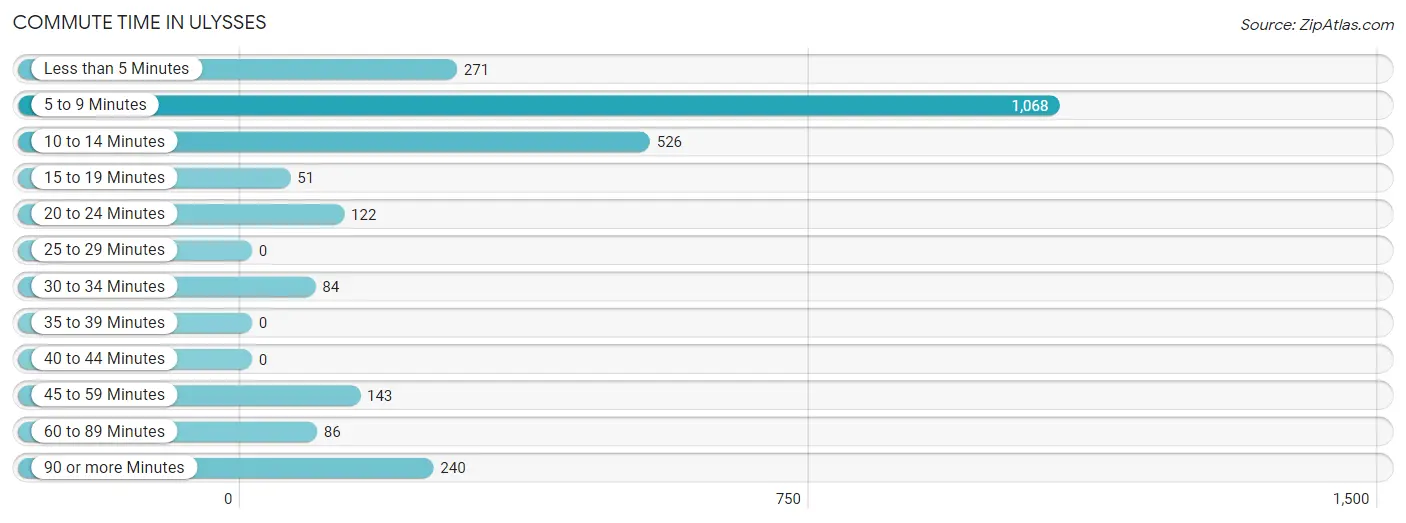
| Commute Time | # Commuters | % Commuters |
| Less than 5 Minutes | 271 | 10.5% |
| 5 to 9 Minutes | 1,068 | 41.2% |
| 10 to 14 Minutes | 526 | 20.3% |
| 15 to 19 Minutes | 51 | 2.0% |
| 20 to 24 Minutes | 122 | 4.7% |
| 25 to 29 Minutes | 0 | 0.0% |
| 30 to 34 Minutes | 84 | 3.2% |
| 35 to 39 Minutes | 0 | 0.0% |
| 40 to 44 Minutes | 0 | 0.0% |
| 45 to 59 Minutes | 143 | 5.5% |
| 60 to 89 Minutes | 86 | 3.3% |
| 90 or more Minutes | 240 | 9.3% |
Commute Time by Sex in Ulysses
The most common commute times in Ulysses are 5 to 9 minutes (514 commuters, 31.0%) for males and 5 to 9 minutes (554 commuters, 59.3%) for females.
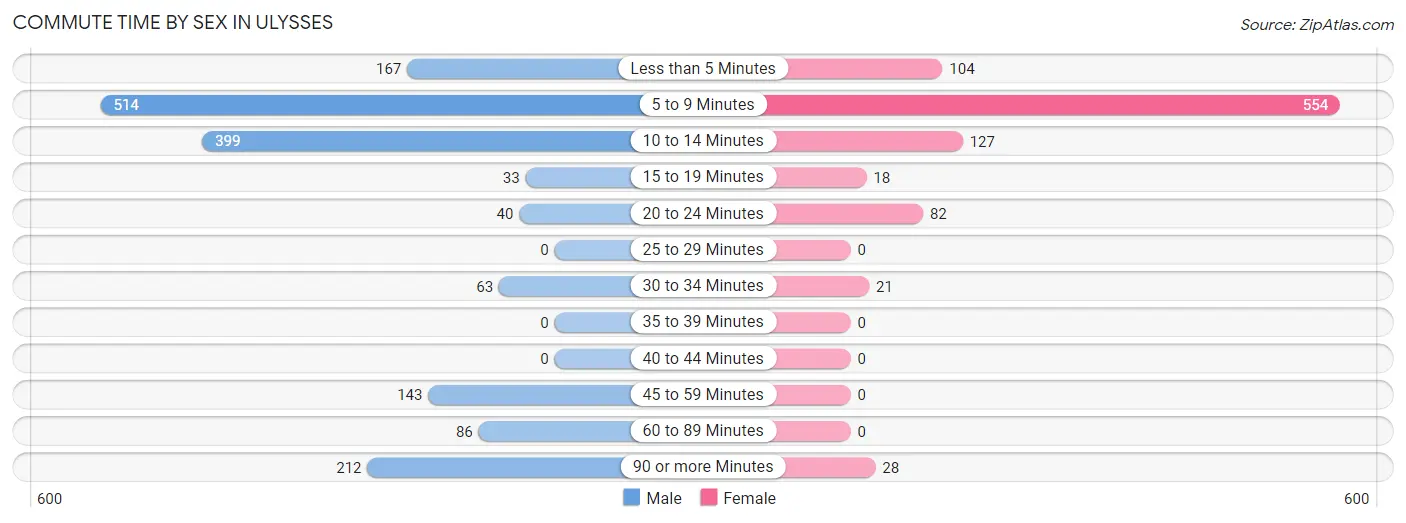
| Commute Time | Male | Female |
| Less than 5 Minutes | 167 (10.1%) | 104 (11.1%) |
| 5 to 9 Minutes | 514 (31.0%) | 554 (59.3%) |
| 10 to 14 Minutes | 399 (24.1%) | 127 (13.6%) |
| 15 to 19 Minutes | 33 (2.0%) | 18 (1.9%) |
| 20 to 24 Minutes | 40 (2.4%) | 82 (8.8%) |
| 25 to 29 Minutes | 0 (0.0%) | 0 (0.0%) |
| 30 to 34 Minutes | 63 (3.8%) | 21 (2.2%) |
| 35 to 39 Minutes | 0 (0.0%) | 0 (0.0%) |
| 40 to 44 Minutes | 0 (0.0%) | 0 (0.0%) |
| 45 to 59 Minutes | 143 (8.6%) | 0 (0.0%) |
| 60 to 89 Minutes | 86 (5.2%) | 0 (0.0%) |
| 90 or more Minutes | 212 (12.8%) | 28 (3.0%) |
Time of Departure to Work by Sex in Ulysses
The most frequent times of departure to work in Ulysses are 6:00 AM to 6:29 AM (300, 18.1%) for males and 7:30 AM to 7:59 AM (220, 23.5%) for females.
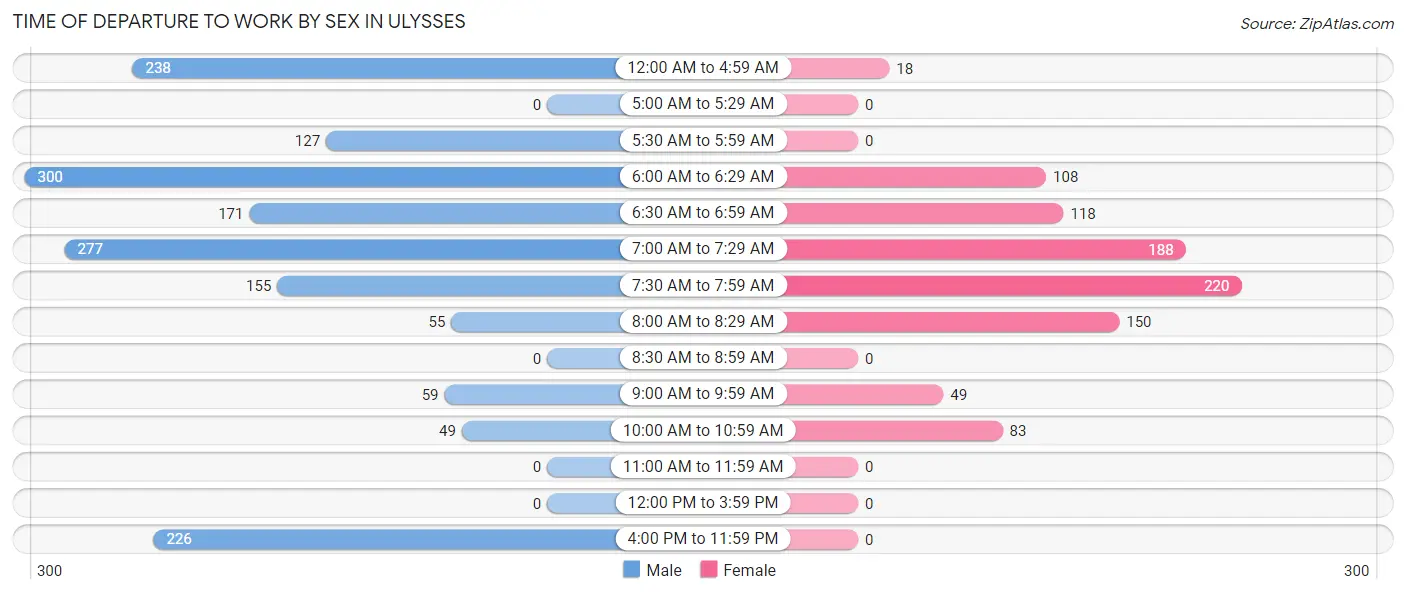
| Time of Departure | Male | Female |
| 12:00 AM to 4:59 AM | 238 (14.4%) | 18 (1.9%) |
| 5:00 AM to 5:29 AM | 0 (0.0%) | 0 (0.0%) |
| 5:30 AM to 5:59 AM | 127 (7.7%) | 0 (0.0%) |
| 6:00 AM to 6:29 AM | 300 (18.1%) | 108 (11.6%) |
| 6:30 AM to 6:59 AM | 171 (10.3%) | 118 (12.6%) |
| 7:00 AM to 7:29 AM | 277 (16.7%) | 188 (20.1%) |
| 7:30 AM to 7:59 AM | 155 (9.3%) | 220 (23.5%) |
| 8:00 AM to 8:29 AM | 55 (3.3%) | 150 (16.1%) |
| 8:30 AM to 8:59 AM | 0 (0.0%) | 0 (0.0%) |
| 9:00 AM to 9:59 AM | 59 (3.6%) | 49 (5.2%) |
| 10:00 AM to 10:59 AM | 49 (3.0%) | 83 (8.9%) |
| 11:00 AM to 11:59 AM | 0 (0.0%) | 0 (0.0%) |
| 12:00 PM to 3:59 PM | 0 (0.0%) | 0 (0.0%) |
| 4:00 PM to 11:59 PM | 226 (13.6%) | 0 (0.0%) |
| Total | 1,657 (100.0%) | 934 (100.0%) |
Housing Occupancy in Ulysses
Occupancy by Ownership in Ulysses
Of the total 1,803 dwellings in Ulysses, owner-occupied units account for 1,302 (72.2%), while renter-occupied units make up 501 (27.8%).
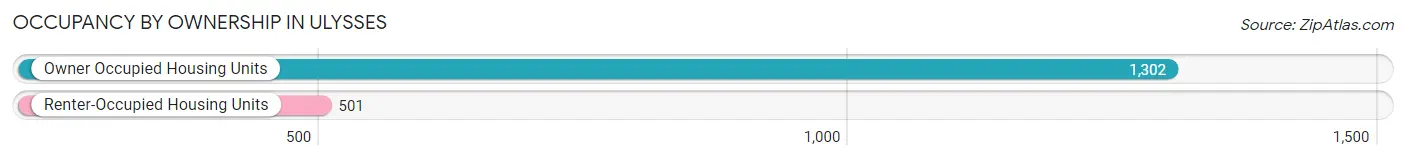
| Occupancy | # Housing Units | % Housing Units |
| Owner Occupied Housing Units | 1,302 | 72.2% |
| Renter-Occupied Housing Units | 501 | 27.8% |
| Total Occupied Housing Units | 1,803 | 100.0% |
Occupancy by Household Size in Ulysses
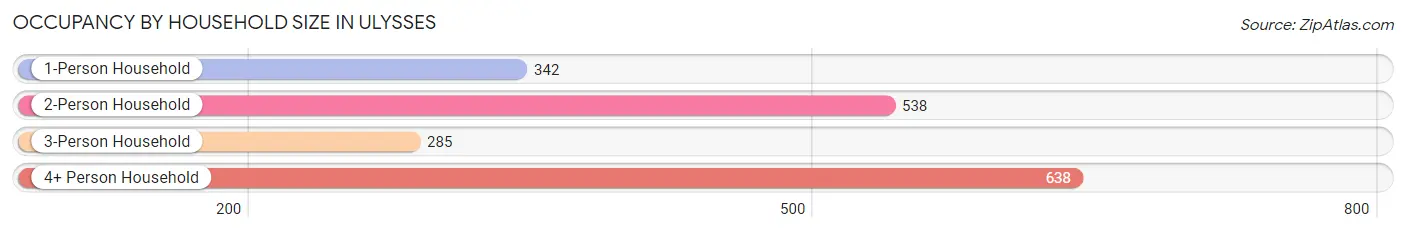
| Household Size | # Housing Units | % Housing Units |
| 1-Person Household | 342 | 19.0% |
| 2-Person Household | 538 | 29.8% |
| 3-Person Household | 285 | 15.8% |
| 4+ Person Household | 638 | 35.4% |
| Total Housing Units | 1,803 | 100.0% |
Occupancy by Ownership by Household Size in Ulysses
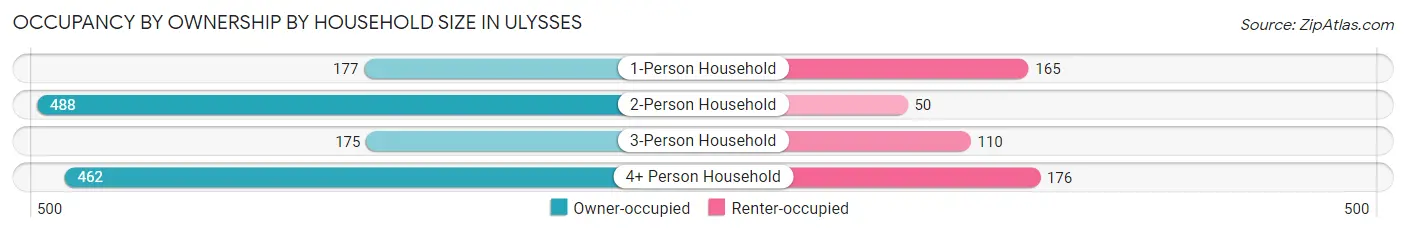
| Household Size | Owner-occupied | Renter-occupied |
| 1-Person Household | 177 (51.7%) | 165 (48.2%) |
| 2-Person Household | 488 (90.7%) | 50 (9.3%) |
| 3-Person Household | 175 (61.4%) | 110 (38.6%) |
| 4+ Person Household | 462 (72.4%) | 176 (27.6%) |
| Total Housing Units | 1,302 (72.2%) | 501 (27.8%) |
Occupancy by Educational Attainment in Ulysses
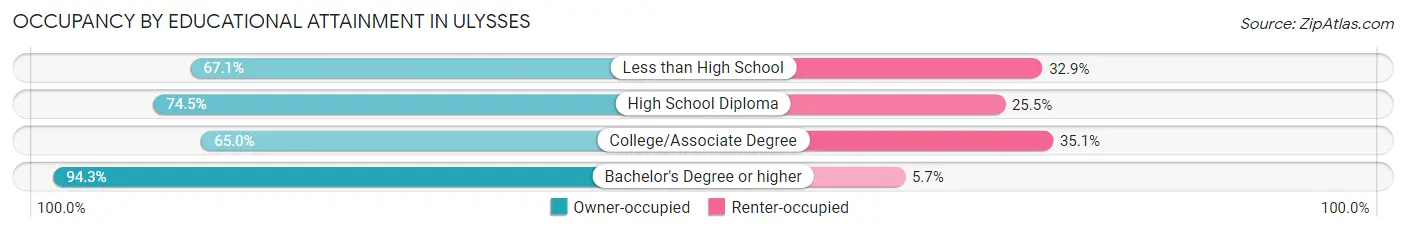
| Household Size | Owner-occupied | Renter-occupied |
| Less than High School | 381 (67.1%) | 187 (32.9%) |
| High School Diploma | 207 (74.5%) | 71 (25.5%) |
| College/Associate Degree | 417 (64.9%) | 225 (35.0%) |
| Bachelor's Degree or higher | 297 (94.3%) | 18 (5.7%) |
Occupancy by Age of Householder in Ulysses
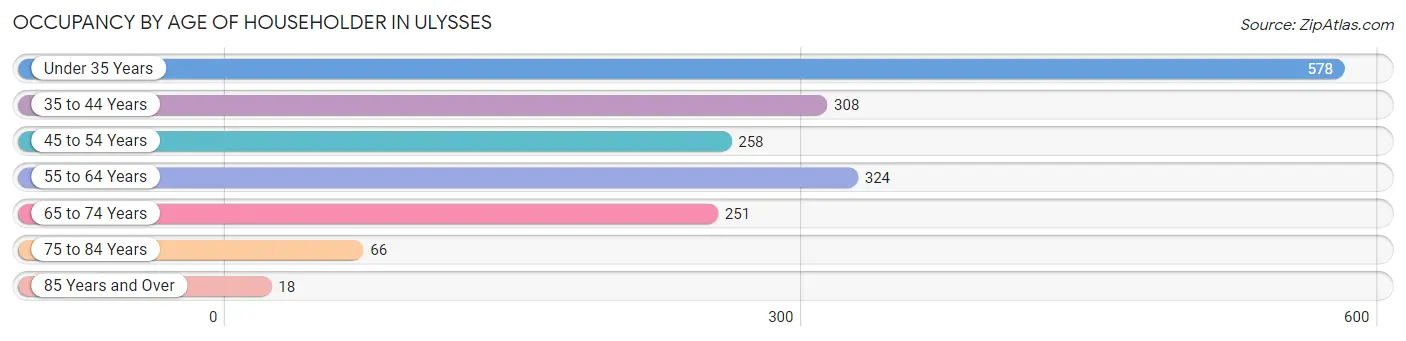
| Age Bracket | # Households | % Households |
| Under 35 Years | 578 | 32.1% |
| 35 to 44 Years | 308 | 17.1% |
| 45 to 54 Years | 258 | 14.3% |
| 55 to 64 Years | 324 | 18.0% |
| 65 to 74 Years | 251 | 13.9% |
| 75 to 84 Years | 66 | 3.7% |
| 85 Years and Over | 18 | 1.0% |
| Total | 1,803 | 100.0% |
Housing Finances in Ulysses
Median Income by Occupancy in Ulysses
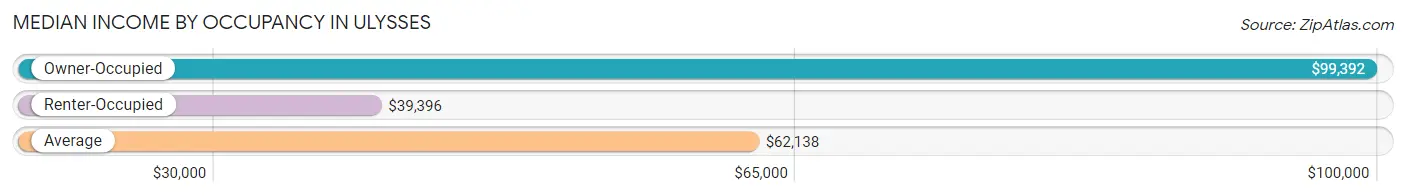
| Occupancy Type | # Households | Median Income |
| Owner-Occupied | 1,302 (72.2%) | $99,392 |
| Renter-Occupied | 501 (27.8%) | $39,396 |
| Average | 1,803 (100.0%) | $62,138 |
Occupancy by Householder Income Bracket in Ulysses
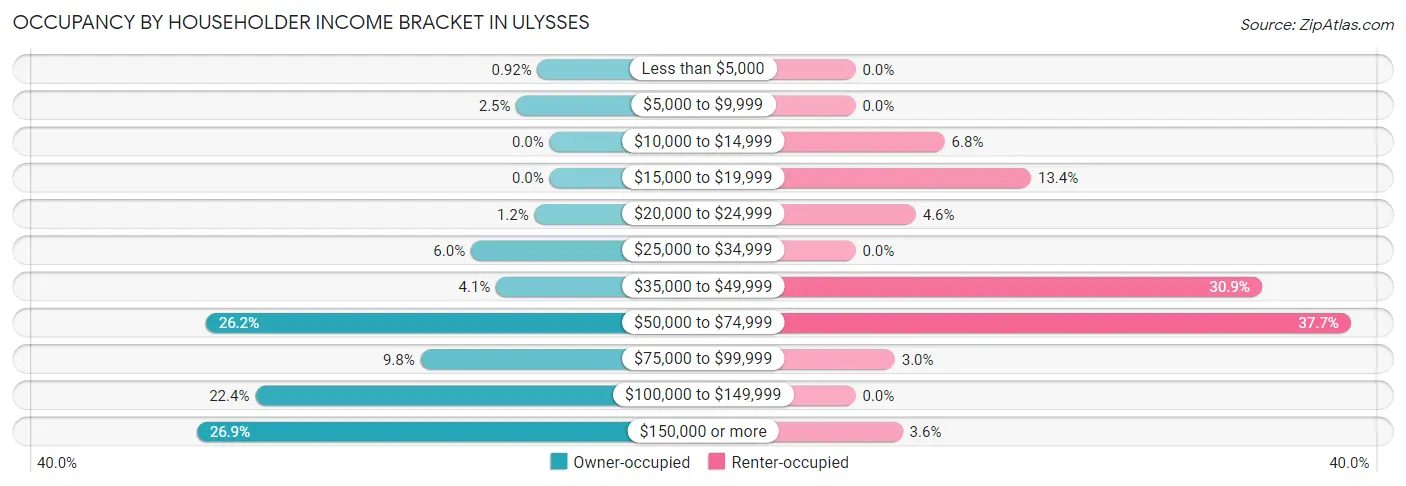
| Income Bracket | Owner-occupied | Renter-occupied |
| Less than $5,000 | 12 (0.9%) | 0 (0.0%) |
| $5,000 to $9,999 | 33 (2.5%) | 0 (0.0%) |
| $10,000 to $14,999 | 0 (0.0%) | 34 (6.8%) |
| $15,000 to $19,999 | 0 (0.0%) | 67 (13.4%) |
| $20,000 to $24,999 | 15 (1.1%) | 23 (4.6%) |
| $25,000 to $34,999 | 78 (6.0%) | 0 (0.0%) |
| $35,000 to $49,999 | 53 (4.1%) | 155 (30.9%) |
| $50,000 to $74,999 | 341 (26.2%) | 189 (37.7%) |
| $75,000 to $99,999 | 128 (9.8%) | 15 (3.0%) |
| $100,000 to $149,999 | 292 (22.4%) | 0 (0.0%) |
| $150,000 or more | 350 (26.9%) | 18 (3.6%) |
| Total | 1,302 (100.0%) | 501 (100.0%) |
Monthly Housing Cost Tiers in Ulysses
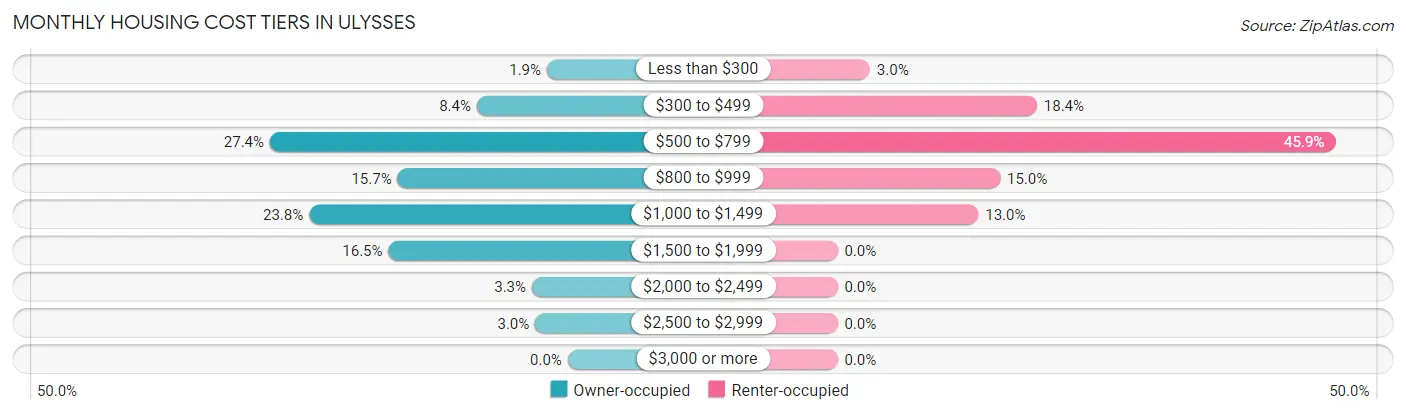
| Monthly Cost | Owner-occupied | Renter-occupied |
| Less than $300 | 25 (1.9%) | 15 (3.0%) |
| $300 to $499 | 109 (8.4%) | 92 (18.4%) |
| $500 to $799 | 357 (27.4%) | 230 (45.9%) |
| $800 to $999 | 204 (15.7%) | 75 (15.0%) |
| $1,000 to $1,499 | 310 (23.8%) | 65 (13.0%) |
| $1,500 to $1,999 | 215 (16.5%) | 0 (0.0%) |
| $2,000 to $2,499 | 43 (3.3%) | 0 (0.0%) |
| $2,500 to $2,999 | 39 (3.0%) | 0 (0.0%) |
| $3,000 or more | 0 (0.0%) | 0 (0.0%) |
| Total | 1,302 (100.0%) | 501 (100.0%) |
Physical Housing Characteristics in Ulysses
Housing Structures in Ulysses
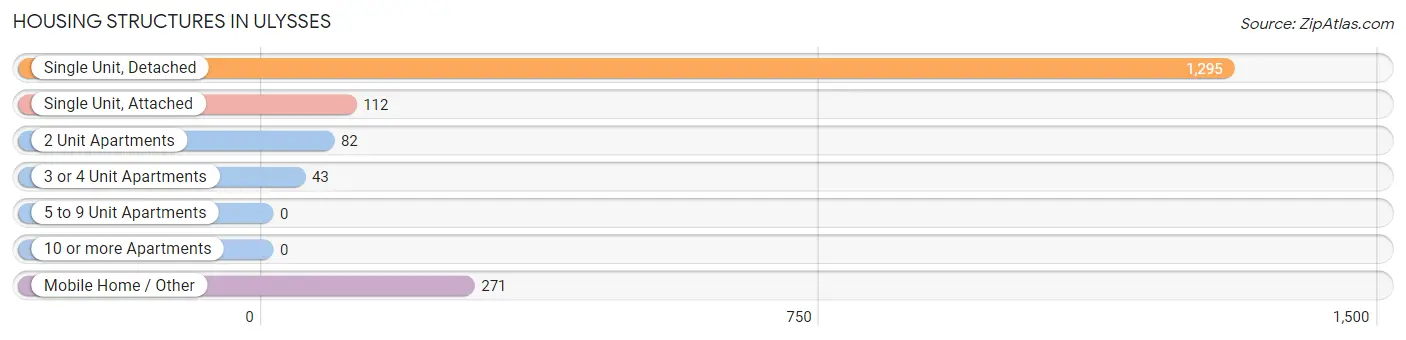
| Structure Type | # Housing Units | % Housing Units |
| Single Unit, Detached | 1,295 | 71.8% |
| Single Unit, Attached | 112 | 6.2% |
| 2 Unit Apartments | 82 | 4.5% |
| 3 or 4 Unit Apartments | 43 | 2.4% |
| 5 to 9 Unit Apartments | 0 | 0.0% |
| 10 or more Apartments | 0 | 0.0% |
| Mobile Home / Other | 271 | 15.0% |
| Total | 1,803 | 100.0% |
Housing Structures by Occupancy in Ulysses
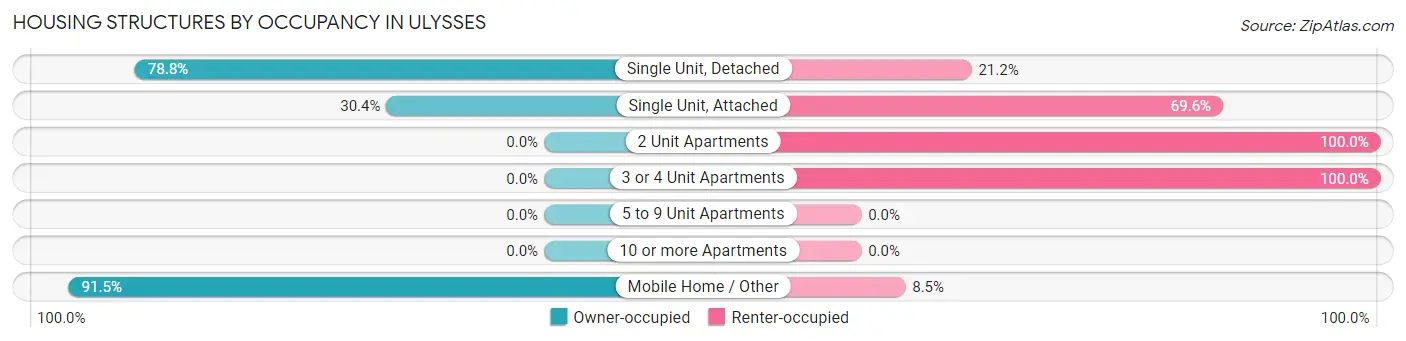
| Structure Type | Owner-occupied | Renter-occupied |
| Single Unit, Detached | 1,020 (78.8%) | 275 (21.2%) |
| Single Unit, Attached | 34 (30.4%) | 78 (69.6%) |
| 2 Unit Apartments | 0 (0.0%) | 82 (100.0%) |
| 3 or 4 Unit Apartments | 0 (0.0%) | 43 (100.0%) |
| 5 to 9 Unit Apartments | 0 (0.0%) | 0 (0.0%) |
| 10 or more Apartments | 0 (0.0%) | 0 (0.0%) |
| Mobile Home / Other | 248 (91.5%) | 23 (8.5%) |
| Total | 1,302 (72.2%) | 501 (27.8%) |
Housing Structures by Number of Rooms in Ulysses
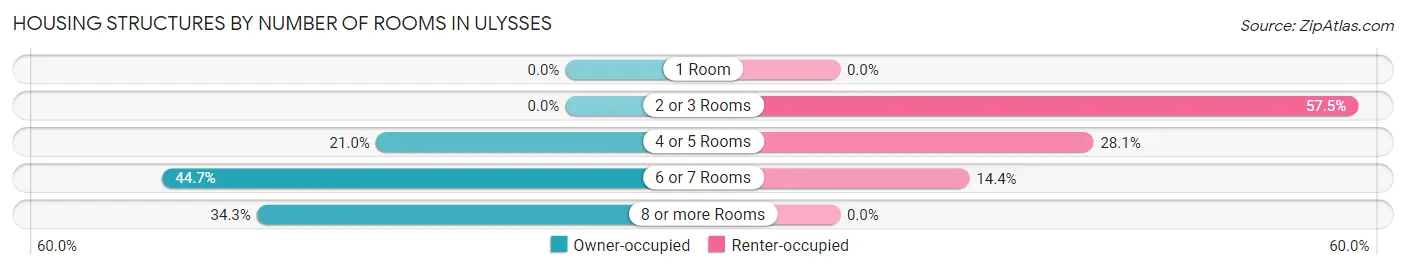
| Number of Rooms | Owner-occupied | Renter-occupied |
| 1 Room | 0 (0.0%) | 0 (0.0%) |
| 2 or 3 Rooms | 0 (0.0%) | 288 (57.5%) |
| 4 or 5 Rooms | 274 (21.0%) | 141 (28.1%) |
| 6 or 7 Rooms | 582 (44.7%) | 72 (14.4%) |
| 8 or more Rooms | 446 (34.3%) | 0 (0.0%) |
| Total | 1,302 (100.0%) | 501 (100.0%) |
Housing Structure by Heating Type in Ulysses
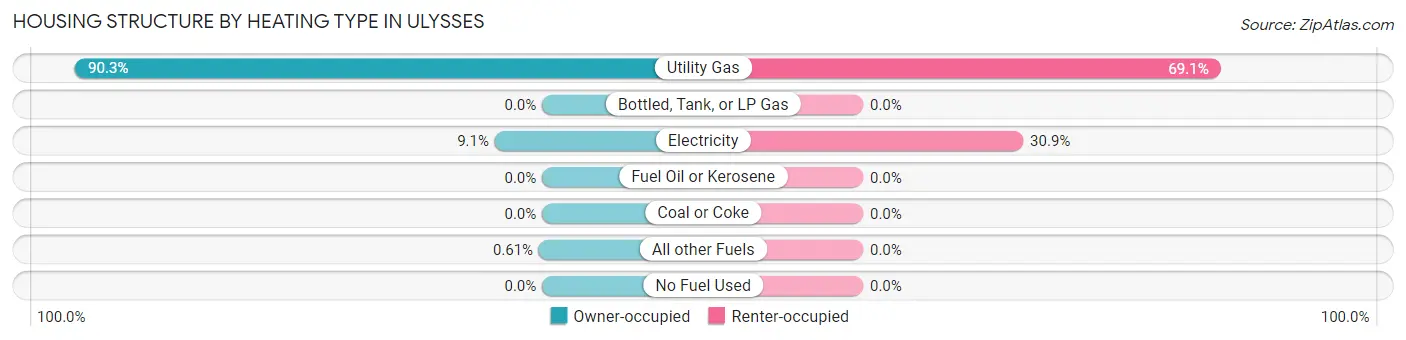
| Heating Type | Owner-occupied | Renter-occupied |
| Utility Gas | 1,175 (90.2%) | 346 (69.1%) |
| Bottled, Tank, or LP Gas | 0 (0.0%) | 0 (0.0%) |
| Electricity | 119 (9.1%) | 155 (30.9%) |
| Fuel Oil or Kerosene | 0 (0.0%) | 0 (0.0%) |
| Coal or Coke | 0 (0.0%) | 0 (0.0%) |
| All other Fuels | 8 (0.6%) | 0 (0.0%) |
| No Fuel Used | 0 (0.0%) | 0 (0.0%) |
| Total | 1,302 (100.0%) | 501 (100.0%) |
Household Vehicle Usage in Ulysses
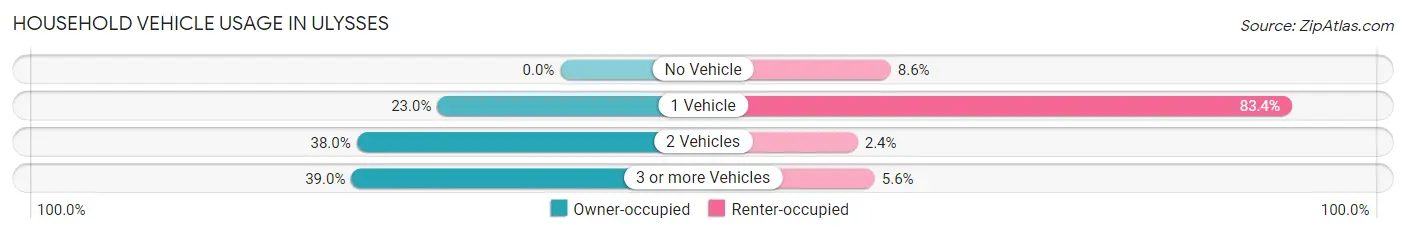
| Vehicles per Household | Owner-occupied | Renter-occupied |
| No Vehicle | 0 (0.0%) | 43 (8.6%) |
| 1 Vehicle | 299 (23.0%) | 418 (83.4%) |
| 2 Vehicles | 495 (38.0%) | 12 (2.4%) |
| 3 or more Vehicles | 508 (39.0%) | 28 (5.6%) |
| Total | 1,302 (100.0%) | 501 (100.0%) |
Real Estate & Mortgages in Ulysses
Real Estate and Mortgage Overview in Ulysses
| Characteristic | Without Mortgage | With Mortgage |
| Housing Units | 554 | 748 |
| Median Property Value | $110,500 | $129,100 |
| Median Household Income | $60,984 | $273 |
| Monthly Housing Costs | $571 | $0 |
| Real Estate Taxes | $1,983 | $0 |
Property Value by Mortgage Status in Ulysses
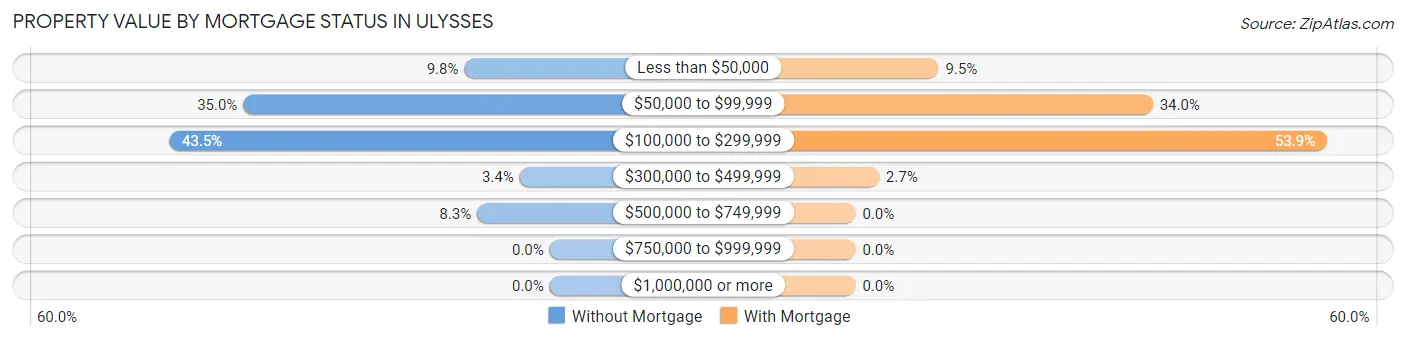
| Property Value | Without Mortgage | With Mortgage |
| Less than $50,000 | 54 (9.8%) | 71 (9.5%) |
| $50,000 to $99,999 | 194 (35.0%) | 254 (34.0%) |
| $100,000 to $299,999 | 241 (43.5%) | 403 (53.9%) |
| $300,000 to $499,999 | 19 (3.4%) | 20 (2.7%) |
| $500,000 to $749,999 | 46 (8.3%) | 0 (0.0%) |
| $750,000 to $999,999 | 0 (0.0%) | 0 (0.0%) |
| $1,000,000 or more | 0 (0.0%) | 0 (0.0%) |
| Total | 554 (100.0%) | 748 (100.0%) |
Household Income by Mortgage Status in Ulysses
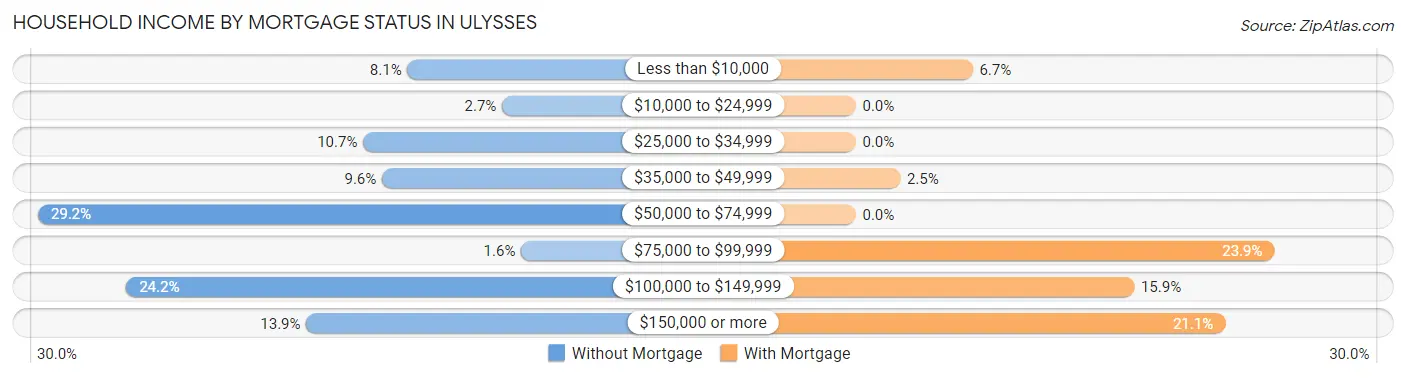
| Household Income | Without Mortgage | With Mortgage |
| Less than $10,000 | 45 (8.1%) | 50 (6.7%) |
| $10,000 to $24,999 | 15 (2.7%) | 0 (0.0%) |
| $25,000 to $34,999 | 59 (10.6%) | 0 (0.0%) |
| $35,000 to $49,999 | 53 (9.6%) | 19 (2.5%) |
| $50,000 to $74,999 | 162 (29.2%) | 0 (0.0%) |
| $75,000 to $99,999 | 9 (1.6%) | 179 (23.9%) |
| $100,000 to $149,999 | 134 (24.2%) | 119 (15.9%) |
| $150,000 or more | 77 (13.9%) | 158 (21.1%) |
| Total | 554 (100.0%) | 748 (100.0%) |
Property Value to Household Income Ratio in Ulysses
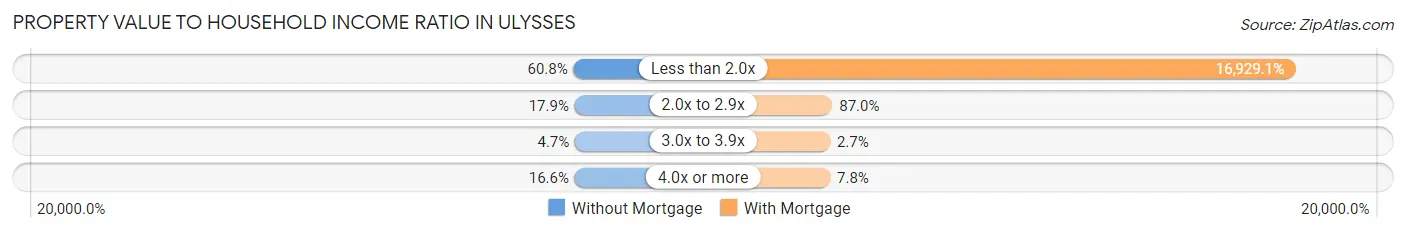
| Value-to-Income Ratio | Without Mortgage | With Mortgage |
| Less than 2.0x | 337 (60.8%) | 126,630 (16,929.1%) |
| 2.0x to 2.9x | 99 (17.9%) | 651 (87.0%) |
| 3.0x to 3.9x | 26 (4.7%) | 20 (2.7%) |
| 4.0x or more | 92 (16.6%) | 58 (7.7%) |
| Total | 554 (100.0%) | 748 (100.0%) |
Real Estate Taxes by Mortgage Status in Ulysses
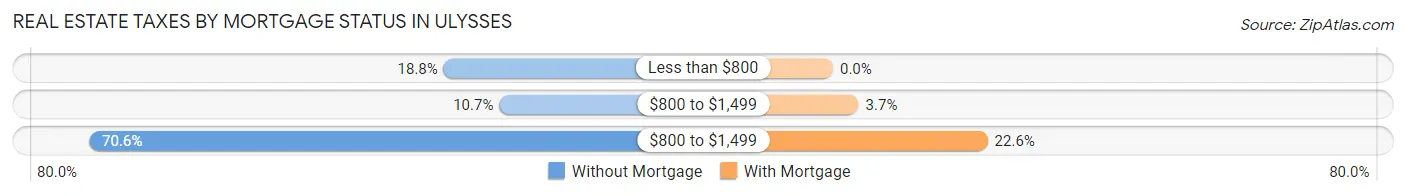
| Property Taxes | Without Mortgage | With Mortgage |
| Less than $800 | 104 (18.8%) | 0 (0.0%) |
| $800 to $1,499 | 59 (10.6%) | 28 (3.7%) |
| $800 to $1,499 | 391 (70.6%) | 169 (22.6%) |
| Total | 554 (100.0%) | 748 (100.0%) |
Health & Disability in Ulysses
Health Insurance Coverage by Age in Ulysses
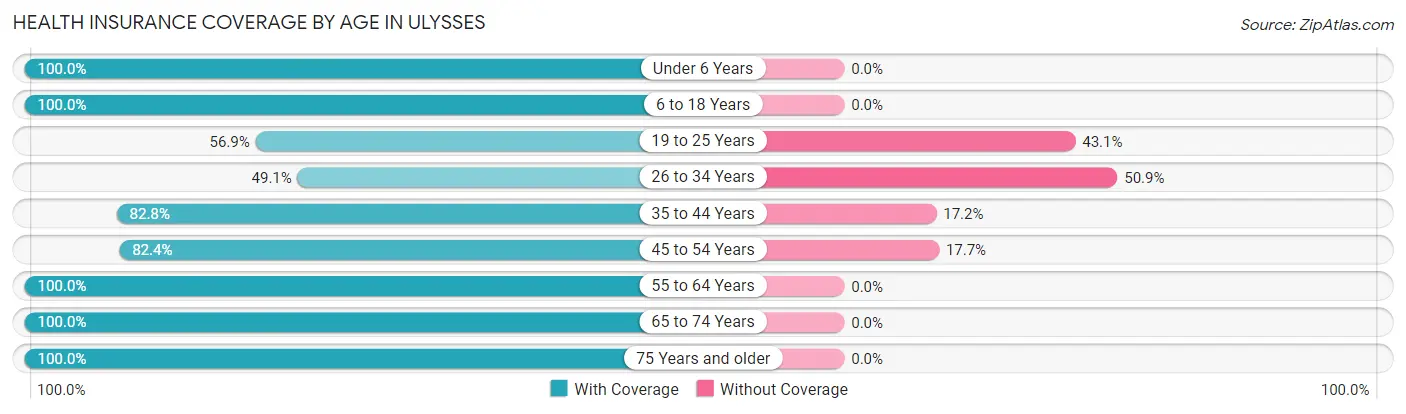
| Age Bracket | With Coverage | Without Coverage |
| Under 6 Years | 539 (100.0%) | 0 (0.0%) |
| 6 to 18 Years | 1,491 (100.0%) | 0 (0.0%) |
| 19 to 25 Years | 193 (56.9%) | 146 (43.1%) |
| 26 to 34 Years | 431 (49.1%) | 447 (50.9%) |
| 35 to 44 Years | 420 (82.8%) | 87 (17.2%) |
| 45 to 54 Years | 546 (82.4%) | 117 (17.6%) |
| 55 to 64 Years | 584 (100.0%) | 0 (0.0%) |
| 65 to 74 Years | 566 (100.0%) | 0 (0.0%) |
| 75 Years and older | 144 (100.0%) | 0 (0.0%) |
| Total | 4,914 (86.0%) | 797 (14.0%) |
Health Insurance Coverage by Citizenship Status in Ulysses
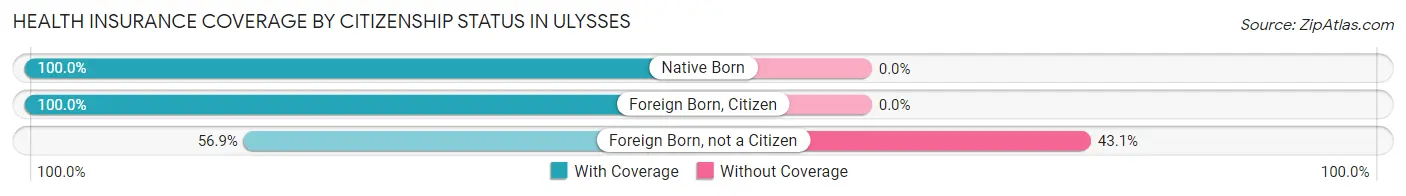
| Citizenship Status | With Coverage | Without Coverage |
| Native Born | 539 (100.0%) | 0 (0.0%) |
| Foreign Born, Citizen | 1,491 (100.0%) | 0 (0.0%) |
| Foreign Born, not a Citizen | 193 (56.9%) | 146 (43.1%) |
Health Insurance Coverage by Household Income in Ulysses
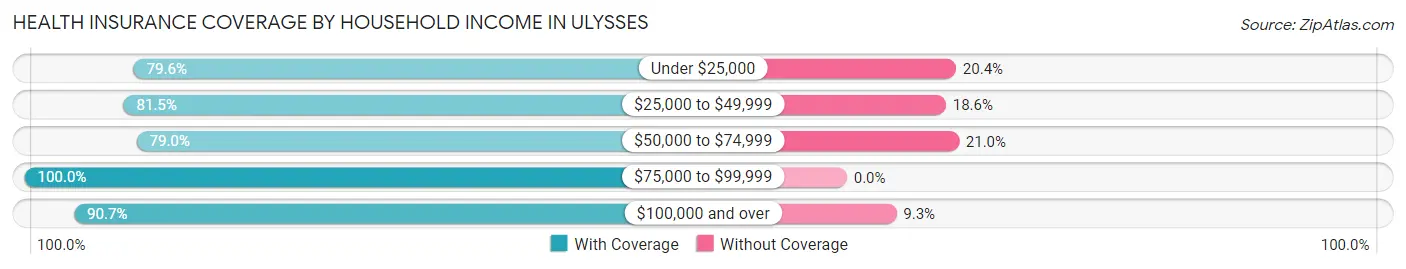
| Household Income | With Coverage | Without Coverage |
| Under $25,000 | 362 (79.6%) | 93 (20.4%) |
| $25,000 to $49,999 | 584 (81.5%) | 133 (18.5%) |
| $50,000 to $74,999 | 1,476 (79.0%) | 392 (21.0%) |
| $75,000 to $99,999 | 745 (100.0%) | 0 (0.0%) |
| $100,000 and over | 1,747 (90.7%) | 179 (9.3%) |
Public vs Private Health Insurance Coverage by Age in Ulysses
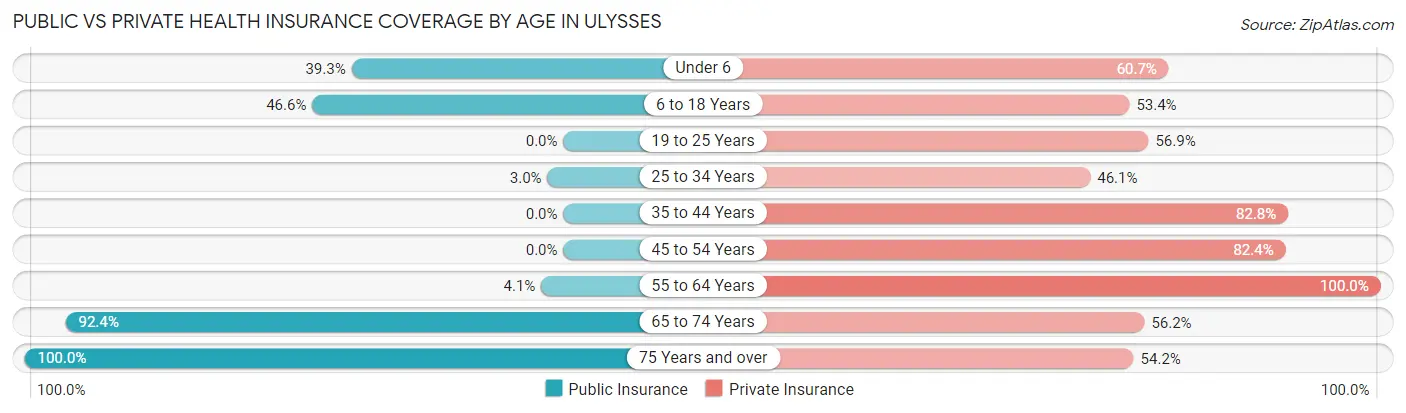
| Age Bracket | Public Insurance | Private Insurance |
| Under 6 | 212 (39.3%) | 327 (60.7%) |
| 6 to 18 Years | 695 (46.6%) | 796 (53.4%) |
| 19 to 25 Years | 0 (0.0%) | 193 (56.9%) |
| 25 to 34 Years | 26 (3.0%) | 405 (46.1%) |
| 35 to 44 Years | 0 (0.0%) | 420 (82.8%) |
| 45 to 54 Years | 0 (0.0%) | 546 (82.4%) |
| 55 to 64 Years | 24 (4.1%) | 584 (100.0%) |
| 65 to 74 Years | 523 (92.4%) | 318 (56.2%) |
| 75 Years and over | 144 (100.0%) | 78 (54.2%) |
| Total | 1,624 (28.4%) | 3,667 (64.2%) |
Disability Status by Sex by Age in Ulysses
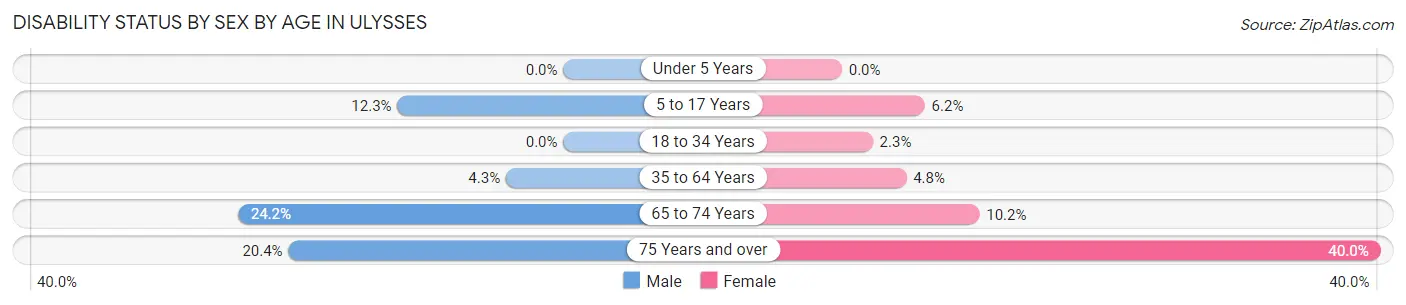
| Age Bracket | Male | Female |
| Under 5 Years | 0 (0.0%) | 0 (0.0%) |
| 5 to 17 Years | 111 (12.3%) | 37 (6.1%) |
| 18 to 34 Years | 0 (0.0%) | 14 (2.3%) |
| 35 to 64 Years | 40 (4.3%) | 39 (4.8%) |
| 65 to 74 Years | 80 (24.2%) | 24 (10.2%) |
| 75 Years and over | 10 (20.4%) | 38 (40.0%) |
Disability Class by Sex by Age in Ulysses
Disability Class: Hearing Difficulty
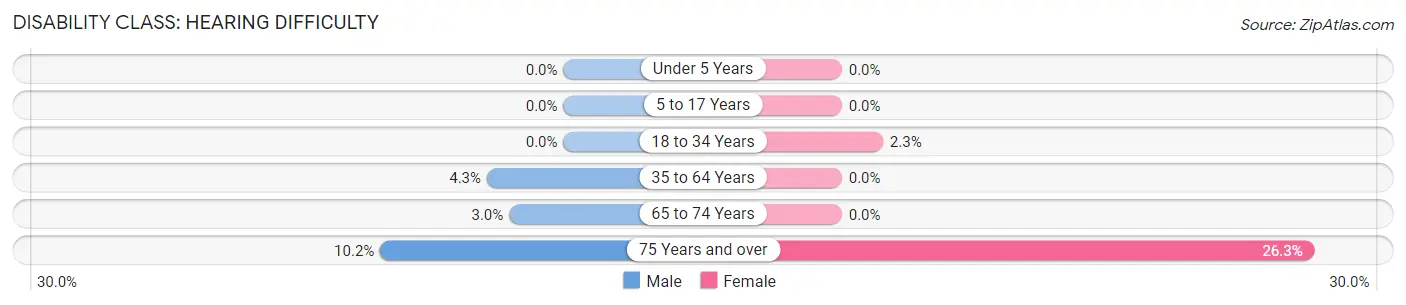
| Age Bracket | Male | Female |
| Under 5 Years | 0 (0.0%) | 0 (0.0%) |
| 5 to 17 Years | 0 (0.0%) | 0 (0.0%) |
| 18 to 34 Years | 0 (0.0%) | 14 (2.3%) |
| 35 to 64 Years | 40 (4.3%) | 0 (0.0%) |
| 65 to 74 Years | 10 (3.0%) | 0 (0.0%) |
| 75 Years and over | 5 (10.2%) | 25 (26.3%) |
Disability Class: Vision Difficulty
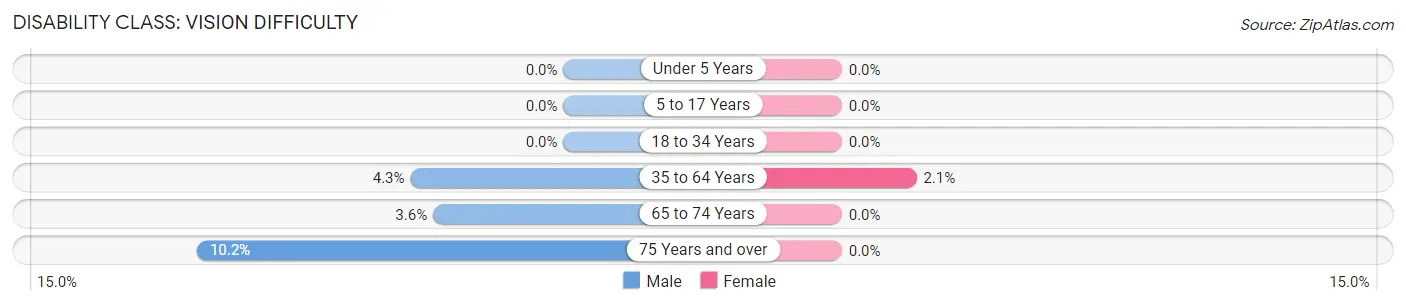
| Age Bracket | Male | Female |
| Under 5 Years | 0 (0.0%) | 0 (0.0%) |
| 5 to 17 Years | 0 (0.0%) | 0 (0.0%) |
| 18 to 34 Years | 0 (0.0%) | 0 (0.0%) |
| 35 to 64 Years | 40 (4.3%) | 17 (2.1%) |
| 65 to 74 Years | 12 (3.6%) | 0 (0.0%) |
| 75 Years and over | 5 (10.2%) | 0 (0.0%) |
Disability Class: Cognitive Difficulty
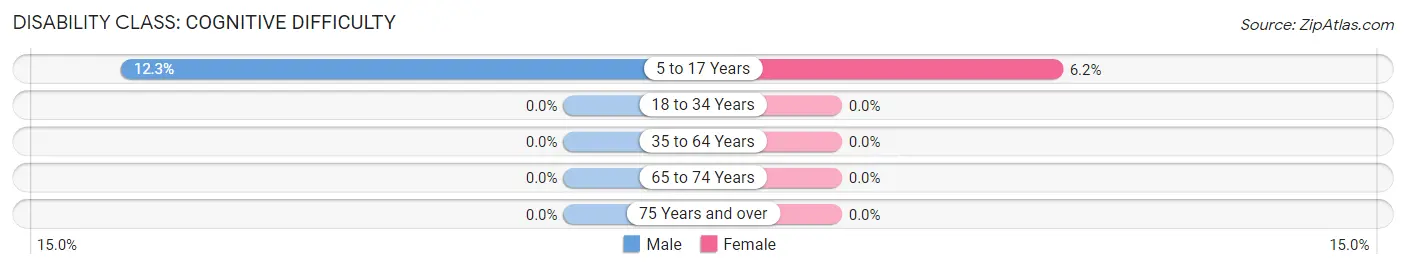
| Age Bracket | Male | Female |
| 5 to 17 Years | 111 (12.3%) | 37 (6.1%) |
| 18 to 34 Years | 0 (0.0%) | 0 (0.0%) |
| 35 to 64 Years | 0 (0.0%) | 0 (0.0%) |
| 65 to 74 Years | 0 (0.0%) | 0 (0.0%) |
| 75 Years and over | 0 (0.0%) | 0 (0.0%) |
Disability Class: Ambulatory Difficulty
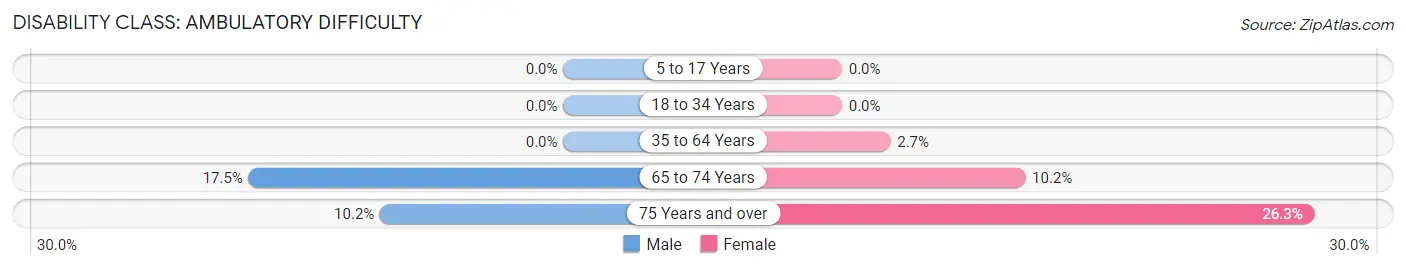
| Age Bracket | Male | Female |
| 5 to 17 Years | 0 (0.0%) | 0 (0.0%) |
| 18 to 34 Years | 0 (0.0%) | 0 (0.0%) |
| 35 to 64 Years | 0 (0.0%) | 22 (2.7%) |
| 65 to 74 Years | 58 (17.5%) | 24 (10.2%) |
| 75 Years and over | 5 (10.2%) | 25 (26.3%) |
Disability Class: Self-Care Difficulty
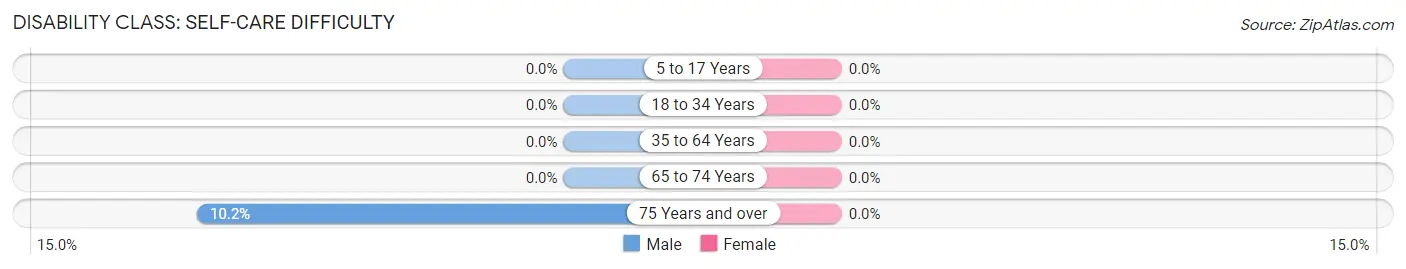
| Age Bracket | Male | Female |
| 5 to 17 Years | 0 (0.0%) | 0 (0.0%) |
| 18 to 34 Years | 0 (0.0%) | 0 (0.0%) |
| 35 to 64 Years | 0 (0.0%) | 0 (0.0%) |
| 65 to 74 Years | 0 (0.0%) | 0 (0.0%) |
| 75 Years and over | 5 (10.2%) | 0 (0.0%) |
Technology Access in Ulysses
Computing Device Access in Ulysses
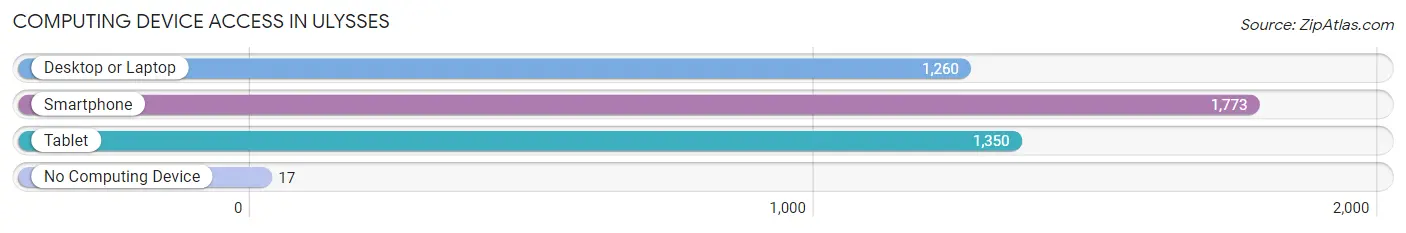
| Device Type | # Households | % Households |
| Desktop or Laptop | 1,260 | 69.9% |
| Smartphone | 1,773 | 98.3% |
| Tablet | 1,350 | 74.9% |
| No Computing Device | 17 | 0.9% |
| Total | 1,803 | 100.0% |
Internet Access in Ulysses
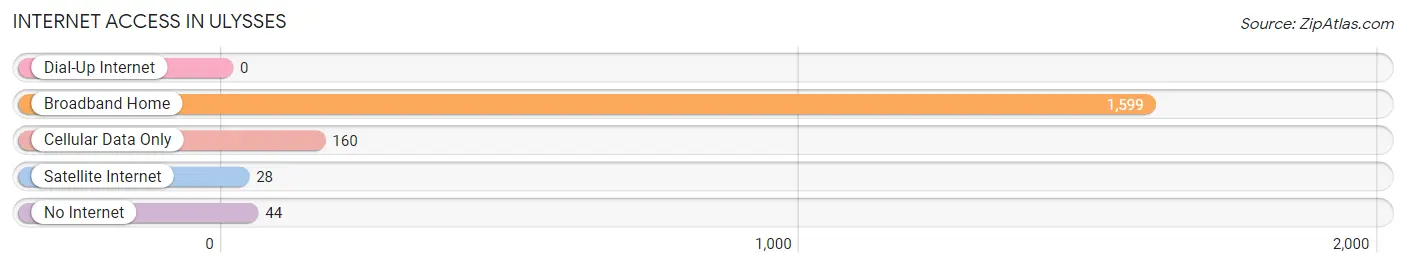
| Internet Type | # Households | % Households |
| Dial-Up Internet | 0 | 0.0% |
| Broadband Home | 1,599 | 88.7% |
| Cellular Data Only | 160 | 8.9% |
| Satellite Internet | 28 | 1.5% |
| No Internet | 44 | 2.4% |
| Total | 1,803 | 100.0% |
Ulysses Summary
Ulysses, Kansas is a small city located in Grant County in the southwestern part of the state. It is the county seat and the largest city in the county. The city was founded in 1885 and named after Ulysses S. Grant, the 18th President of the United States. The city has a population of 5,902 as of the 2020 census.
Geography
Ulysses is located in the High Plains region of the Great Plains, at an elevation of 2,845 feet (867 m). The city is situated on the Arkansas River, which flows through the city from east to west. The city is surrounded by agricultural land, with wheat, corn, and sorghum being the main crops. The city is located in the Central Time Zone and has a semi-arid climate, with hot summers and cold winters.
Economy
Ulysses is the economic center of Grant County, and the city's economy is largely based on agriculture. The city is home to several large grain elevators, and the local economy is also supported by the production of beef, pork, and dairy products. The city is also home to several manufacturing companies, including a plastics plant, a metal fabrication plant, and a food processing plant.
Demographics
As of the 2020 census, Ulysses had a population of 5,902. The racial makeup of the city was 87.3% White, 0.7% African American, 0.3% Native American, 0.2% Asian, 0.1% Pacific Islander, 9.7% from other races, and 1.9% from two or more races. Hispanic or Latino of any race were 18.2% of the population.
The median income for a household in Ulysses was $37,917, and the median income for a family was $45,917. The per capita income for the city was $19,917. About 14.2% of families and 17.2% of the population were below the poverty line, including 22.2% of those under age 18 and 11.2% of those age 65 or over.
Education
Ulysses is served by the Ulysses Unified School District, which includes Ulysses High School, Ulysses Middle School, and Ulysses Elementary School. The city is also home to a branch of Seward County Community College.
Conclusion
Ulysses, Kansas is a small city located in Grant County in the southwestern part of the state. It is the county seat and the largest city in the county. The city was founded in 1885 and named after Ulysses S. Grant, the 18th President of the United States. The city has a population of 5,902 as of the 2020 census. Ulysses is located in the High Plains region of the Great Plains, at an elevation of 2,845 feet (867 m). The city is situated on the Arkansas River, which flows through the city from east to west. The city is surrounded by agricultural land, with wheat, corn, and sorghum being the main crops. The city is located in the Central Time Zone and has a semi-arid climate, with hot summers and cold winters. Ulysses is the economic center of Grant County, and the city's economy is largely based on agriculture. The city is home to several large grain elevators, and the local economy is also supported by the production of beef, pork, and dairy products. The city is also home to several manufacturing companies, including a plastics plant, a metal fabrication plant, and a food processing plant. As of the 2020 census, Ulysses had a population of 5,902. The racial makeup of the city was 87.3% White, 0.7% African American, 0.3% Native American, 0.2% Asian, 0.1% Pacific Islander, 9.7% from other races, and 1.9% from two or more races. Hispanic or Latino of any race were 18.2% of the population. Ulysses is served by the Ulysses Unified School District, which includes Ulysses High School, Ulysses Middle School, and Ulysses Elementary School. The city is also home to a branch of Seward County Community College.
Common Questions
What is Per Capita Income in Ulysses?
Per Capita income in Ulysses is $33,602.
What is the Median Family Income in Ulysses?
Median Family Income in Ulysses is $66,746.
What is the Median Household income in Ulysses?
Median Household Income in Ulysses is $62,138.
What is Income or Wage Gap in Ulysses?
Income or Wage Gap in Ulysses is 50.6%.
Women in Ulysses earn 49.4 cents for every dollar earned by a man.
What is Inequality or Gini Index in Ulysses?
Inequality or Gini Index in Ulysses is 0.41.
What is the Total Population of Ulysses?
Total Population of Ulysses is 5,834.
What is the Total Male Population of Ulysses?
Total Male Population of Ulysses is 3,323.
What is the Total Female Population of Ulysses?
Total Female Population of Ulysses is 2,511.
What is the Ratio of Males per 100 Females in Ulysses?
There are 132.34 Males per 100 Females in Ulysses.
What is the Ratio of Females per 100 Males in Ulysses?
There are 75.56 Females per 100 Males in Ulysses.
What is the Median Population Age in Ulysses?
Median Population Age in Ulysses is 32.3 Years.
What is the Average Family Size in Ulysses
Average Family Size in Ulysses is 3.8 People.
What is the Average Household Size in Ulysses
Average Household Size in Ulysses is 3.2 People.
How Large is the Labor Force in Ulysses?
There are 2,948 People in the Labor Forcein in Ulysses.
What is the Percentage of People in the Labor Force in Ulysses?
71.7% of People are in the Labor Force in Ulysses.
What is the Unemployment Rate in Ulysses?
Unemployment Rate in Ulysses is 4.5%.