Eudora, KS Map & Demographics
Eudora Map
Eudora Overview
$39,894
PER CAPITA INCOME
$115,882
AVG FAMILY INCOME
$111,840
AVG HOUSEHOLD INCOME
32.0%
WAGE / INCOME GAP [ % ]
68.0¢/ $1
WAGE / INCOME GAP [ $ ]
0.34
INEQUALITY / GINI INDEX
6,025
TOTAL POPULATION
3,248
MALE POPULATION
2,777
FEMALE POPULATION
116.96
MALES / 100 FEMALES
85.50
FEMALES / 100 MALES
37.6
MEDIAN AGE
3.1
AVG FAMILY SIZE
2.8
AVG HOUSEHOLD SIZE
3,573
LABOR FORCE [ PEOPLE ]
73.5%
PERCENT IN LABOR FORCE
2.3%
UNEMPLOYMENT RATE
Eudora Zip Codes
Eudora Area Codes
Income in Eudora
Income Overview in Eudora
Per Capita Income in Eudora is $39,894, while median incomes of families and households are $115,882 and $111,840 respectively.
| Characteristic | Number | Measure |
| Per Capita Income | 6,025 | $39,894 |
| Median Family Income | 1,666 | $115,882 |
| Mean Family Income | 1,666 | $118,891 |
| Median Household Income | 2,160 | $111,840 |
| Mean Household Income | 2,160 | $111,452 |
| Income Deficit | 1,666 | $0 |
| Wage / Income Gap (%) | 6,025 | 32.04% |
| Wage / Income Gap ($) | 6,025 | 67.96¢ per $1 |
| Gini / Inequality Index | 6,025 | 0.34 |
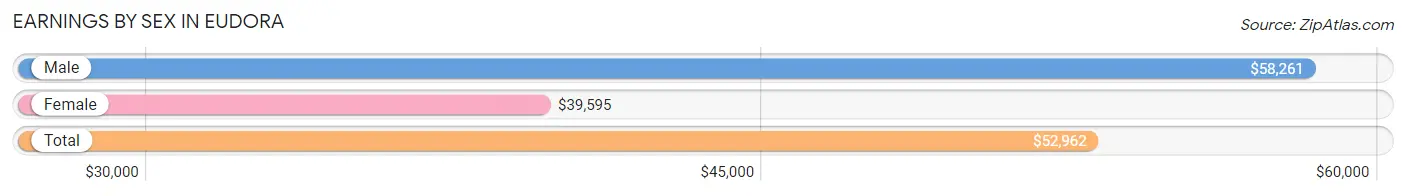
Earnings by Sex in Eudora
Average Earnings in Eudora are $52,962, $58,261 for men and $39,595 for women, a difference of 32.0%.
| Sex | Number | Average Earnings |
| Male | 1,950 (54.6%) | $58,261 |
| Female | 1,621 (45.4%) | $39,595 |
| Total | 3,571 (100.0%) | $52,962 |
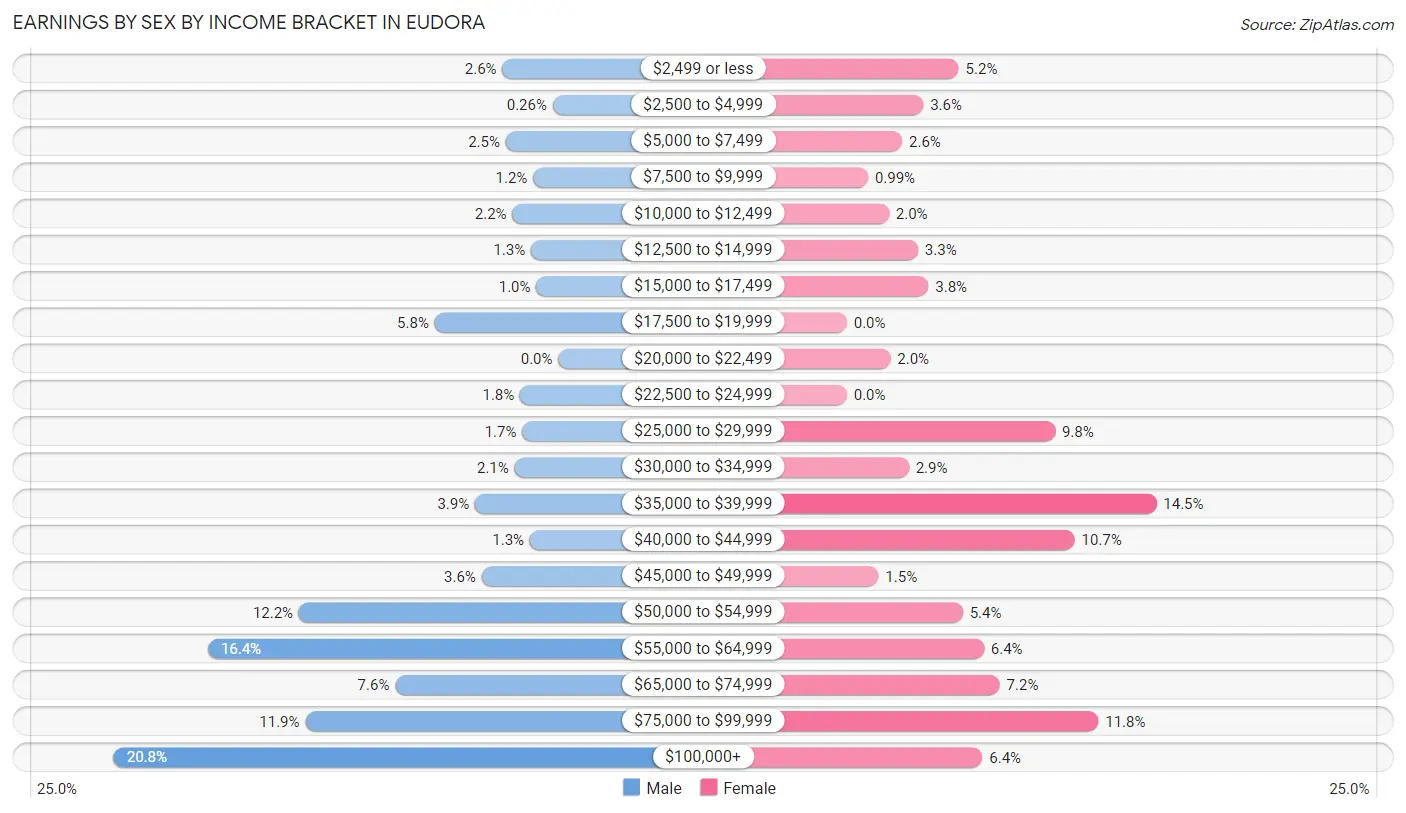
Earnings by Sex by Income Bracket in Eudora
The most common earnings brackets in Eudora are $100,000+ for men (406 | 20.8%) and $35,000 to $39,999 for women (235 | 14.5%).
| Income | Male | Female |
| $2,499 or less | 51 (2.6%) | 85 (5.2%) |
| $2,500 to $4,999 | 5 (0.3%) | 58 (3.6%) |
| $5,000 to $7,499 | 48 (2.5%) | 42 (2.6%) |
| $7,500 to $9,999 | 23 (1.2%) | 16 (1.0%) |
| $10,000 to $12,499 | 42 (2.1%) | 32 (2.0%) |
| $12,500 to $14,999 | 25 (1.3%) | 54 (3.3%) |
| $15,000 to $17,499 | 20 (1.0%) | 62 (3.8%) |
| $17,500 to $19,999 | 113 (5.8%) | 0 (0.0%) |
| $20,000 to $22,499 | 0 (0.0%) | 33 (2.0%) |
| $22,500 to $24,999 | 35 (1.8%) | 0 (0.0%) |
| $25,000 to $29,999 | 33 (1.7%) | 158 (9.8%) |
| $30,000 to $34,999 | 40 (2.1%) | 47 (2.9%) |
| $35,000 to $39,999 | 76 (3.9%) | 235 (14.5%) |
| $40,000 to $44,999 | 26 (1.3%) | 173 (10.7%) |
| $45,000 to $49,999 | 70 (3.6%) | 24 (1.5%) |
| $50,000 to $54,999 | 237 (12.1%) | 88 (5.4%) |
| $55,000 to $64,999 | 320 (16.4%) | 104 (6.4%) |
| $65,000 to $74,999 | 149 (7.6%) | 116 (7.2%) |
| $75,000 to $99,999 | 231 (11.8%) | 191 (11.8%) |
| $100,000+ | 406 (20.8%) | 103 (6.4%) |
| Total | 1,950 (100.0%) | 1,621 (100.0%) |
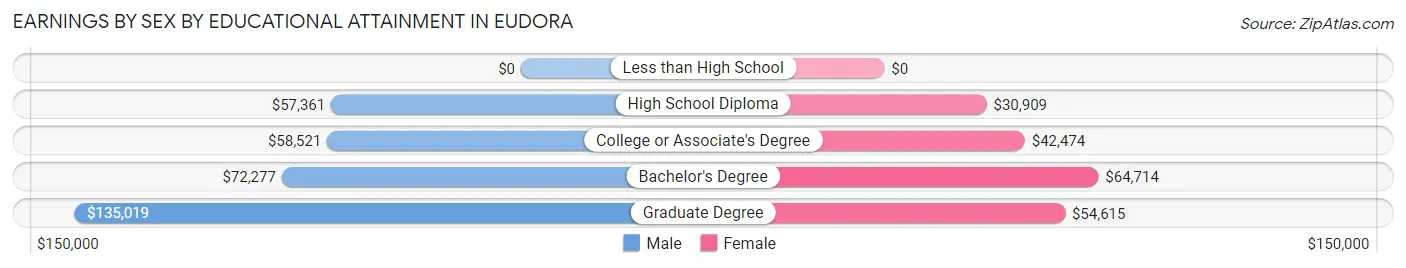
Earnings by Sex by Educational Attainment in Eudora
Average earnings in Eudora are $60,417 for men and $43,051 for women, a difference of 28.7%. Men with an educational attainment of graduate degree enjoy the highest average annual earnings of $135,019, while those with high school diploma education earn the least with $57,361. Women with an educational attainment of bachelor's degree earn the most with the average annual earnings of $64,714, while those with high school diploma education have the smallest earnings of $30,909.
| Educational Attainment | Male Income | Female Income |
| Less than High School | - | - |
| High School Diploma | $57,361 | $30,909 |
| College or Associate's Degree | $58,521 | $42,474 |
| Bachelor's Degree | $72,277 | $64,714 |
| Graduate Degree | $135,019 | $54,615 |
| Total | $60,417 | $43,051 |
Family Income in Eudora
Family Income Brackets in Eudora
According to the Eudora family income data, there are 506 families falling into the $100,000 to $149,999 income range, which is the most common income bracket and makes up 30.4% of all families. Conversely, the $25,000 to $34,999 income bracket is the least frequent group with only 22 families (1.3%) belonging to this category.
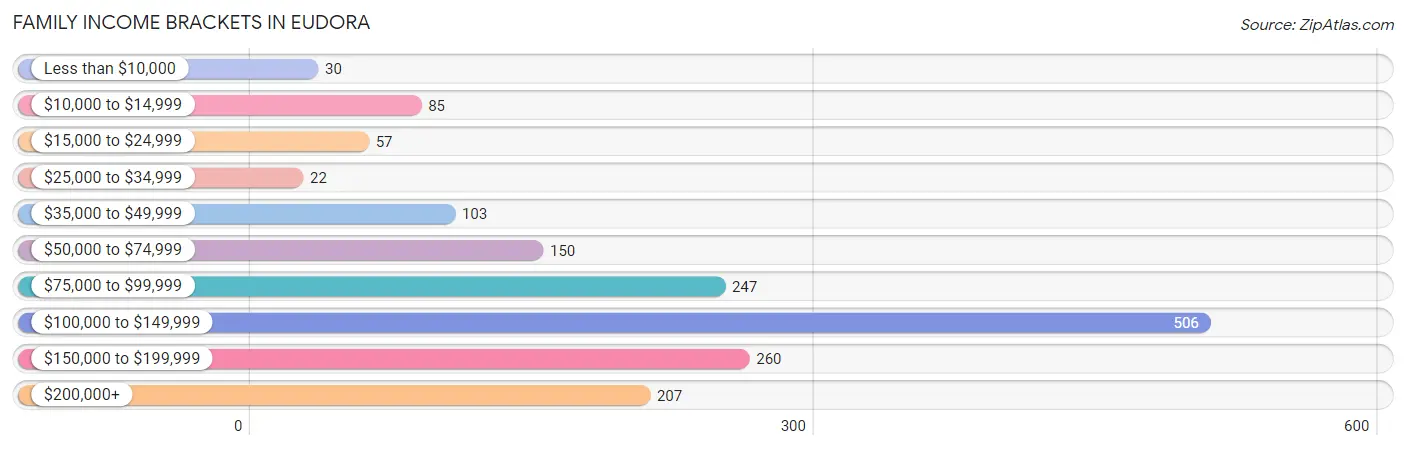
| Income Bracket | # Families | % Families |
| Less than $10,000 | 30 | 1.8% |
| $10,000 to $14,999 | 85 | 5.1% |
| $15,000 to $24,999 | 57 | 3.4% |
| $25,000 to $34,999 | 22 | 1.3% |
| $35,000 to $49,999 | 103 | 6.2% |
| $50,000 to $74,999 | 150 | 9.0% |
| $75,000 to $99,999 | 247 | 14.8% |
| $100,000 to $149,999 | 506 | 30.4% |
| $150,000 to $199,999 | 260 | 15.6% |
| $200,000+ | 207 | 12.4% |
Family Income by Famaliy Size in Eudora
5-person families (195 | 11.7%) account for the highest median family income in Eudora with $139,453 per family, while 2-person families (733 | 44.0%) have the highest median income of $45,236 per family member.
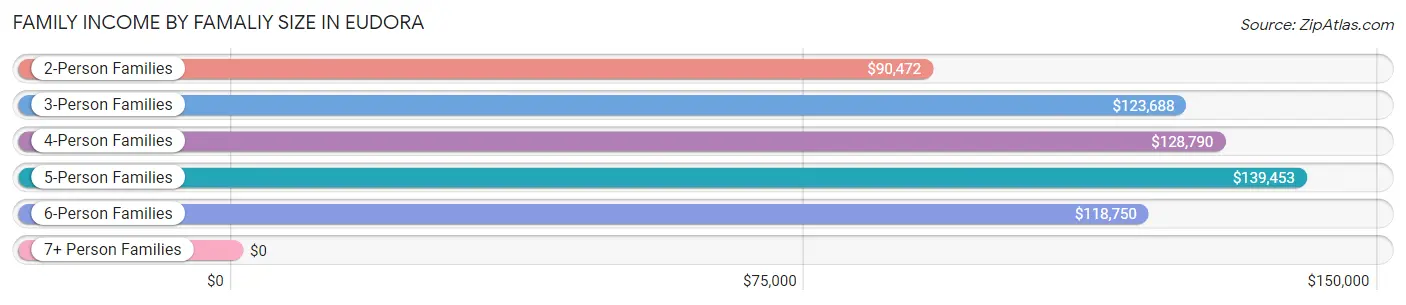
| Income Bracket | # Families | Median Income |
| 2-Person Families | 733 (44.0%) | $90,472 |
| 3-Person Families | 369 (22.2%) | $123,688 |
| 4-Person Families | 314 (18.9%) | $128,790 |
| 5-Person Families | 195 (11.7%) | $139,453 |
| 6-Person Families | 55 (3.3%) | $118,750 |
| 7+ Person Families | 0 (0.0%) | $0 |
| Total | 1,666 (100.0%) | $115,882 |
Family Income by Number of Earners in Eudora
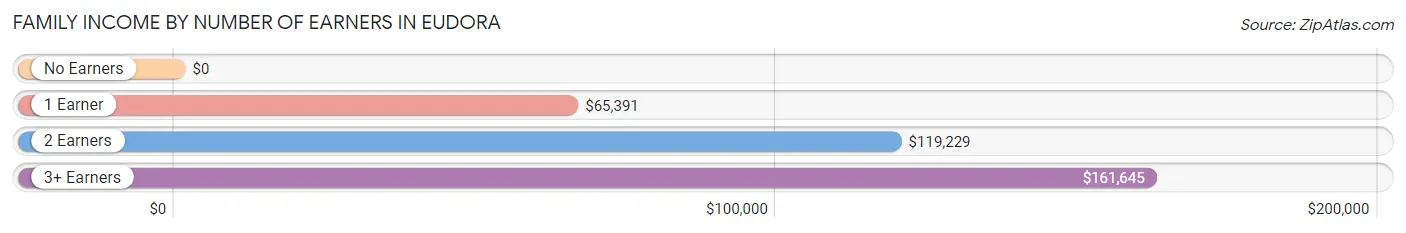
| Number of Earners | # Families | Median Income |
| No Earners | 221 (13.3%) | $0 |
| 1 Earner | 285 (17.1%) | $65,391 |
| 2 Earners | 825 (49.5%) | $119,229 |
| 3+ Earners | 335 (20.1%) | $161,645 |
| Total | 1,666 (100.0%) | $115,882 |
Household Income in Eudora
Household Income Brackets in Eudora
With 700 households falling in the category, the $100,000 to $149,999 income range is the most frequent in Eudora, accounting for 32.4% of all households. In contrast, only 45 households (2.1%) fall into the less than $10,000 income bracket, making it the least populous group.
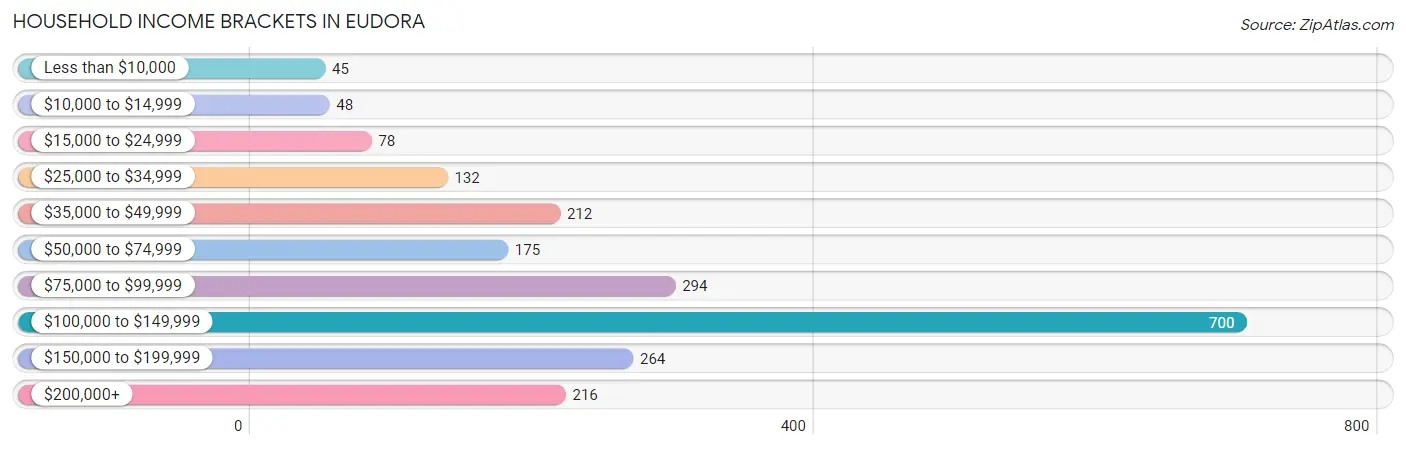
| Income Bracket | # Households | % Households |
| Less than $10,000 | 45 | 2.1% |
| $10,000 to $14,999 | 48 | 2.2% |
| $15,000 to $24,999 | 78 | 3.6% |
| $25,000 to $34,999 | 132 | 6.1% |
| $35,000 to $49,999 | 212 | 9.8% |
| $50,000 to $74,999 | 175 | 8.1% |
| $75,000 to $99,999 | 294 | 13.6% |
| $100,000 to $149,999 | 700 | 32.4% |
| $150,000 to $199,999 | 264 | 12.2% |
| $200,000+ | 216 | 10.0% |
Household Income by Householder Age in Eudora
The median household income in Eudora is $111,840, with the highest median household income of $127,846 found in the 25 to 44 years age bracket for the primary householder. A total of 1,019 households (47.2%) fall into this category. Meanwhile, the 15 to 24 years age bracket for the primary householder has the lowest median household income of $0, with 81 households (3.7%) in this group.
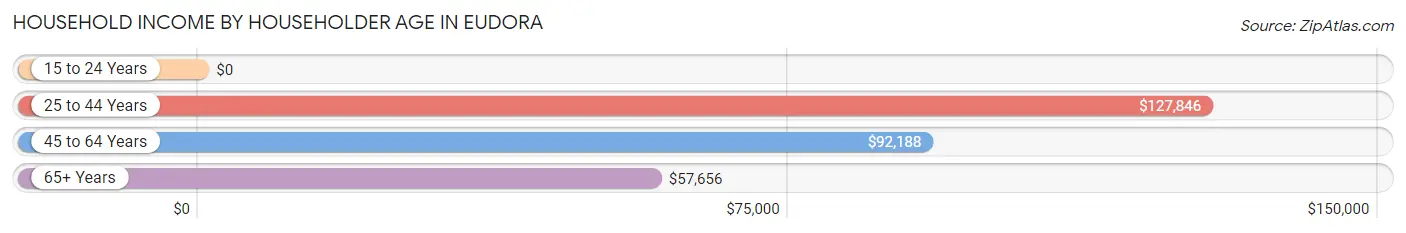
| Income Bracket | # Households | Median Income |
| 15 to 24 Years | 81 (3.7%) | $0 |
| 25 to 44 Years | 1,019 (47.2%) | $127,846 |
| 45 to 64 Years | 764 (35.4%) | $92,188 |
| 65+ Years | 296 (13.7%) | $57,656 |
| Total | 2,160 (100.0%) | $111,840 |
Poverty in Eudora
Income Below Poverty by Sex and Age in Eudora
With 7.0% poverty level for males and 8.2% for females among the residents of Eudora, under 5 year old males and 55 to 64 year old females are the most vulnerable to poverty, with 50 males (27.9%) and 126 females (20.1%) in their respective age groups living below the poverty level.
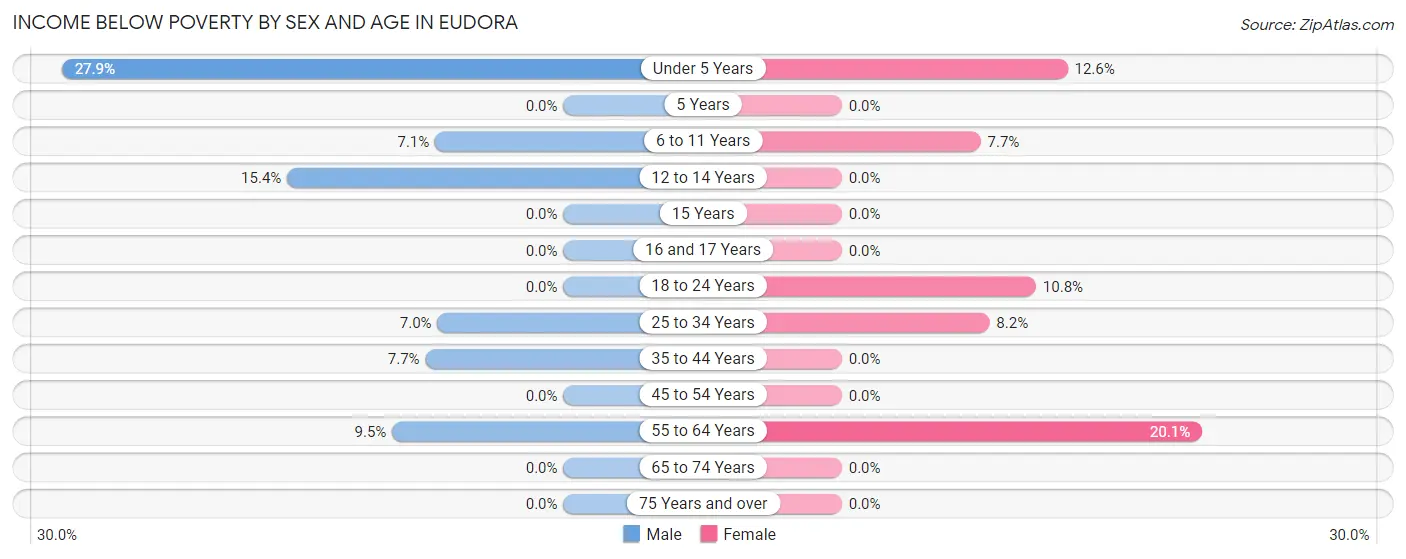
| Age Bracket | Male | Female |
| Under 5 Years | 50 (27.9%) | 23 (12.6%) |
| 5 Years | 0 (0.0%) | 0 (0.0%) |
| 6 to 11 Years | 23 (7.1%) | 14 (7.7%) |
| 12 to 14 Years | 22 (15.4%) | 0 (0.0%) |
| 15 Years | 0 (0.0%) | 0 (0.0%) |
| 16 and 17 Years | 0 (0.0%) | 0 (0.0%) |
| 18 to 24 Years | 0 (0.0%) | 24 (10.8%) |
| 25 to 34 Years | 31 (7.0%) | 37 (8.2%) |
| 35 to 44 Years | 46 (7.7%) | 0 (0.0%) |
| 45 to 54 Years | 0 (0.0%) | 0 (0.0%) |
| 55 to 64 Years | 53 (9.5%) | 126 (20.1%) |
| 65 to 74 Years | 0 (0.0%) | 0 (0.0%) |
| 75 Years and over | 0 (0.0%) | 0 (0.0%) |
| Total | 225 (7.0%) | 224 (8.2%) |
Income Above Poverty by Sex and Age in Eudora
According to the poverty statistics in Eudora, males aged 5 years and females aged 5 years are the age groups that are most secure financially, with 100.0% of males and 100.0% of females in these age groups living above the poverty line.
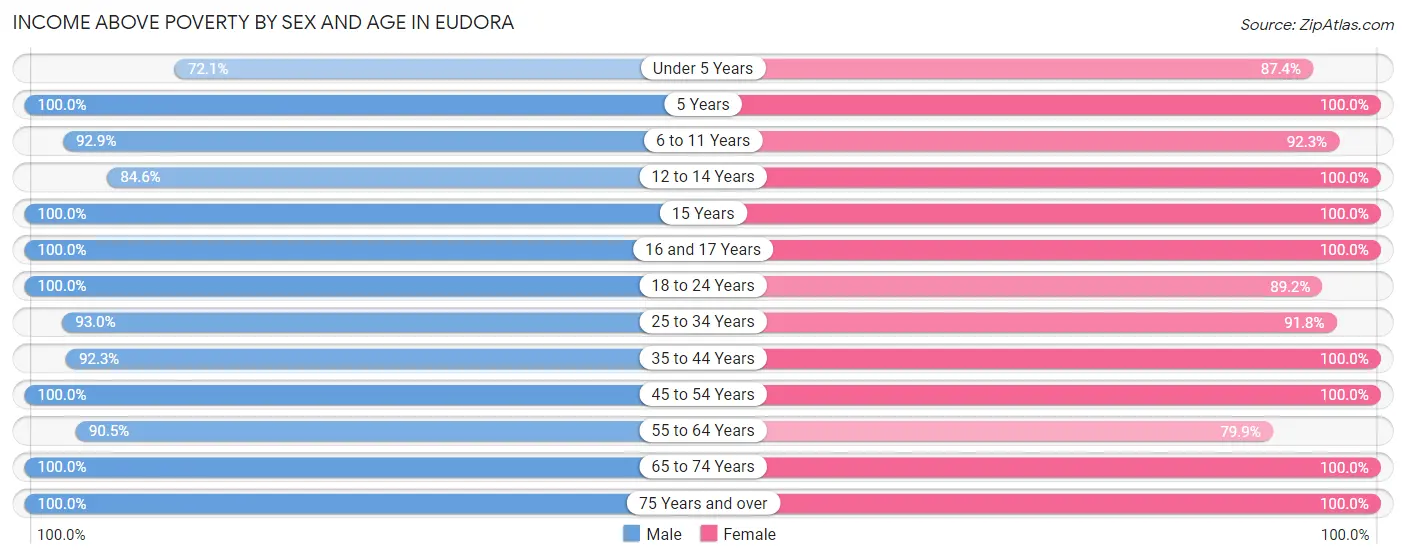
| Age Bracket | Male | Female |
| Under 5 Years | 129 (72.1%) | 160 (87.4%) |
| 5 Years | 46 (100.0%) | 47 (100.0%) |
| 6 to 11 Years | 299 (92.9%) | 167 (92.3%) |
| 12 to 14 Years | 121 (84.6%) | 18 (100.0%) |
| 15 Years | 3 (100.0%) | 42 (100.0%) |
| 16 and 17 Years | 170 (100.0%) | 139 (100.0%) |
| 18 to 24 Years | 177 (100.0%) | 198 (89.2%) |
| 25 to 34 Years | 411 (93.0%) | 413 (91.8%) |
| 35 to 44 Years | 553 (92.3%) | 363 (100.0%) |
| 45 to 54 Years | 299 (100.0%) | 266 (100.0%) |
| 55 to 64 Years | 503 (90.5%) | 502 (79.9%) |
| 65 to 74 Years | 247 (100.0%) | 90 (100.0%) |
| 75 Years and over | 42 (100.0%) | 107 (100.0%) |
| Total | 3,000 (93.0%) | 2,512 (91.8%) |
Income Below Poverty Among Married-Couple Families in Eudora
The poverty statistics for married-couple families in Eudora show that 3.8% or 53 of the total 1,382 families live below the poverty line. Families with no children have the highest poverty rate of 7.6%, comprising of 53 families. On the other hand, families with 1 or 2 children have the lowest poverty rate of 0.0%, which includes 0 families.
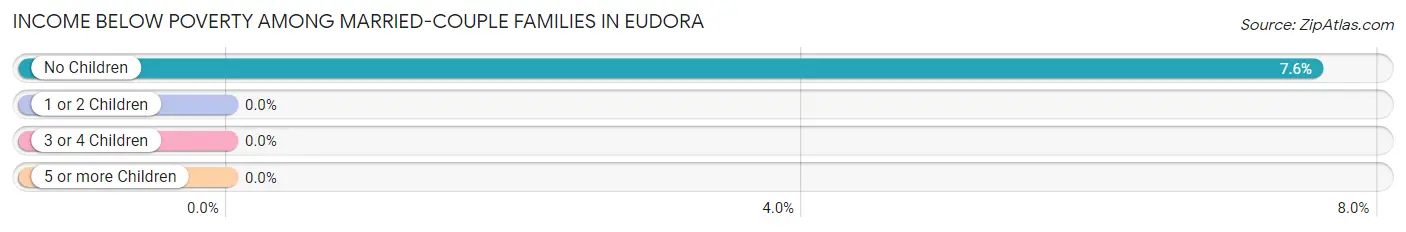
| Children | Above Poverty | Below Poverty |
| No Children | 648 (92.4%) | 53 (7.6%) |
| 1 or 2 Children | 522 (100.0%) | 0 (0.0%) |
| 3 or 4 Children | 159 (100.0%) | 0 (0.0%) |
| 5 or more Children | 0 (0.0%) | 0 (0.0%) |
| Total | 1,329 (96.2%) | 53 (3.8%) |
Income Below Poverty Among Single-Parent Households in Eudora
According to the poverty data in Eudora, 36.8% or 64 single-father households and 19.1% or 21 single-mother households are living below the poverty line. Among single-father households, those with 1 or 2 children have the highest poverty rate, with 46 households (59.0%) experiencing poverty. Likewise, among single-mother households, those with 3 or 4 children have the highest poverty rate, with 21 households (100.0%) falling below the poverty line.
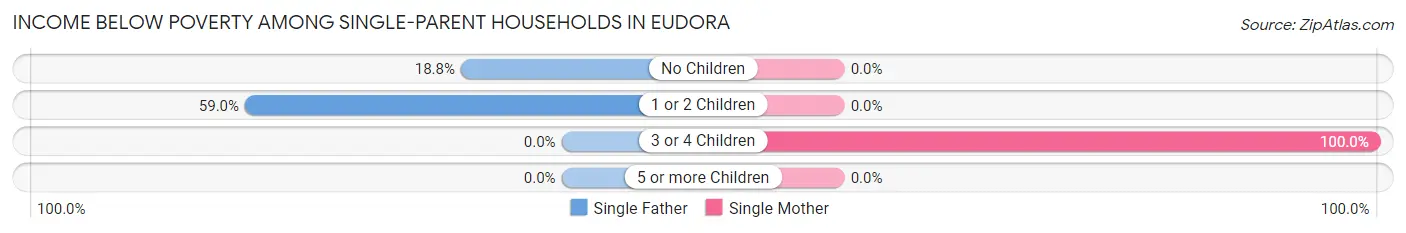
| Children | Single Father | Single Mother |
| No Children | 18 (18.8%) | 0 (0.0%) |
| 1 or 2 Children | 46 (59.0%) | 0 (0.0%) |
| 3 or 4 Children | 0 (0.0%) | 21 (100.0%) |
| 5 or more Children | 0 (0.0%) | 0 (0.0%) |
| Total | 64 (36.8%) | 21 (19.1%) |
Income Below Poverty Among Married-Couple vs Single-Parent Households in Eudora
The poverty data for Eudora shows that 53 of the married-couple family households (3.8%) and 85 of the single-parent households (29.9%) are living below the poverty level. Within the married-couple family households, those with no children have the highest poverty rate, with 53 households (7.6%) falling below the poverty line. Among the single-parent households, those with 3 or 4 children have the highest poverty rate, with 21 household (100.0%) living below poverty.
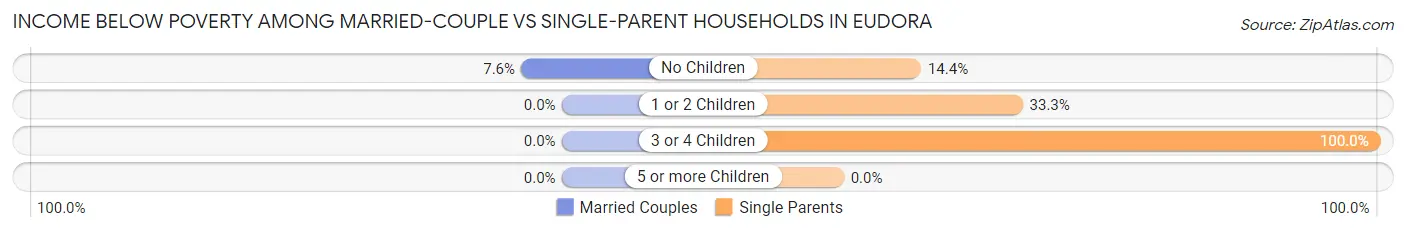
| Children | Married-Couple Families | Single-Parent Households |
| No Children | 53 (7.6%) | 18 (14.4%) |
| 1 or 2 Children | 0 (0.0%) | 46 (33.3%) |
| 3 or 4 Children | 0 (0.0%) | 21 (100.0%) |
| 5 or more Children | 0 (0.0%) | 0 (0.0%) |
| Total | 53 (3.8%) | 85 (29.9%) |
Race in Eudora
The most populous races in Eudora are White / Caucasian (5,525 | 91.7%), Two or more Races (464 | 7.7%), and Hispanic or Latino (433 | 7.2%).
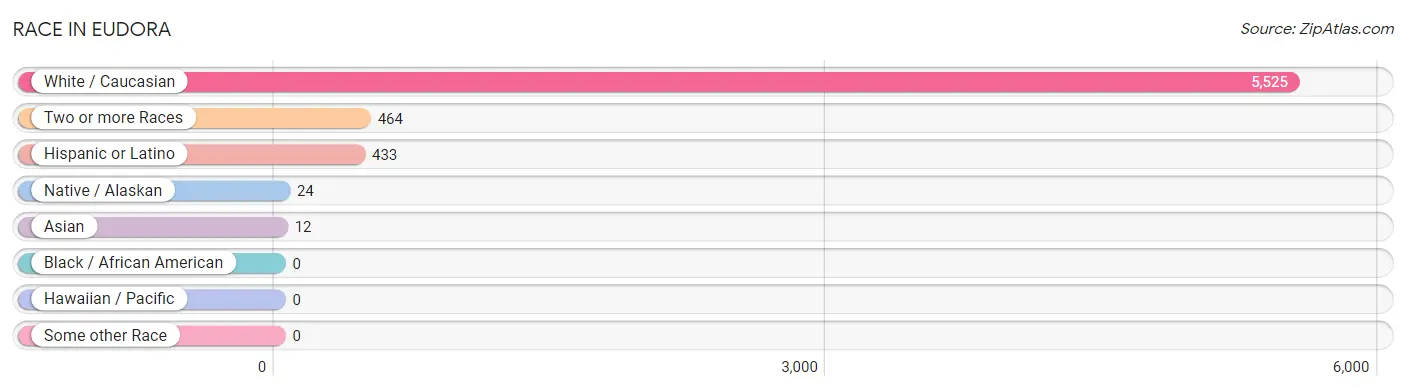
| Race | # Population | % Population |
| Asian | 12 | 0.2% |
| Black / African American | 0 | 0.0% |
| Hawaiian / Pacific | 0 | 0.0% |
| Hispanic or Latino | 433 | 7.2% |
| Native / Alaskan | 24 | 0.4% |
| White / Caucasian | 5,525 | 91.7% |
| Two or more Races | 464 | 7.7% |
| Some other Race | 0 | 0.0% |
| Total | 6,025 | 100.0% |
Ancestry in Eudora
The most populous ancestries reported in Eudora are German (1,795 | 29.8%), Irish (1,242 | 20.6%), English (879 | 14.6%), American (409 | 6.8%), and European (280 | 4.6%), together accounting for 76.4% of all Eudora residents.
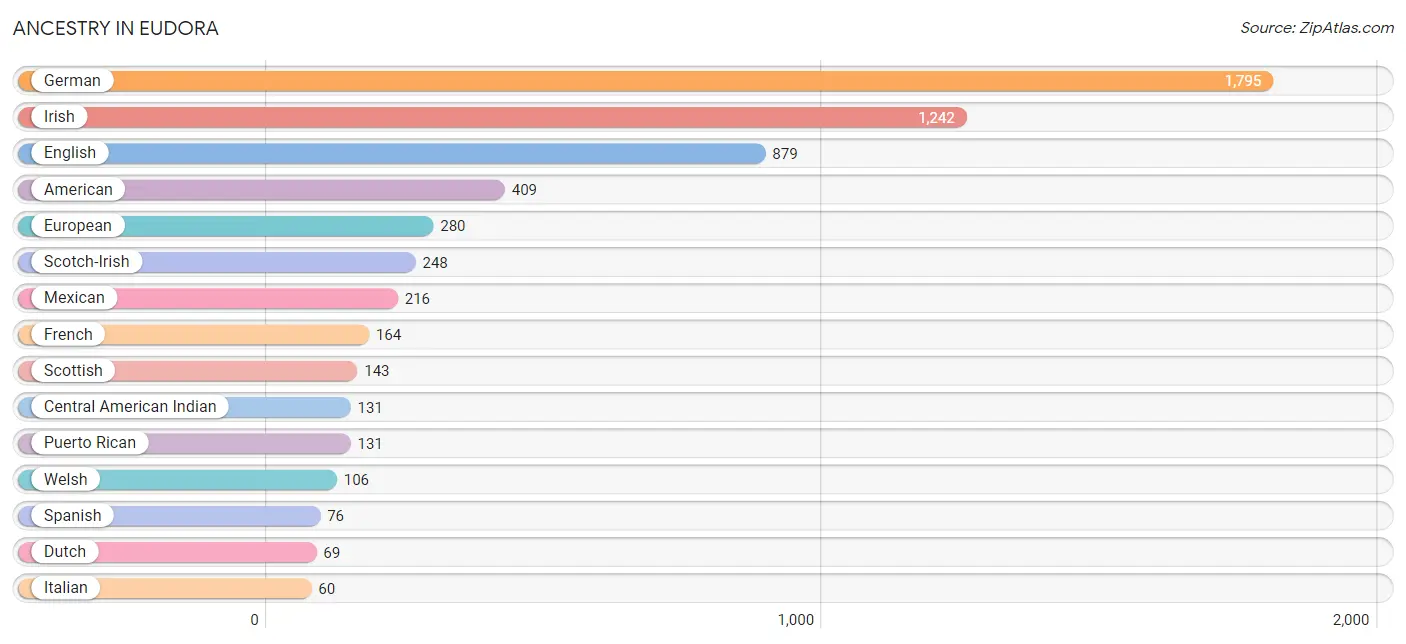
| Ancestry | # Population | % Population |
| African | 15 | 0.3% |
| American | 409 | 6.8% |
| Bulgarian | 45 | 0.7% |
| Burmese | 29 | 0.5% |
| Central American | 10 | 0.2% |
| Central American Indian | 131 | 2.2% |
| Cherokee | 10 | 0.2% |
| Chickasaw | 10 | 0.2% |
| Comanche | 18 | 0.3% |
| Danish | 6 | 0.1% |
| Dutch | 69 | 1.1% |
| English | 879 | 14.6% |
| European | 280 | 4.6% |
| French | 164 | 2.7% |
| German | 1,795 | 29.8% |
| Honduran | 10 | 0.2% |
| Indian (Asian) | 12 | 0.2% |
| Irish | 1,242 | 20.6% |
| Italian | 60 | 1.0% |
| Luxembourger | 60 | 1.0% |
| Mexican | 216 | 3.6% |
| Pennsylvania German | 18 | 0.3% |
| Puerto Rican | 131 | 2.2% |
| Scotch-Irish | 248 | 4.1% |
| Scottish | 143 | 2.4% |
| Spanish | 76 | 1.3% |
| Subsaharan African | 15 | 0.3% |
| Swedish | 45 | 0.7% |
| Welsh | 106 | 1.8% | View All 29 Rows |
Immigrants in Eudora
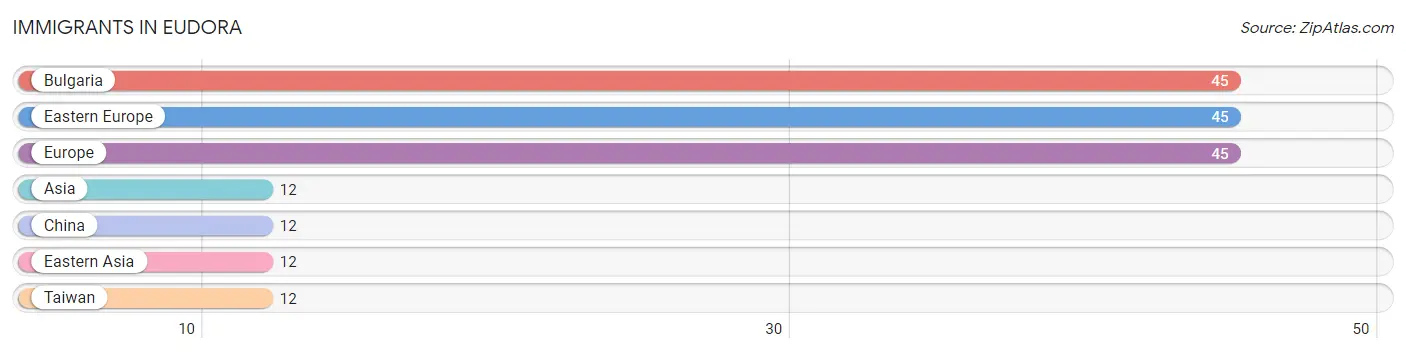
The most numerous immigrant groups reported in Eudora came from Bulgaria (45 | 0.7%), Eastern Europe (45 | 0.7%), Europe (45 | 0.7%), Asia (12 | 0.2%), and China (12 | 0.2%), together accounting for 2.7% of all Eudora residents.
| Immigration Origin | # Population | % Population |
| Asia | 12 | 0.2% |
| Bulgaria | 45 | 0.7% |
| China | 12 | 0.2% |
| Eastern Asia | 12 | 0.2% |
| Eastern Europe | 45 | 0.7% |
| Europe | 45 | 0.7% |
| Taiwan | 12 | 0.2% | View All 7 Rows |
Sex and Age in Eudora
Sex and Age in Eudora
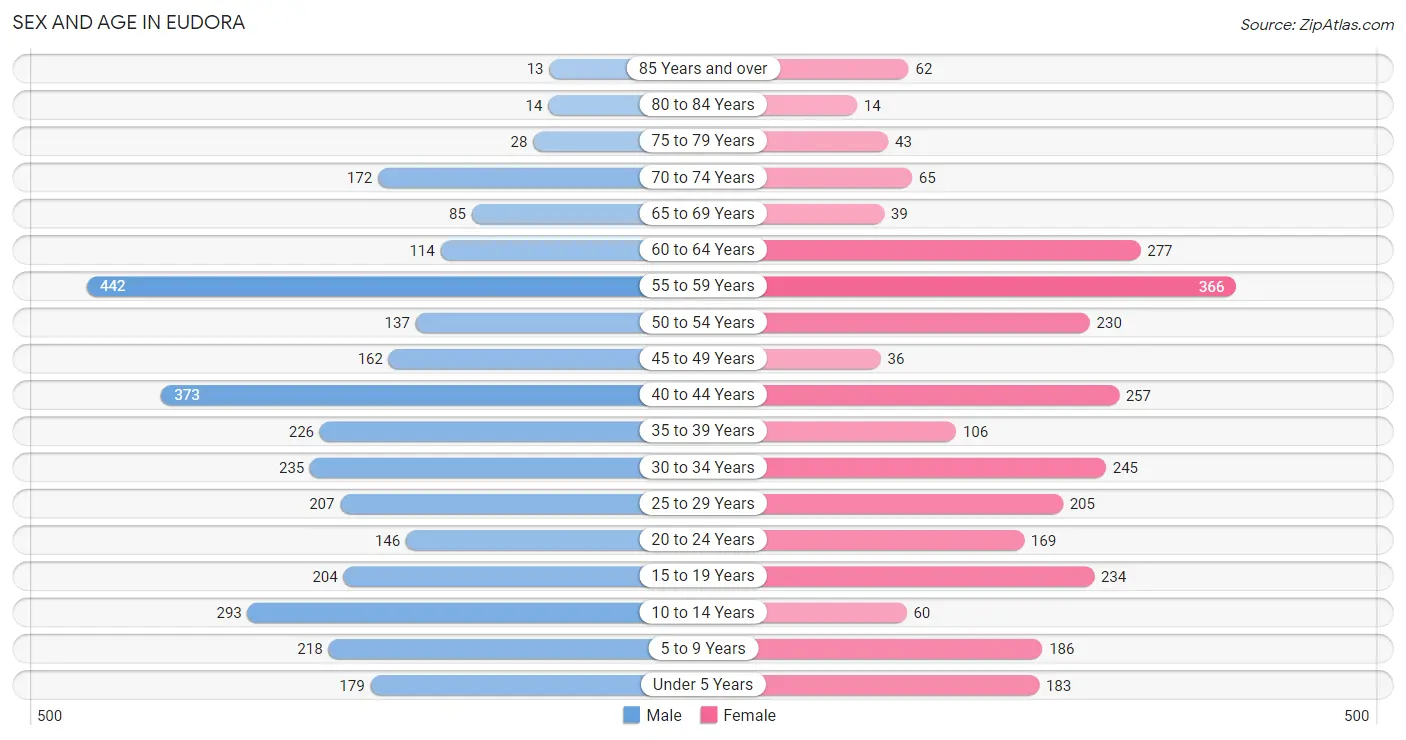
The most populous age groups in Eudora are 55 to 59 Years (442 | 13.6%) for men and 55 to 59 Years (366 | 13.2%) for women.
| Age Bracket | Male | Female |
| Under 5 Years | 179 (5.5%) | 183 (6.6%) |
| 5 to 9 Years | 218 (6.7%) | 186 (6.7%) |
| 10 to 14 Years | 293 (9.0%) | 60 (2.2%) |
| 15 to 19 Years | 204 (6.3%) | 234 (8.4%) |
| 20 to 24 Years | 146 (4.5%) | 169 (6.1%) |
| 25 to 29 Years | 207 (6.4%) | 205 (7.4%) |
| 30 to 34 Years | 235 (7.2%) | 245 (8.8%) |
| 35 to 39 Years | 226 (7.0%) | 106 (3.8%) |
| 40 to 44 Years | 373 (11.5%) | 257 (9.2%) |
| 45 to 49 Years | 162 (5.0%) | 36 (1.3%) |
| 50 to 54 Years | 137 (4.2%) | 230 (8.3%) |
| 55 to 59 Years | 442 (13.6%) | 366 (13.2%) |
| 60 to 64 Years | 114 (3.5%) | 277 (10.0%) |
| 65 to 69 Years | 85 (2.6%) | 39 (1.4%) |
| 70 to 74 Years | 172 (5.3%) | 65 (2.3%) |
| 75 to 79 Years | 28 (0.9%) | 43 (1.5%) |
| 80 to 84 Years | 14 (0.4%) | 14 (0.5%) |
| 85 Years and over | 13 (0.4%) | 62 (2.2%) |
| Total | 3,248 (100.0%) | 2,777 (100.0%) |
Families and Households in Eudora
Median Family Size in Eudora
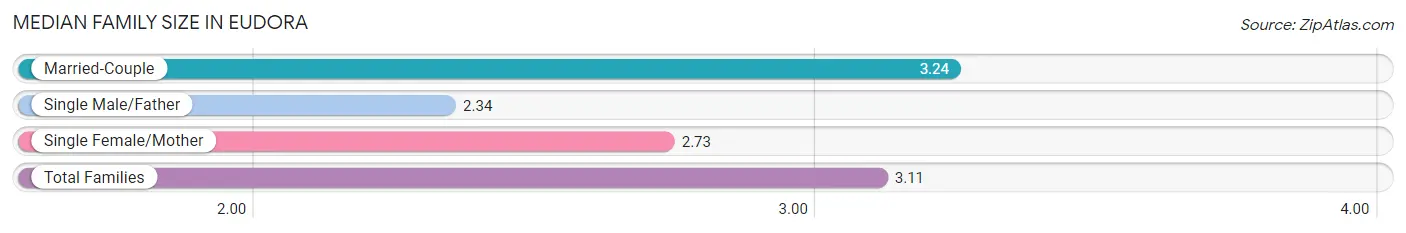
The median family size in Eudora is 3.11 persons per family, with married-couple families (1,382 | 83.0%) accounting for the largest median family size of 3.24 persons per family. On the other hand, single male/father families (174 | 10.4%) represent the smallest median family size with 2.34 persons per family.
| Family Type | # Families | Family Size |
| Married-Couple | 1,382 (83.0%) | 3.24 |
| Single Male/Father | 174 (10.4%) | 2.34 |
| Single Female/Mother | 110 (6.6%) | 2.73 |
| Total Families | 1,666 (100.0%) | 3.11 |
Median Household Size in Eudora
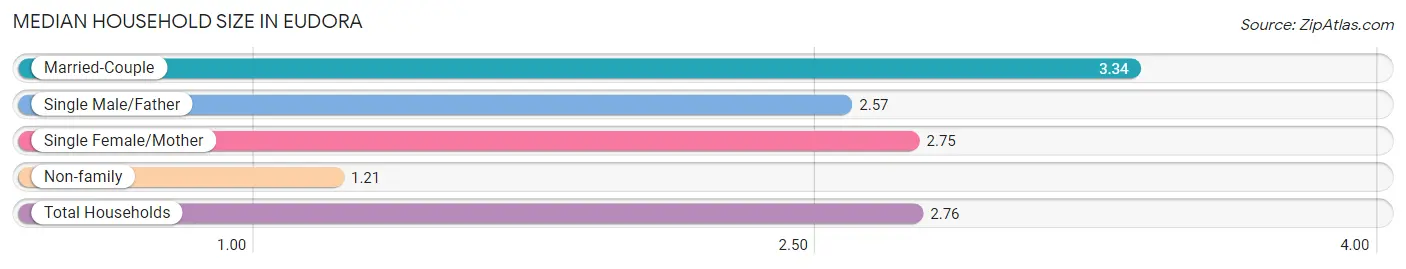
The median household size in Eudora is 2.76 persons per household, with married-couple households (1,382 | 64.0%) accounting for the largest median household size of 3.34 persons per household. non-family households (494 | 22.9%) represent the smallest median household size with 1.21 persons per household.
| Household Type | # Households | Household Size |
| Married-Couple | 1,382 (64.0%) | 3.34 |
| Single Male/Father | 174 (8.1%) | 2.57 |
| Single Female/Mother | 110 (5.1%) | 2.75 |
| Non-family | 494 (22.9%) | 1.21 |
| Total Households | 2,160 (100.0%) | 2.76 |
Household Size by Marriage Status in Eudora
Out of a total of 2,160 households in Eudora, 1,666 (77.1%) are family households, while 494 (22.9%) are nonfamily households. The most numerous type of family households are 2-person households, comprising 687, and the most common type of nonfamily households are 1-person households, comprising 392.
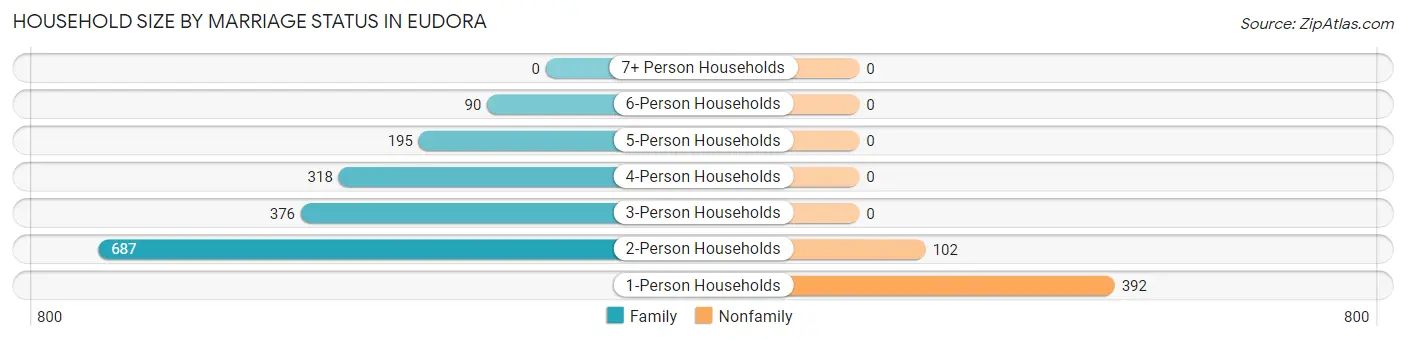
| Household Size | Family Households | Nonfamily Households |
| 1-Person Households | - | 392 (18.1%) |
| 2-Person Households | 687 (31.8%) | 102 (4.7%) |
| 3-Person Households | 376 (17.4%) | 0 (0.0%) |
| 4-Person Households | 318 (14.7%) | 0 (0.0%) |
| 5-Person Households | 195 (9.0%) | 0 (0.0%) |
| 6-Person Households | 90 (4.2%) | 0 (0.0%) |
| 7+ Person Households | 0 (0.0%) | 0 (0.0%) |
| Total | 1,666 (77.1%) | 494 (22.9%) |
Female Fertility in Eudora
Fertility by Age in Eudora
Average fertility rate in Eudora is 77.0 births per 1,000 women. Women in the age bracket of 20 to 34 years have the highest fertility rate with 131.0 births per 1,000 women. Women in the age bracket of 20 to 34 years acount for 81.8% of all women with births.
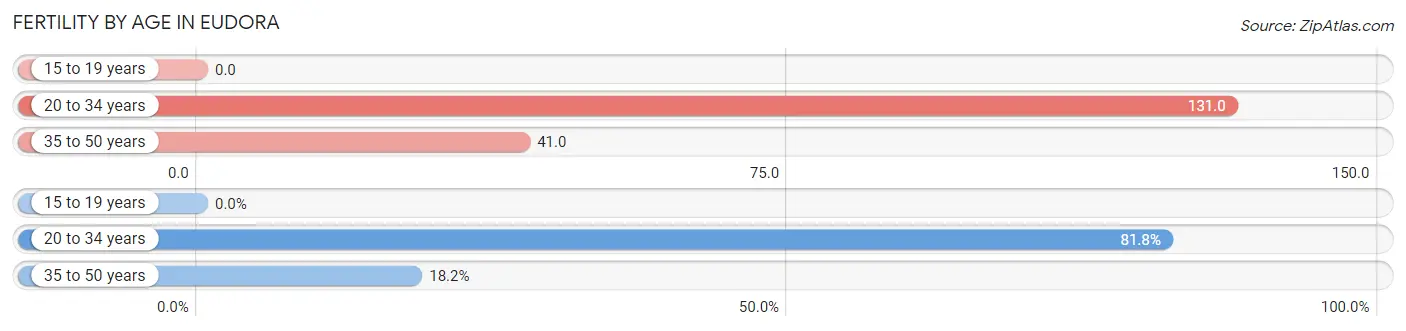
| Age Bracket | Women with Births | Births / 1,000 Women |
| 15 to 19 years | 0 (0.0%) | 0.0 |
| 20 to 34 years | 81 (81.8%) | 131.0 |
| 35 to 50 years | 18 (18.2%) | 41.0 |
| Total | 99 (100.0%) | 77.0 |
Fertility by Age by Marriage Status in Eudora
58.6% of women with births (99) in Eudora are married. The highest percentage of unmarried women with births falls into 20 to 34 years age bracket with 50.6% of them unmarried at the time of birth, while the lowest percentage of unmarried women with births belong to 35 to 50 years age bracket with 0.0% of them unmarried.
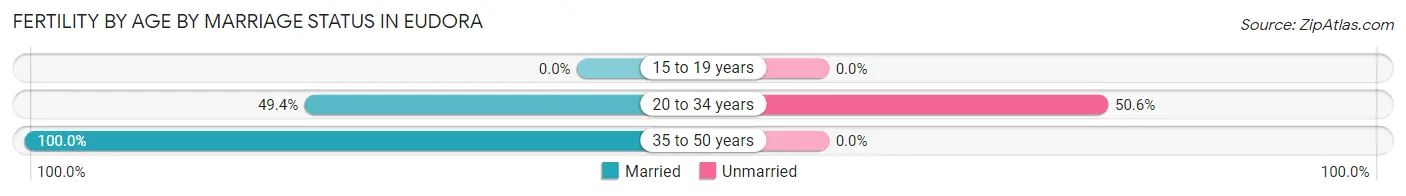
| Age Bracket | Married | Unmarried |
| 15 to 19 years | 0 (0.0%) | 0 (0.0%) |
| 20 to 34 years | 40 (49.4%) | 41 (50.6%) |
| 35 to 50 years | 18 (100.0%) | 0 (0.0%) |
| Total | 58 (58.6%) | 41 (41.4%) |
Fertility by Education in Eudora
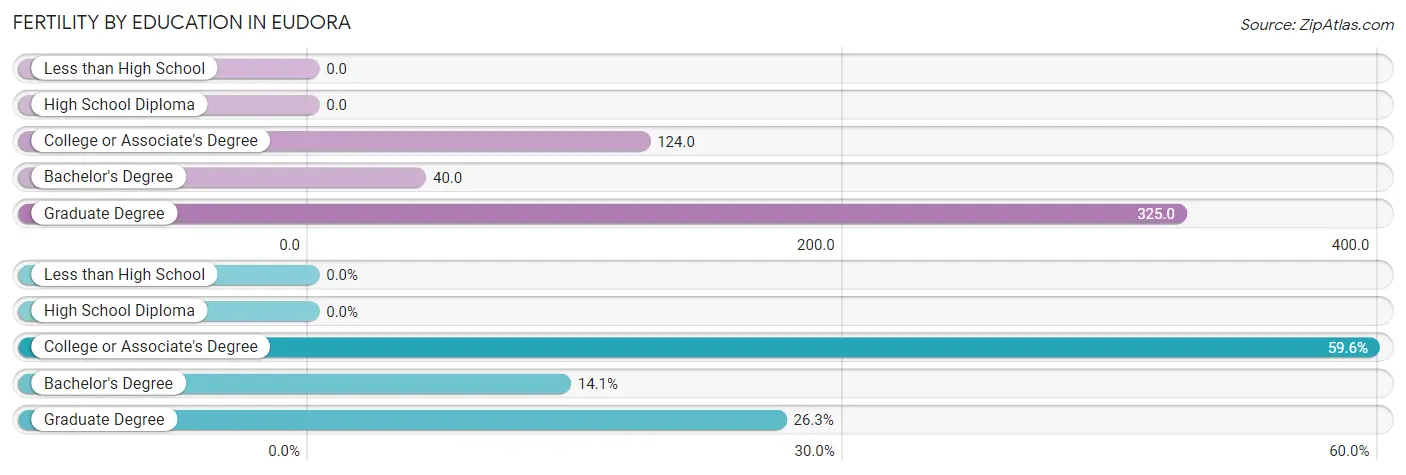
| Educational Attainment | Women with Births | Births / 1,000 Women |
| Less than High School | 0 (0.0%) | 0.0 |
| High School Diploma | 0 (0.0%) | 0.0 |
| College or Associate's Degree | 59 (59.6%) | 124.0 |
| Bachelor's Degree | 14 (14.1%) | 40.0 |
| Graduate Degree | 26 (26.3%) | 325.0 |
| Total | 99 (100.0%) | 77.0 |
Fertility by Education by Marriage Status in Eudora
41.4% of women with births in Eudora are unmarried. Women with the educational attainment of bachelor's degree are most likely to be married with 100.0% of them married at childbirth, while women with the educational attainment of college or associate's degree are least likely to be married with 69.5% of them unmarried at childbirth.
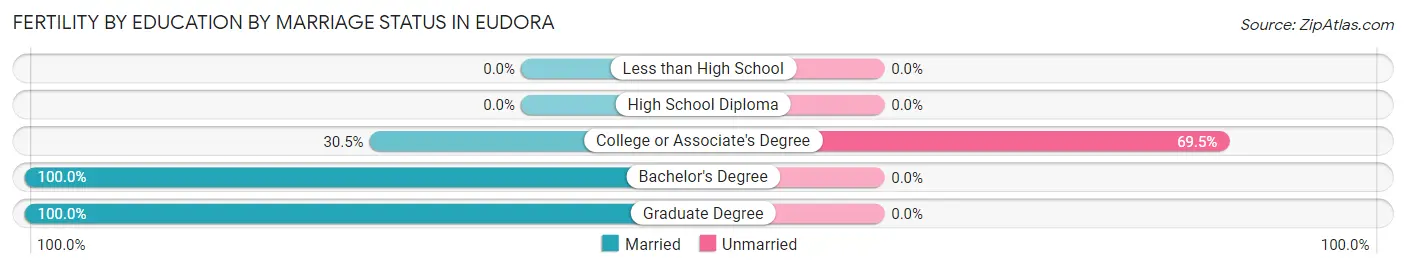
| Educational Attainment | Married | Unmarried |
| Less than High School | 0 (0.0%) | 0 (0.0%) |
| High School Diploma | 0 (0.0%) | 0 (0.0%) |
| College or Associate's Degree | 18 (30.5%) | 41 (69.5%) |
| Bachelor's Degree | 14 (100.0%) | 0 (0.0%) |
| Graduate Degree | 26 (100.0%) | 0 (0.0%) |
| Total | 58 (58.6%) | 41 (41.4%) |
Employment Characteristics in Eudora
Employment by Class of Employer in Eudora
Among the 3,476 employed individuals in Eudora, private company employees (2,431 | 69.9%), local government employees (226 | 6.5%), and not-for-profit organizations (211 | 6.1%) make up the most common classes of employment.
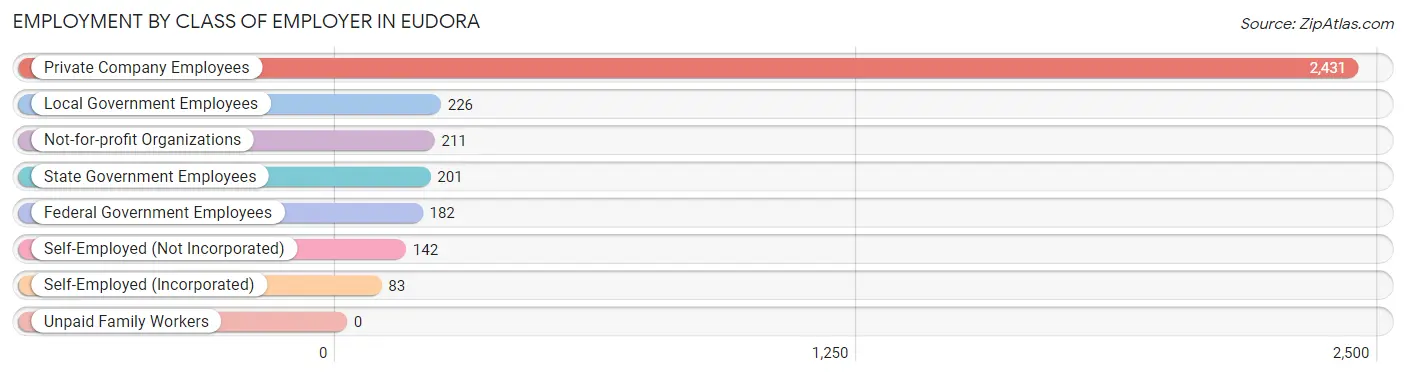
| Employer Class | # Employees | % Employees |
| Private Company Employees | 2,431 | 69.9% |
| Self-Employed (Incorporated) | 83 | 2.4% |
| Self-Employed (Not Incorporated) | 142 | 4.1% |
| Not-for-profit Organizations | 211 | 6.1% |
| Local Government Employees | 226 | 6.5% |
| State Government Employees | 201 | 5.8% |
| Federal Government Employees | 182 | 5.2% |
| Unpaid Family Workers | 0 | 0.0% |
| Total | 3,476 | 100.0% |
Employment Status by Age in Eudora
According to the labor force statistics for Eudora, out of the total population over 16 years of age (4,861), 73.5% or 3,573 individuals are in the labor force, with 2.3% or 82 of them unemployed. The age group with the highest labor force participation rate is 45 to 54 years, with 97.9% or 553 individuals in the labor force. Within the labor force, the 25 to 29 years age range has the highest percentage of unemployed individuals, with 7.9% or 29 of them being unemployed.
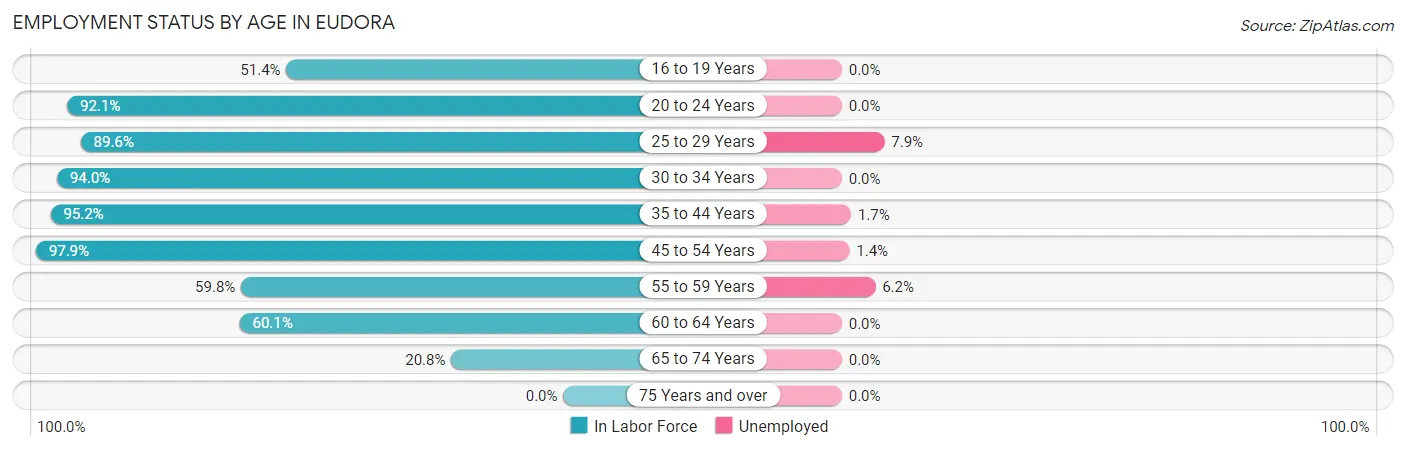
| Age Bracket | In Labor Force | Unemployed |
| 16 to 19 Years | 202 (51.4%) | 0 (0.0%) |
| 20 to 24 Years | 290 (92.1%) | 0 (0.0%) |
| 25 to 29 Years | 369 (89.6%) | 29 (7.9%) |
| 30 to 34 Years | 451 (94.0%) | 0 (0.0%) |
| 35 to 44 Years | 916 (95.2%) | 16 (1.7%) |
| 45 to 54 Years | 553 (97.9%) | 8 (1.4%) |
| 55 to 59 Years | 483 (59.8%) | 30 (6.2%) |
| 60 to 64 Years | 235 (60.1%) | 0 (0.0%) |
| 65 to 74 Years | 75 (20.8%) | 0 (0.0%) |
| 75 Years and over | 0 (0.0%) | 0 (0.0%) |
| Total | 3,573 (73.5%) | 82 (2.3%) |
Employment Status by Educational Attainment in Eudora
According to labor force statistics for Eudora, 83.1% of individuals (3,007) out of the total population between 25 and 64 years of age (3,618) are in the labor force, with 2.8% or 84 of them being unemployed. The group with the highest labor force participation rate are those with the educational attainment of bachelor's degree or higher, with 96.6% or 1,111 individuals in the labor force. Within the labor force, individuals with less than high school education have the highest percentage of unemployment, with 30.3% or 30 of them being unemployed.
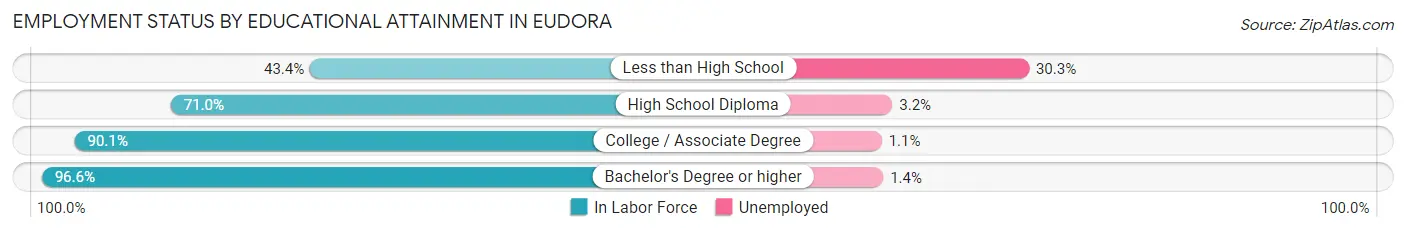
| Educational Attainment | In Labor Force | Unemployed |
| Less than High School | 99 (43.4%) | 69 (30.3%) |
| High School Diploma | 824 (71.0%) | 37 (3.2%) |
| College / Associate Degree | 973 (90.1%) | 12 (1.1%) |
| Bachelor's Degree or higher | 1,111 (96.6%) | 16 (1.4%) |
| Total | 3,007 (83.1%) | 101 (2.8%) |
Employment Occupations by Sex in Eudora
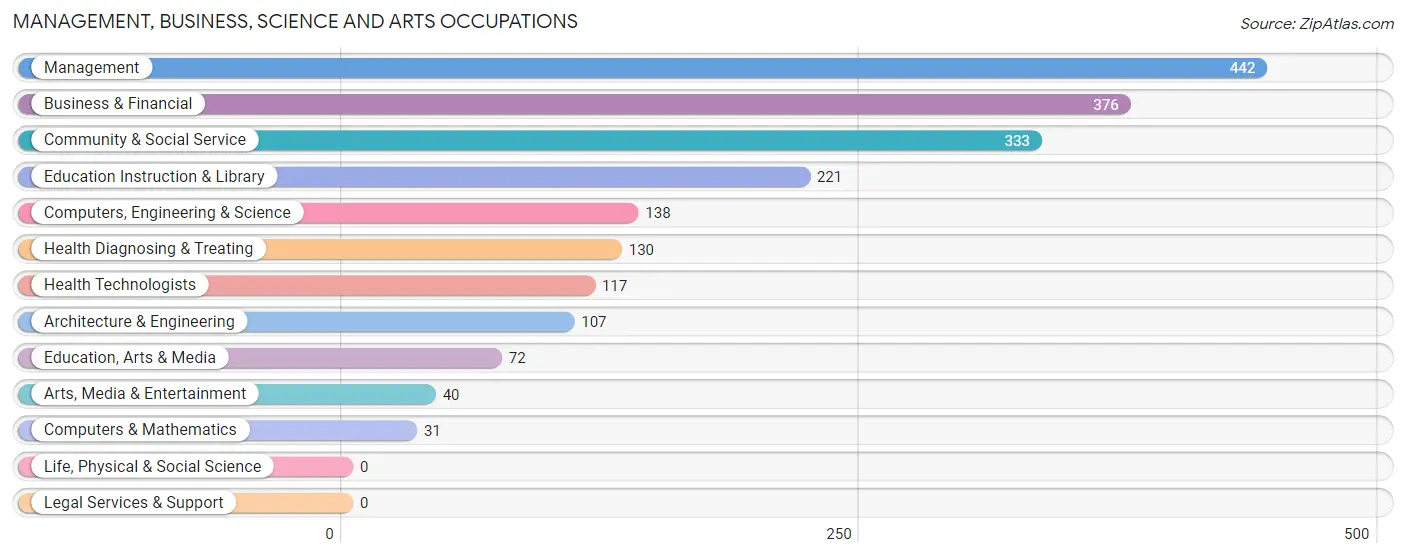
Management, Business, Science and Arts Occupations
The most common Management, Business, Science and Arts occupations in Eudora are Management (442 | 12.7%), Business & Financial (376 | 10.8%), Community & Social Service (333 | 9.5%), Education Instruction & Library (221 | 6.3%), and Computers, Engineering & Science (138 | 4.0%).
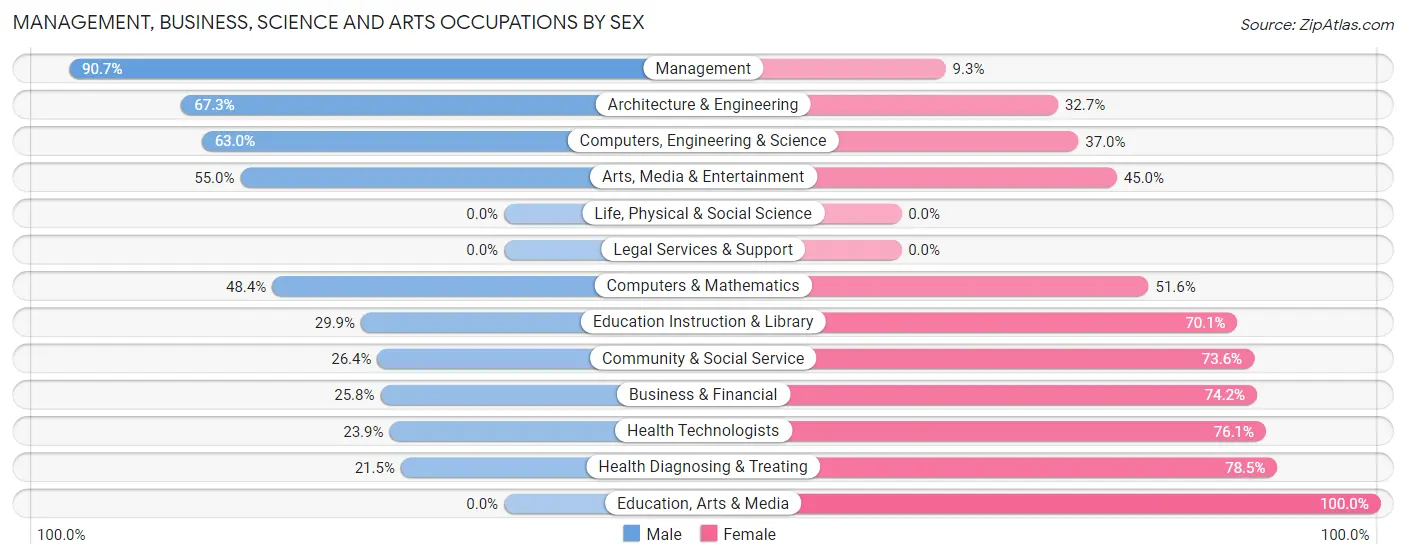
Management, Business, Science and Arts Occupations by Sex
Within the Management, Business, Science and Arts occupations in Eudora, the most male-oriented occupations are Management (90.7%), Architecture & Engineering (67.3%), and Computers, Engineering & Science (63.0%), while the most female-oriented occupations are Education, Arts & Media (100.0%), Health Diagnosing & Treating (78.5%), and Health Technologists (76.1%).
| Occupation | Male | Female |
| Management | 401 (90.7%) | 41 (9.3%) |
| Business & Financial | 97 (25.8%) | 279 (74.2%) |
| Computers, Engineering & Science | 87 (63.0%) | 51 (37.0%) |
| Computers & Mathematics | 15 (48.4%) | 16 (51.6%) |
| Architecture & Engineering | 72 (67.3%) | 35 (32.7%) |
| Life, Physical & Social Science | 0 (0.0%) | 0 (0.0%) |
| Community & Social Service | 88 (26.4%) | 245 (73.6%) |
| Education, Arts & Media | 0 (0.0%) | 72 (100.0%) |
| Legal Services & Support | 0 (0.0%) | 0 (0.0%) |
| Education Instruction & Library | 66 (29.9%) | 155 (70.1%) |
| Arts, Media & Entertainment | 22 (55.0%) | 18 (45.0%) |
| Health Diagnosing & Treating | 28 (21.5%) | 102 (78.5%) |
| Health Technologists | 28 (23.9%) | 89 (76.1%) |
| Total (Category) | 701 (49.4%) | 718 (50.6%) |
| Total (Overall) | 1,918 (54.9%) | 1,573 (45.1%) |
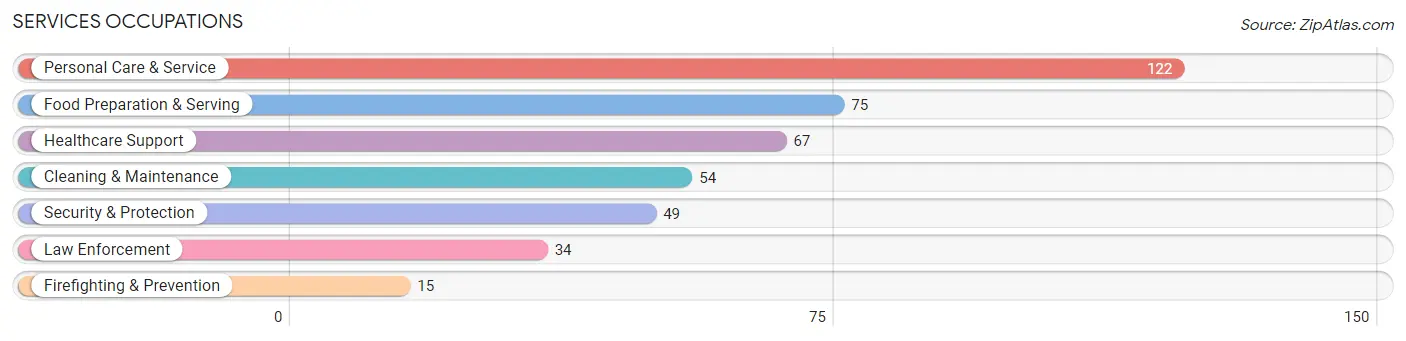
Services Occupations
The most common Services occupations in Eudora are Personal Care & Service (122 | 3.5%), Food Preparation & Serving (75 | 2.1%), Healthcare Support (67 | 1.9%), Cleaning & Maintenance (54 | 1.5%), and Security & Protection (49 | 1.4%).
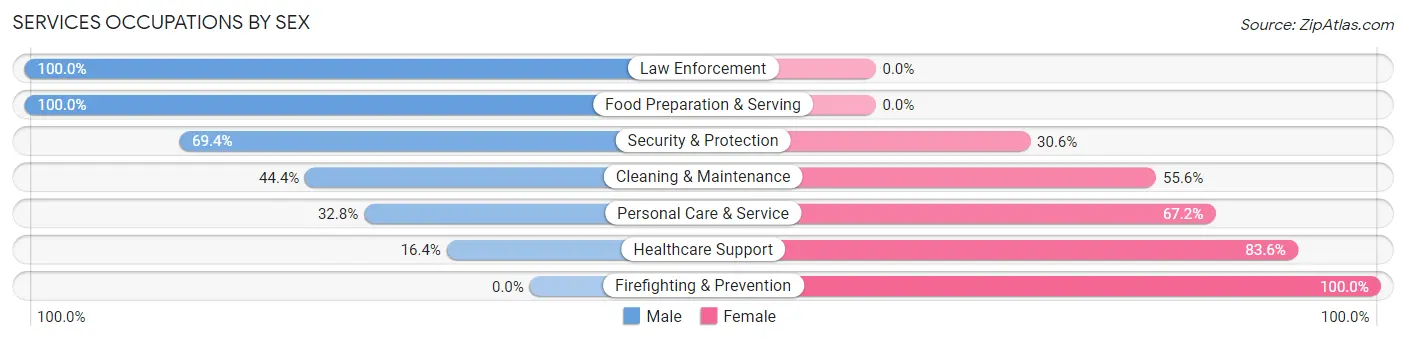
Services Occupations by Sex
Within the Services occupations in Eudora, the most male-oriented occupations are Law Enforcement (100.0%), Food Preparation & Serving (100.0%), and Security & Protection (69.4%), while the most female-oriented occupations are Firefighting & Prevention (100.0%), Healthcare Support (83.6%), and Personal Care & Service (67.2%).
| Occupation | Male | Female |
| Healthcare Support | 11 (16.4%) | 56 (83.6%) |
| Security & Protection | 34 (69.4%) | 15 (30.6%) |
| Firefighting & Prevention | 0 (0.0%) | 15 (100.0%) |
| Law Enforcement | 34 (100.0%) | 0 (0.0%) |
| Food Preparation & Serving | 75 (100.0%) | 0 (0.0%) |
| Cleaning & Maintenance | 24 (44.4%) | 30 (55.6%) |
| Personal Care & Service | 40 (32.8%) | 82 (67.2%) |
| Total (Category) | 184 (50.1%) | 183 (49.9%) |
| Total (Overall) | 1,918 (54.9%) | 1,573 (45.1%) |
Sales and Office Occupations
The most common Sales and Office occupations in Eudora are Sales & Related (383 | 11.0%), and Office & Administration (308 | 8.8%).

Sales and Office Occupations by Sex
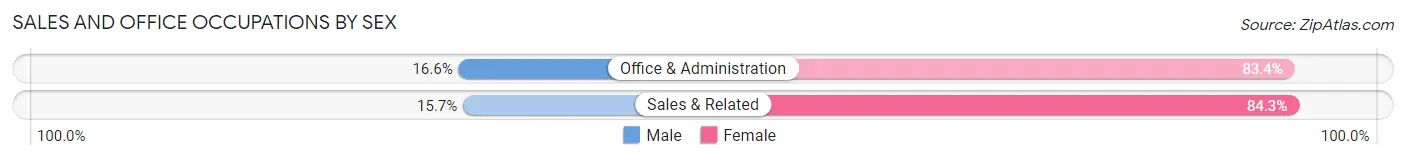
| Occupation | Male | Female |
| Sales & Related | 60 (15.7%) | 323 (84.3%) |
| Office & Administration | 51 (16.6%) | 257 (83.4%) |
| Total (Category) | 111 (16.1%) | 580 (83.9%) |
| Total (Overall) | 1,918 (54.9%) | 1,573 (45.1%) |
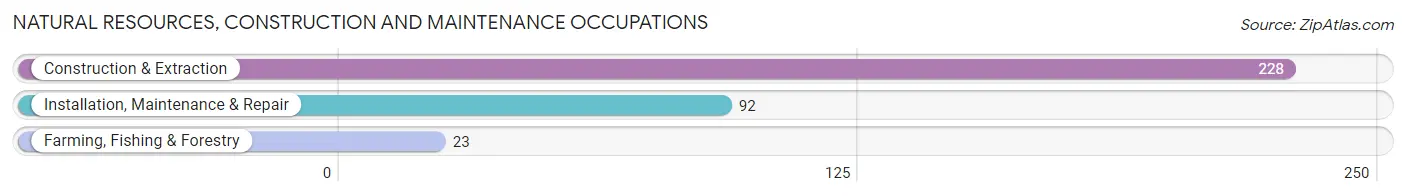
Natural Resources, Construction and Maintenance Occupations
The most common Natural Resources, Construction and Maintenance occupations in Eudora are Construction & Extraction (228 | 6.5%), Installation, Maintenance & Repair (92 | 2.6%), and Farming, Fishing & Forestry (23 | 0.7%).
Natural Resources, Construction and Maintenance Occupations by Sex
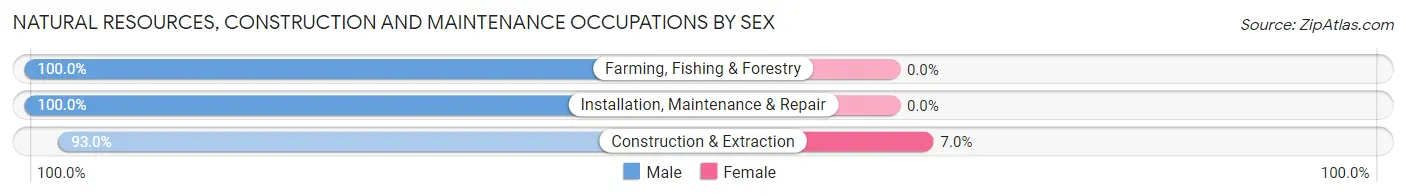
| Occupation | Male | Female |
| Farming, Fishing & Forestry | 23 (100.0%) | 0 (0.0%) |
| Construction & Extraction | 212 (93.0%) | 16 (7.0%) |
| Installation, Maintenance & Repair | 92 (100.0%) | 0 (0.0%) |
| Total (Category) | 327 (95.3%) | 16 (4.7%) |
| Total (Overall) | 1,918 (54.9%) | 1,573 (45.1%) |
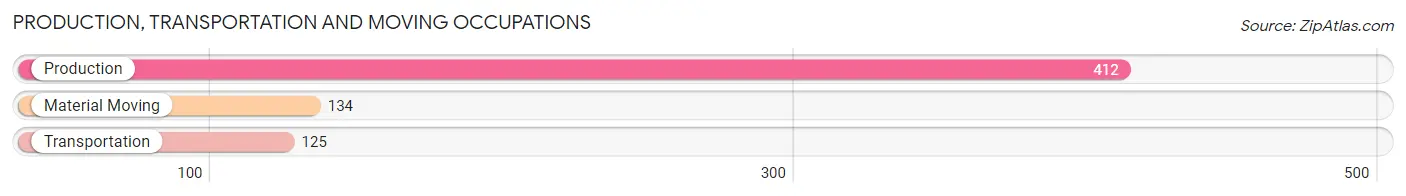
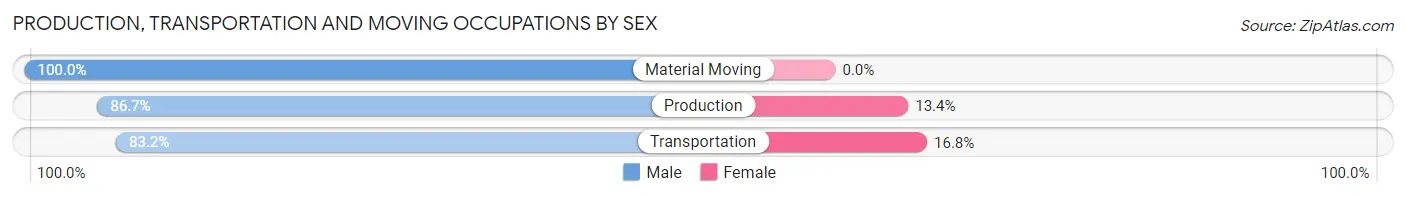
Production, Transportation and Moving Occupations
The most common Production, Transportation and Moving occupations in Eudora are Production (412 | 11.8%), Material Moving (134 | 3.8%), and Transportation (125 | 3.6%).
Production, Transportation and Moving Occupations by Sex
| Occupation | Male | Female |
| Production | 357 (86.7%) | 55 (13.4%) |
| Transportation | 104 (83.2%) | 21 (16.8%) |
| Material Moving | 134 (100.0%) | 0 (0.0%) |
| Total (Category) | 595 (88.7%) | 76 (11.3%) |
| Total (Overall) | 1,918 (54.9%) | 1,573 (45.1%) |
Employment Industries by Sex in Eudora
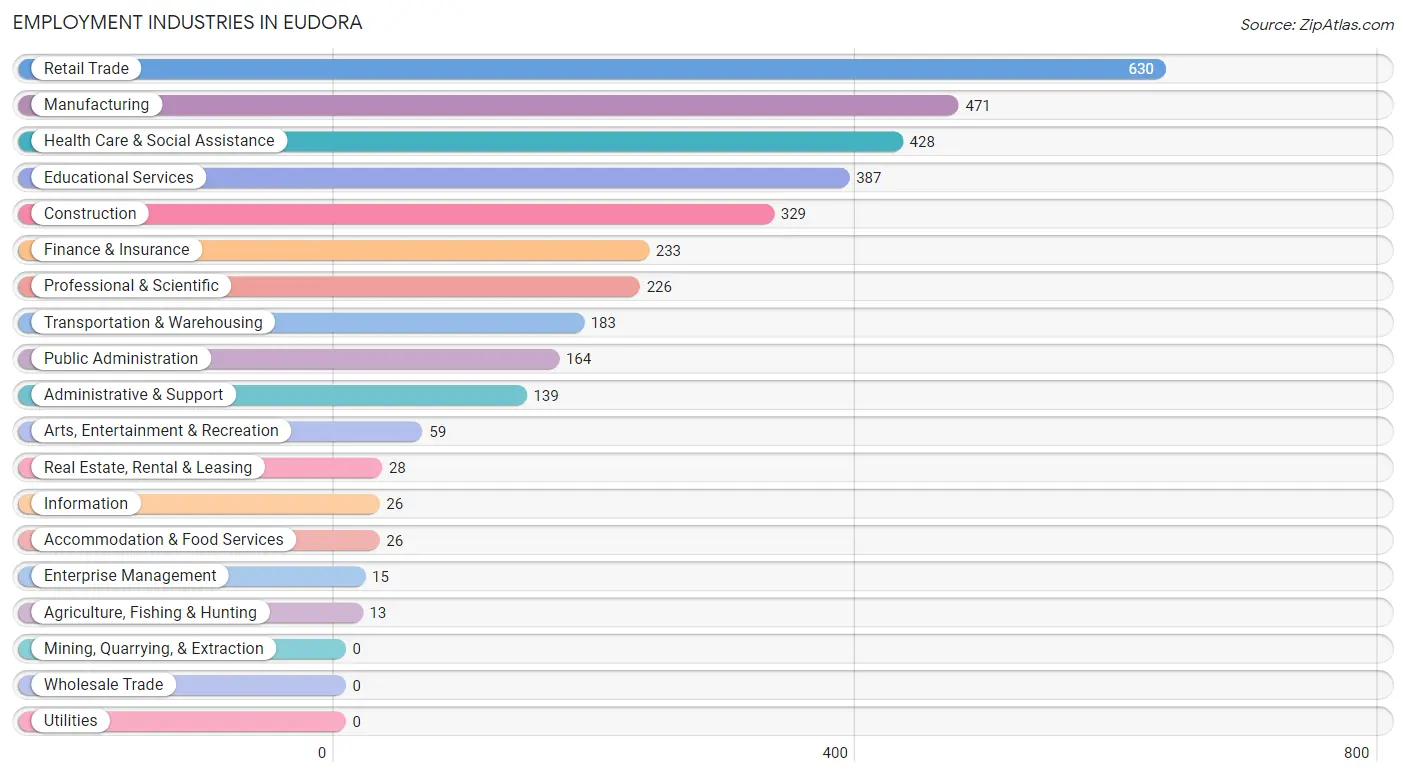
Employment Industries in Eudora
The major employment industries in Eudora include Retail Trade (630 | 18.0%), Manufacturing (471 | 13.5%), Health Care & Social Assistance (428 | 12.3%), Educational Services (387 | 11.1%), and Construction (329 | 9.4%).
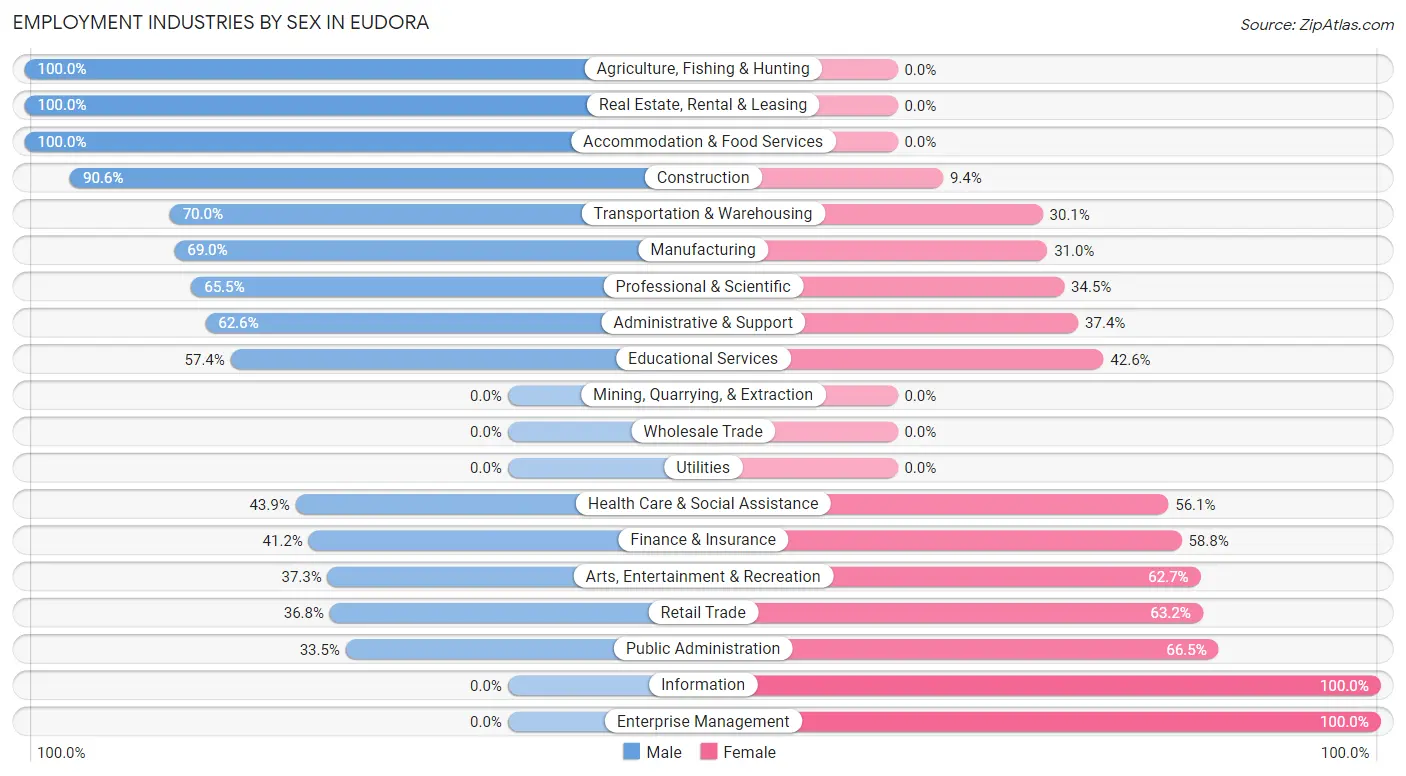
Employment Industries by Sex in Eudora
The Eudora industries that see more men than women are Agriculture, Fishing & Hunting (100.0%), Real Estate, Rental & Leasing (100.0%), and Accommodation & Food Services (100.0%), whereas the industries that tend to have a higher number of women are Information (100.0%), Enterprise Management (100.0%), and Public Administration (66.5%).
| Industry | Male | Female |
| Agriculture, Fishing & Hunting | 13 (100.0%) | 0 (0.0%) |
| Mining, Quarrying, & Extraction | 0 (0.0%) | 0 (0.0%) |
| Construction | 298 (90.6%) | 31 (9.4%) |
| Manufacturing | 325 (69.0%) | 146 (31.0%) |
| Wholesale Trade | 0 (0.0%) | 0 (0.0%) |
| Retail Trade | 232 (36.8%) | 398 (63.2%) |
| Transportation & Warehousing | 128 (70.0%) | 55 (30.0%) |
| Utilities | 0 (0.0%) | 0 (0.0%) |
| Information | 0 (0.0%) | 26 (100.0%) |
| Finance & Insurance | 96 (41.2%) | 137 (58.8%) |
| Real Estate, Rental & Leasing | 28 (100.0%) | 0 (0.0%) |
| Professional & Scientific | 148 (65.5%) | 78 (34.5%) |
| Enterprise Management | 0 (0.0%) | 15 (100.0%) |
| Administrative & Support | 87 (62.6%) | 52 (37.4%) |
| Educational Services | 222 (57.4%) | 165 (42.6%) |
| Health Care & Social Assistance | 188 (43.9%) | 240 (56.1%) |
| Arts, Entertainment & Recreation | 22 (37.3%) | 37 (62.7%) |
| Accommodation & Food Services | 26 (100.0%) | 0 (0.0%) |
| Public Administration | 55 (33.5%) | 109 (66.5%) |
| Total | 1,918 (54.9%) | 1,573 (45.1%) |
Education in Eudora
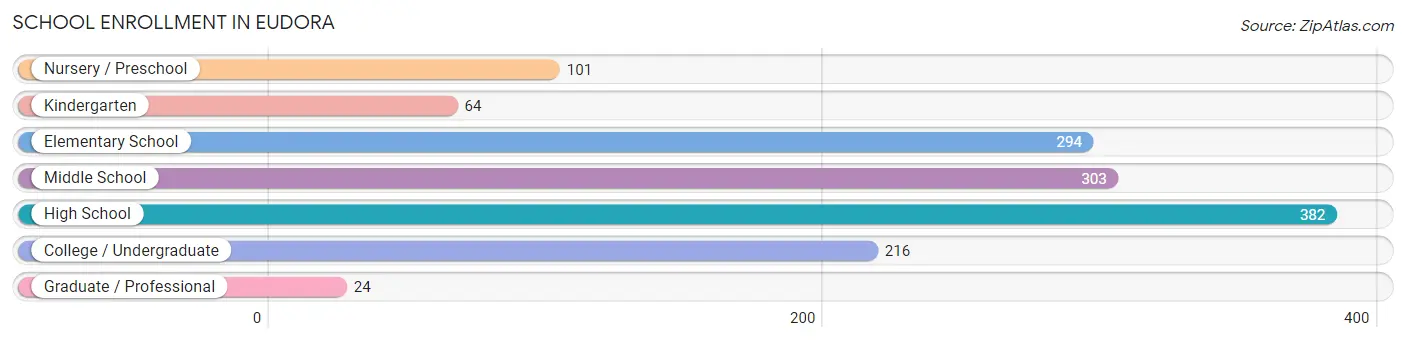
School Enrollment in Eudora
The most common levels of schooling among the 1,384 students in Eudora are high school (382 | 27.6%), middle school (303 | 21.9%), and elementary school (294 | 21.2%).
| School Level | # Students | % Students |
| Nursery / Preschool | 101 | 7.3% |
| Kindergarten | 64 | 4.6% |
| Elementary School | 294 | 21.2% |
| Middle School | 303 | 21.9% |
| High School | 382 | 27.6% |
| College / Undergraduate | 216 | 15.6% |
| Graduate / Professional | 24 | 1.7% |
| Total | 1,384 | 100.0% |
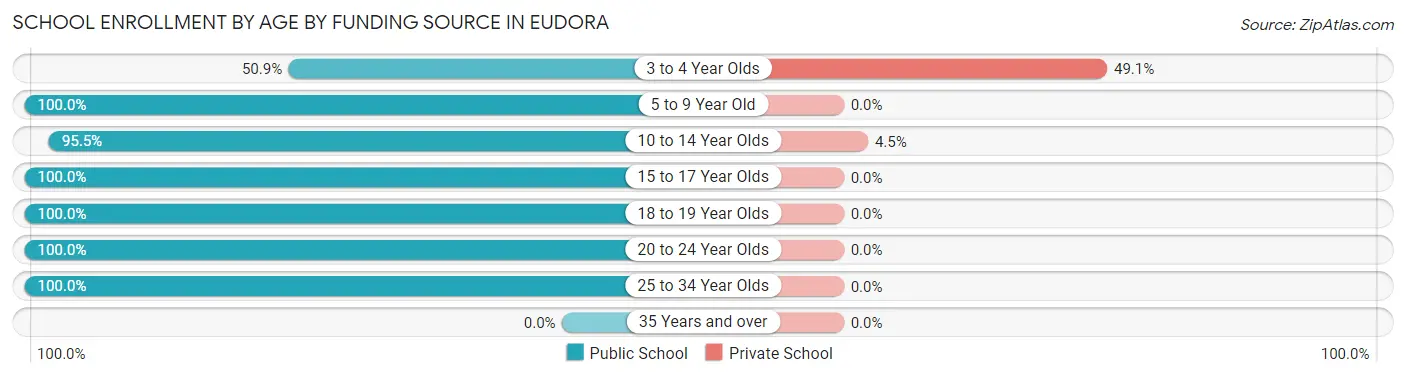
School Enrollment by Age by Funding Source in Eudora
Out of a total of 1,384 students who are enrolled in schools in Eudora, 42 (3.0%) attend a private institution, while the remaining 1,342 (97.0%) are enrolled in public schools. The age group of 3 to 4 year olds has the highest likelihood of being enrolled in private schools, with 26 (49.1% in the age bracket) enrolled. Conversely, the age group of 5 to 9 year old has the lowest likelihood of being enrolled in a private school, with 374 (100.0% in the age bracket) attending a public institution.
| Age Bracket | Public School | Private School |
| 3 to 4 Year Olds | 27 (50.9%) | 26 (49.1%) |
| 5 to 9 Year Old | 374 (100.0%) | 0 (0.0%) |
| 10 to 14 Year Olds | 337 (95.5%) | 16 (4.5%) |
| 15 to 17 Year Olds | 354 (100.0%) | 0 (0.0%) |
| 18 to 19 Year Olds | 20 (100.0%) | 0 (0.0%) |
| 20 to 24 Year Olds | 218 (100.0%) | 0 (0.0%) |
| 25 to 34 Year Olds | 12 (100.0%) | 0 (0.0%) |
| 35 Years and over | 0 (0.0%) | 0 (0.0%) |
| Total | 1,342 (97.0%) | 42 (3.0%) |
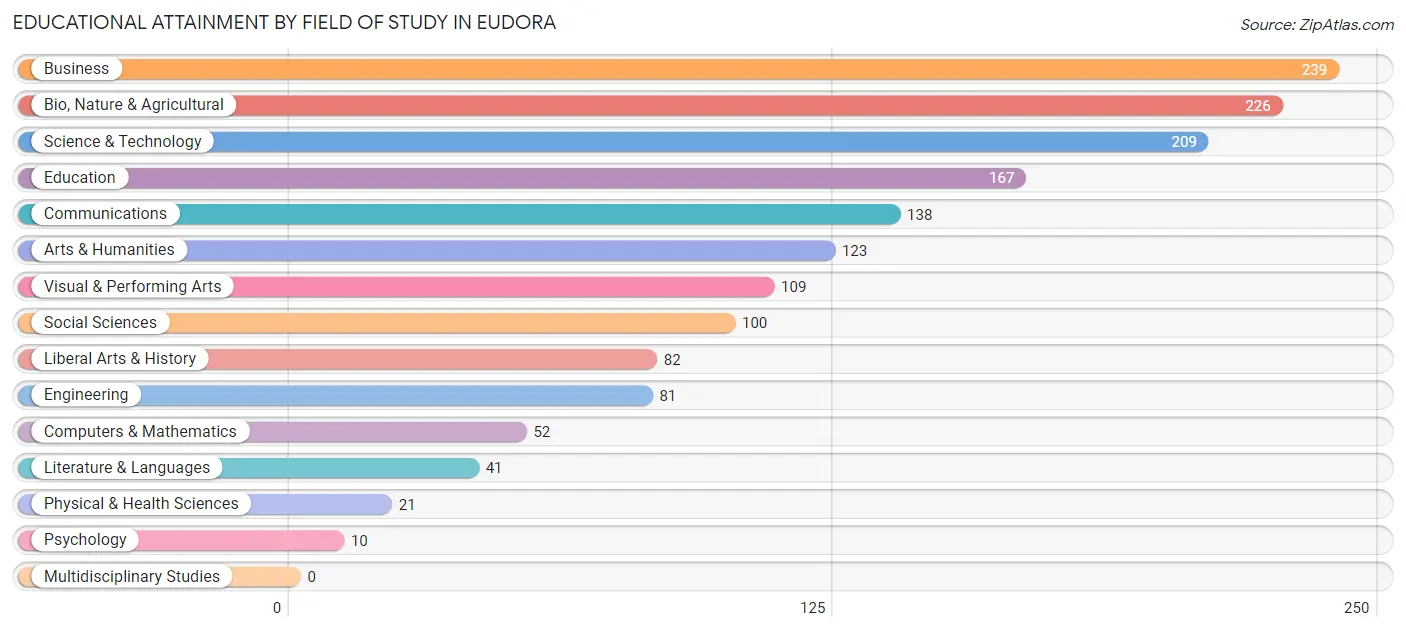
Educational Attainment by Field of Study in Eudora
Business (239 | 15.0%), bio, nature & agricultural (226 | 14.1%), science & technology (209 | 13.1%), education (167 | 10.4%), and communications (138 | 8.6%) are the most common fields of study among 1,598 individuals in Eudora who have obtained a bachelor's degree or higher.
| Field of Study | # Graduates | % Graduates |
| Computers & Mathematics | 52 | 3.3% |
| Bio, Nature & Agricultural | 226 | 14.1% |
| Physical & Health Sciences | 21 | 1.3% |
| Psychology | 10 | 0.6% |
| Social Sciences | 100 | 6.3% |
| Engineering | 81 | 5.1% |
| Multidisciplinary Studies | 0 | 0.0% |
| Science & Technology | 209 | 13.1% |
| Business | 239 | 15.0% |
| Education | 167 | 10.4% |
| Literature & Languages | 41 | 2.6% |
| Liberal Arts & History | 82 | 5.1% |
| Visual & Performing Arts | 109 | 6.8% |
| Communications | 138 | 8.6% |
| Arts & Humanities | 123 | 7.7% |
| Total | 1,598 | 100.0% |
Transportation & Commute in Eudora
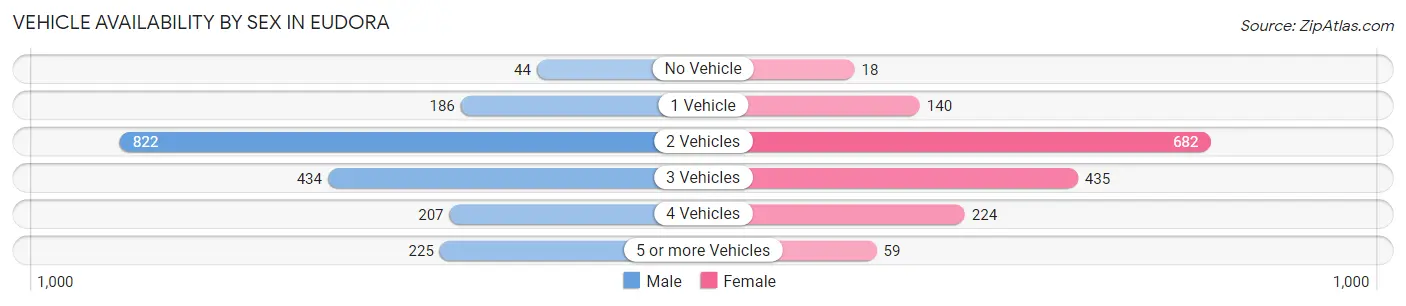
Vehicle Availability by Sex in Eudora
The most prevalent vehicle ownership categories in Eudora are males with 2 vehicles (822, accounting for 42.9%) and females with 2 vehicles (682, making up 52.8%).
| Vehicles Available | Male | Female |
| No Vehicle | 44 (2.3%) | 18 (1.2%) |
| 1 Vehicle | 186 (9.7%) | 140 (9.0%) |
| 2 Vehicles | 822 (42.9%) | 682 (43.8%) |
| 3 Vehicles | 434 (22.6%) | 435 (27.9%) |
| 4 Vehicles | 207 (10.8%) | 224 (14.4%) |
| 5 or more Vehicles | 225 (11.7%) | 59 (3.8%) |
| Total | 1,918 (100.0%) | 1,558 (100.0%) |
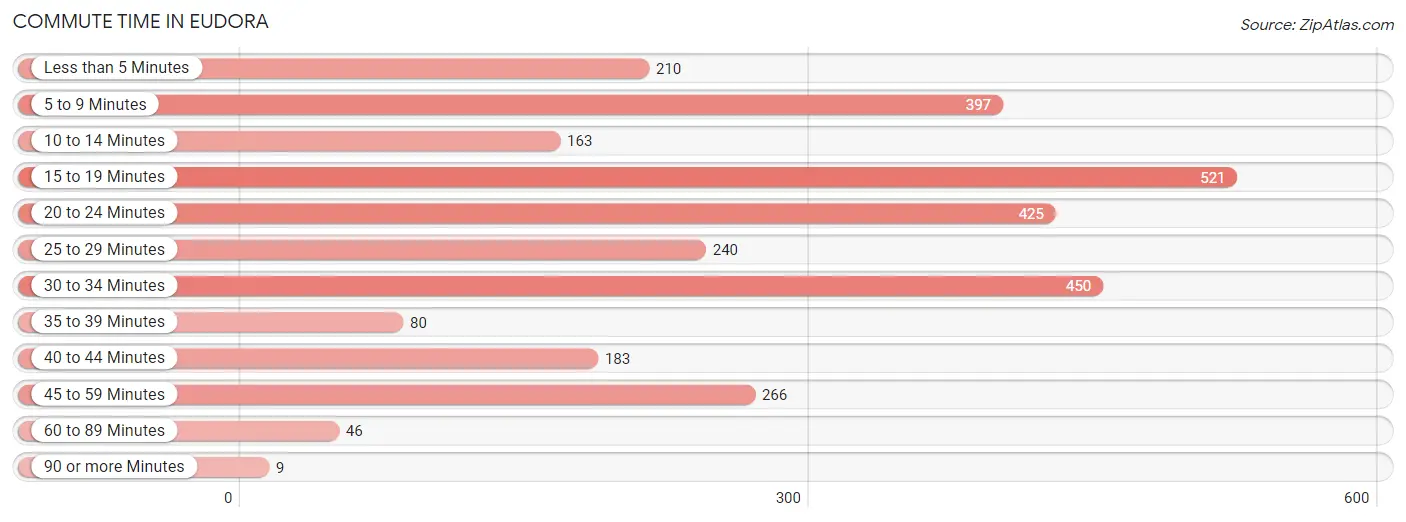
Commute Time in Eudora
The most frequently occuring commute durations in Eudora are 15 to 19 minutes (521 commuters, 17.4%), 30 to 34 minutes (450 commuters, 15.0%), and 20 to 24 minutes (425 commuters, 14.2%).
| Commute Time | # Commuters | % Commuters |
| Less than 5 Minutes | 210 | 7.0% |
| 5 to 9 Minutes | 397 | 13.3% |
| 10 to 14 Minutes | 163 | 5.4% |
| 15 to 19 Minutes | 521 | 17.4% |
| 20 to 24 Minutes | 425 | 14.2% |
| 25 to 29 Minutes | 240 | 8.0% |
| 30 to 34 Minutes | 450 | 15.0% |
| 35 to 39 Minutes | 80 | 2.7% |
| 40 to 44 Minutes | 183 | 6.1% |
| 45 to 59 Minutes | 266 | 8.9% |
| 60 to 89 Minutes | 46 | 1.5% |
| 90 or more Minutes | 9 | 0.3% |
Commute Time by Sex in Eudora
The most common commute times in Eudora are 30 to 34 minutes (344 commuters, 21.4%) for males and 15 to 19 minutes (253 commuters, 18.2%) for females.
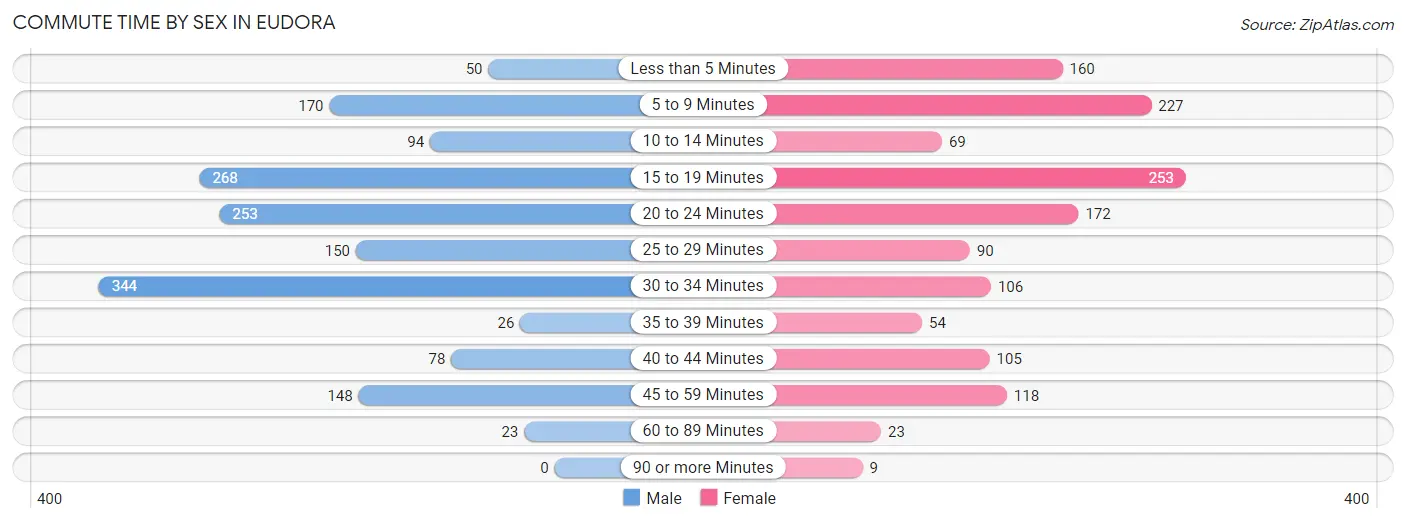
| Commute Time | Male | Female |
| Less than 5 Minutes | 50 (3.1%) | 160 (11.5%) |
| 5 to 9 Minutes | 170 (10.6%) | 227 (16.4%) |
| 10 to 14 Minutes | 94 (5.9%) | 69 (5.0%) |
| 15 to 19 Minutes | 268 (16.7%) | 253 (18.2%) |
| 20 to 24 Minutes | 253 (15.8%) | 172 (12.4%) |
| 25 to 29 Minutes | 150 (9.3%) | 90 (6.5%) |
| 30 to 34 Minutes | 344 (21.4%) | 106 (7.6%) |
| 35 to 39 Minutes | 26 (1.6%) | 54 (3.9%) |
| 40 to 44 Minutes | 78 (4.9%) | 105 (7.6%) |
| 45 to 59 Minutes | 148 (9.2%) | 118 (8.5%) |
| 60 to 89 Minutes | 23 (1.4%) | 23 (1.7%) |
| 90 or more Minutes | 0 (0.0%) | 9 (0.6%) |
Time of Departure to Work by Sex in Eudora
The most frequent times of departure to work in Eudora are 6:00 AM to 6:29 AM (306, 19.1%) for males and 7:30 AM to 7:59 AM (230, 16.6%) for females.
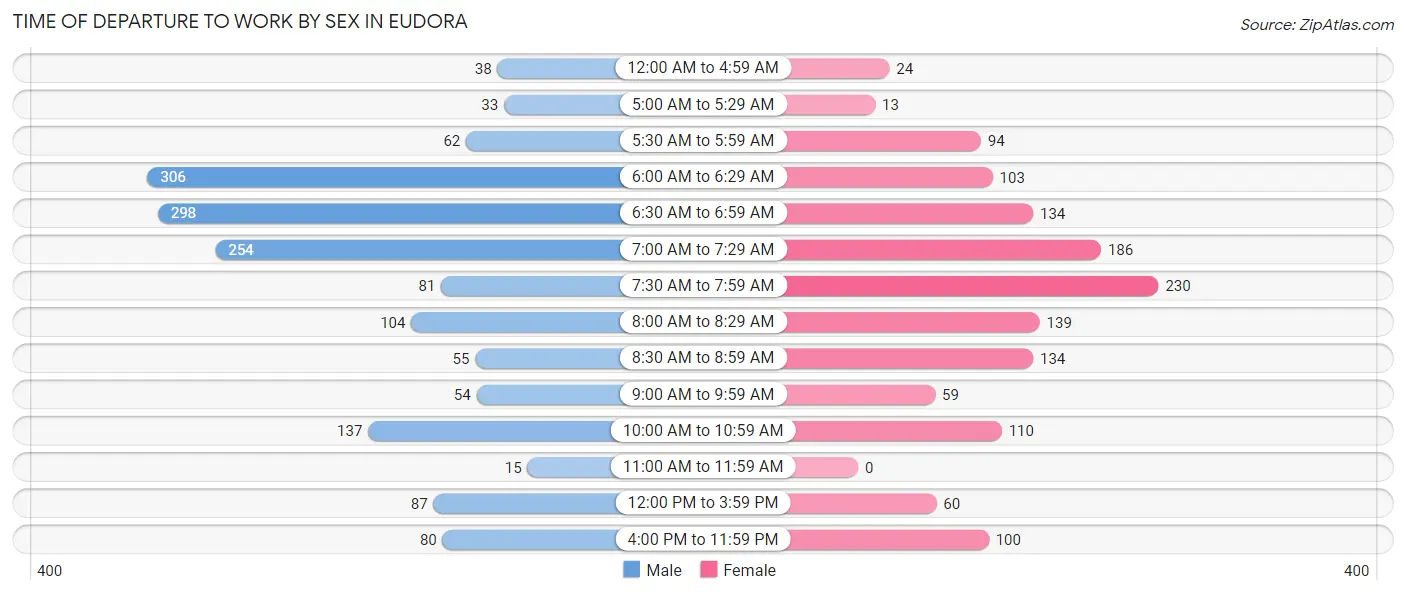
| Time of Departure | Male | Female |
| 12:00 AM to 4:59 AM | 38 (2.4%) | 24 (1.7%) |
| 5:00 AM to 5:29 AM | 33 (2.1%) | 13 (0.9%) |
| 5:30 AM to 5:59 AM | 62 (3.9%) | 94 (6.8%) |
| 6:00 AM to 6:29 AM | 306 (19.1%) | 103 (7.4%) |
| 6:30 AM to 6:59 AM | 298 (18.6%) | 134 (9.7%) |
| 7:00 AM to 7:29 AM | 254 (15.8%) | 186 (13.4%) |
| 7:30 AM to 7:59 AM | 81 (5.1%) | 230 (16.6%) |
| 8:00 AM to 8:29 AM | 104 (6.5%) | 139 (10.0%) |
| 8:30 AM to 8:59 AM | 55 (3.4%) | 134 (9.7%) |
| 9:00 AM to 9:59 AM | 54 (3.4%) | 59 (4.3%) |
| 10:00 AM to 10:59 AM | 137 (8.5%) | 110 (7.9%) |
| 11:00 AM to 11:59 AM | 15 (0.9%) | 0 (0.0%) |
| 12:00 PM to 3:59 PM | 87 (5.4%) | 60 (4.3%) |
| 4:00 PM to 11:59 PM | 80 (5.0%) | 100 (7.2%) |
| Total | 1,604 (100.0%) | 1,386 (100.0%) |
Housing Occupancy in Eudora
Occupancy by Ownership in Eudora
Of the total 2,160 dwellings in Eudora, owner-occupied units account for 1,524 (70.6%), while renter-occupied units make up 636 (29.4%).
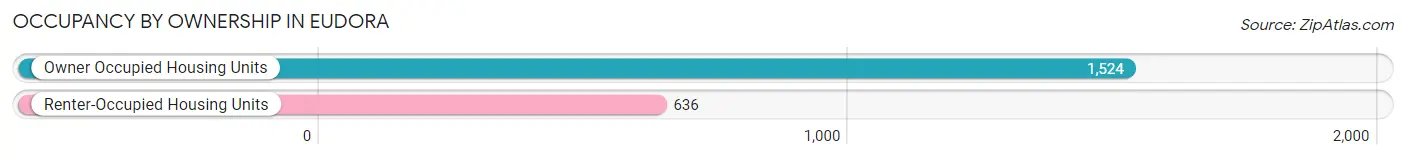
| Occupancy | # Housing Units | % Housing Units |
| Owner Occupied Housing Units | 1,524 | 70.6% |
| Renter-Occupied Housing Units | 636 | 29.4% |
| Total Occupied Housing Units | 2,160 | 100.0% |
Occupancy by Household Size in Eudora
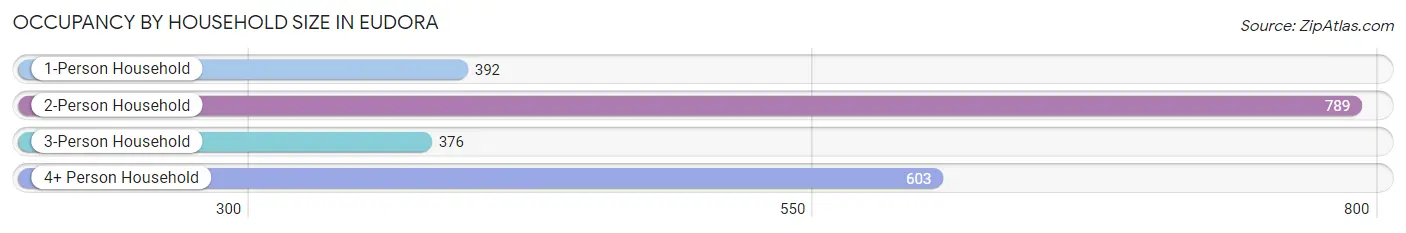
| Household Size | # Housing Units | % Housing Units |
| 1-Person Household | 392 | 18.1% |
| 2-Person Household | 789 | 36.5% |
| 3-Person Household | 376 | 17.4% |
| 4+ Person Household | 603 | 27.9% |
| Total Housing Units | 2,160 | 100.0% |
Occupancy by Ownership by Household Size in Eudora
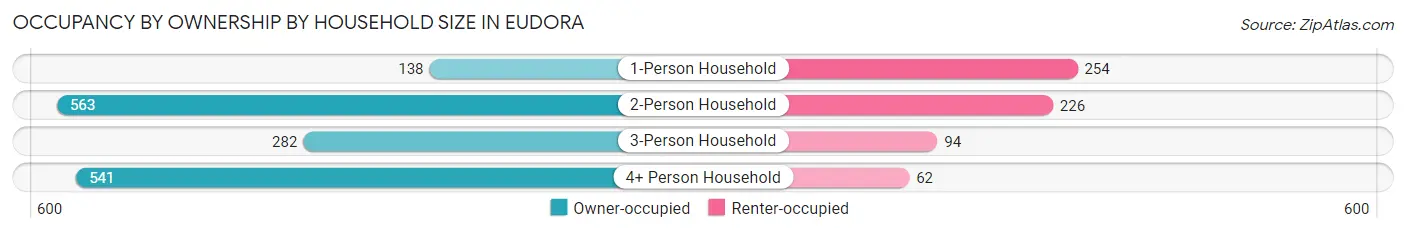
| Household Size | Owner-occupied | Renter-occupied |
| 1-Person Household | 138 (35.2%) | 254 (64.8%) |
| 2-Person Household | 563 (71.4%) | 226 (28.6%) |
| 3-Person Household | 282 (75.0%) | 94 (25.0%) |
| 4+ Person Household | 541 (89.7%) | 62 (10.3%) |
| Total Housing Units | 1,524 (70.6%) | 636 (29.4%) |
Occupancy by Educational Attainment in Eudora
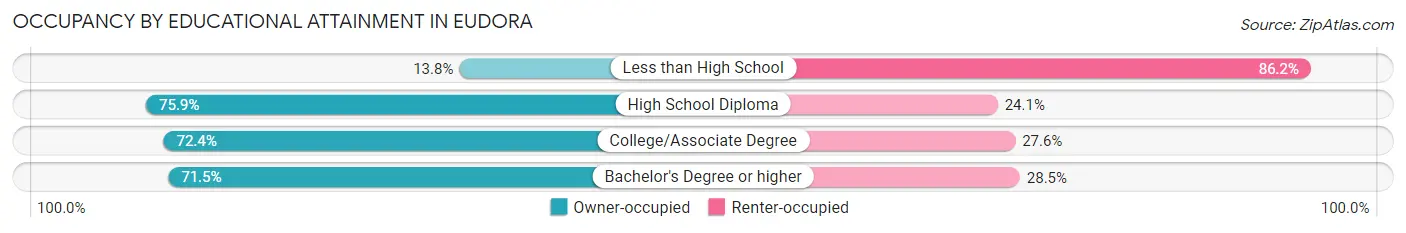
| Household Size | Owner-occupied | Renter-occupied |
| Less than High School | 13 (13.8%) | 81 (86.2%) |
| High School Diploma | 466 (75.9%) | 148 (24.1%) |
| College/Associate Degree | 523 (72.4%) | 199 (27.6%) |
| Bachelor's Degree or higher | 522 (71.5%) | 208 (28.5%) |
Occupancy by Age of Householder in Eudora
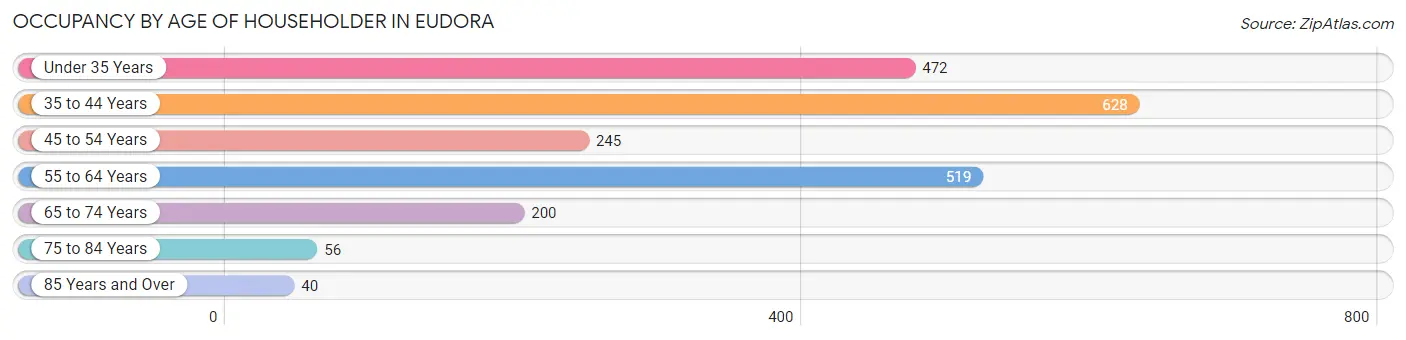
| Age Bracket | # Households | % Households |
| Under 35 Years | 472 | 21.8% |
| 35 to 44 Years | 628 | 29.1% |
| 45 to 54 Years | 245 | 11.3% |
| 55 to 64 Years | 519 | 24.0% |
| 65 to 74 Years | 200 | 9.3% |
| 75 to 84 Years | 56 | 2.6% |
| 85 Years and Over | 40 | 1.8% |
| Total | 2,160 | 100.0% |
Housing Finances in Eudora
Median Income by Occupancy in Eudora
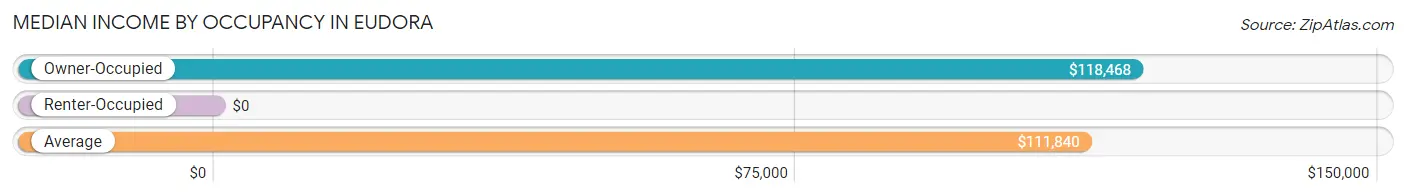
| Occupancy Type | # Households | Median Income |
| Owner-Occupied | 1,524 (70.6%) | $118,468 |
| Renter-Occupied | 636 (29.4%) | $0 |
| Average | 2,160 (100.0%) | $111,840 |
Occupancy by Householder Income Bracket in Eudora
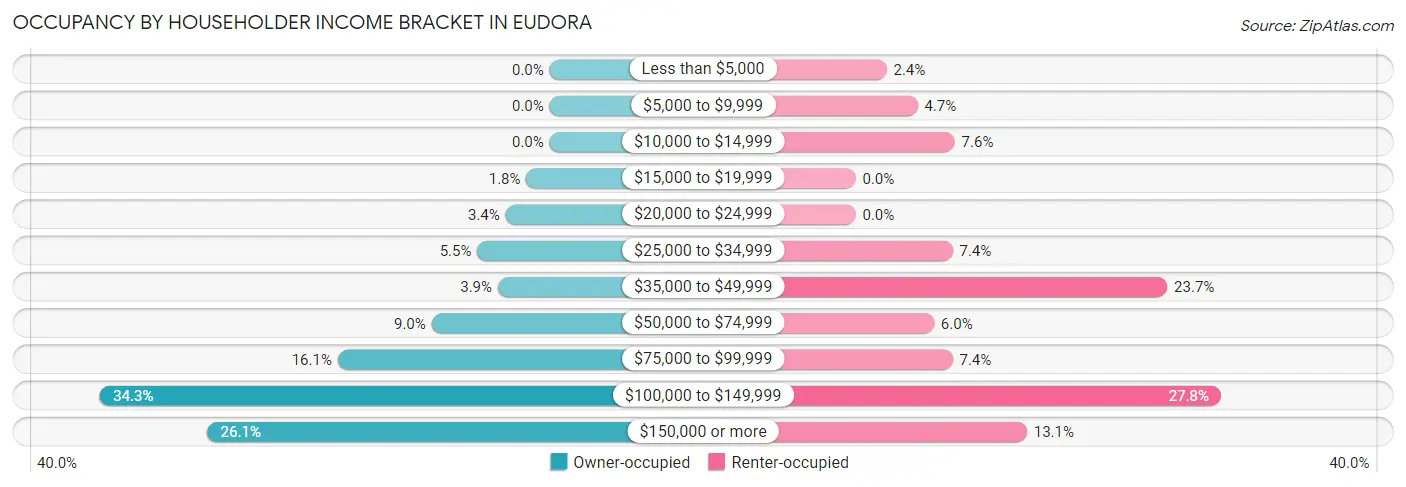
| Income Bracket | Owner-occupied | Renter-occupied |
| Less than $5,000 | 0 (0.0%) | 15 (2.4%) |
| $5,000 to $9,999 | 0 (0.0%) | 30 (4.7%) |
| $10,000 to $14,999 | 0 (0.0%) | 48 (7.5%) |
| $15,000 to $19,999 | 27 (1.8%) | 0 (0.0%) |
| $20,000 to $24,999 | 51 (3.4%) | 0 (0.0%) |
| $25,000 to $34,999 | 84 (5.5%) | 47 (7.4%) |
| $35,000 to $49,999 | 60 (3.9%) | 151 (23.7%) |
| $50,000 to $74,999 | 137 (9.0%) | 38 (6.0%) |
| $75,000 to $99,999 | 246 (16.1%) | 47 (7.4%) |
| $100,000 to $149,999 | 522 (34.3%) | 177 (27.8%) |
| $150,000 or more | 397 (26.1%) | 83 (13.1%) |
| Total | 1,524 (100.0%) | 636 (100.0%) |
Monthly Housing Cost Tiers in Eudora
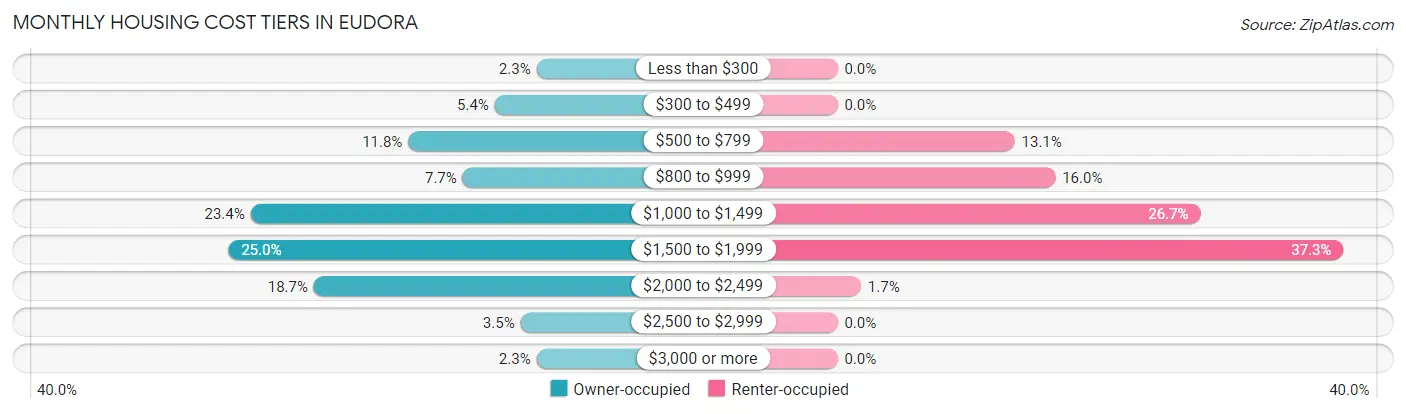
| Monthly Cost | Owner-occupied | Renter-occupied |
| Less than $300 | 35 (2.3%) | 0 (0.0%) |
| $300 to $499 | 82 (5.4%) | 0 (0.0%) |
| $500 to $799 | 179 (11.7%) | 83 (13.1%) |
| $800 to $999 | 118 (7.7%) | 102 (16.0%) |
| $1,000 to $1,499 | 356 (23.4%) | 170 (26.7%) |
| $1,500 to $1,999 | 381 (25.0%) | 237 (37.3%) |
| $2,000 to $2,499 | 285 (18.7%) | 11 (1.7%) |
| $2,500 to $2,999 | 53 (3.5%) | 0 (0.0%) |
| $3,000 or more | 35 (2.3%) | 0 (0.0%) |
| Total | 1,524 (100.0%) | 636 (100.0%) |
Physical Housing Characteristics in Eudora
Housing Structures in Eudora
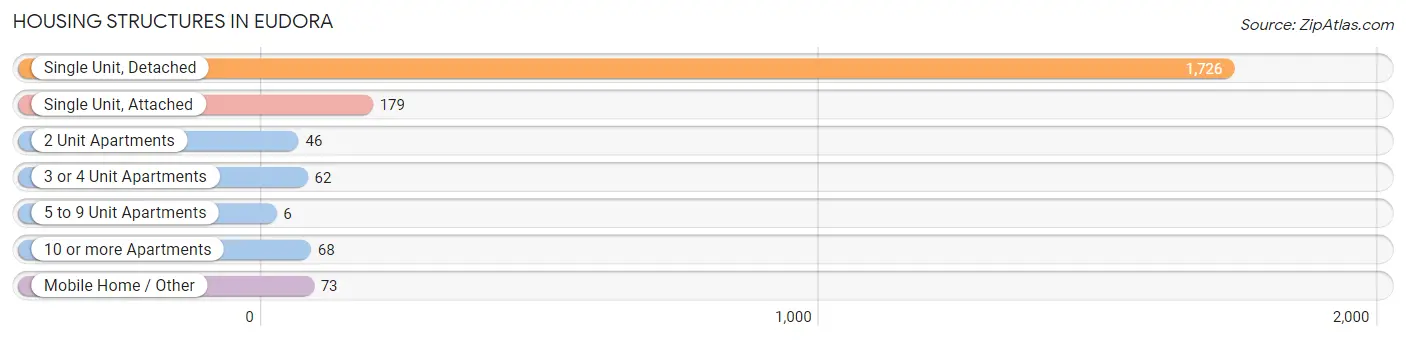
| Structure Type | # Housing Units | % Housing Units |
| Single Unit, Detached | 1,726 | 79.9% |
| Single Unit, Attached | 179 | 8.3% |
| 2 Unit Apartments | 46 | 2.1% |
| 3 or 4 Unit Apartments | 62 | 2.9% |
| 5 to 9 Unit Apartments | 6 | 0.3% |
| 10 or more Apartments | 68 | 3.2% |
| Mobile Home / Other | 73 | 3.4% |
| Total | 2,160 | 100.0% |
Housing Structures by Occupancy in Eudora
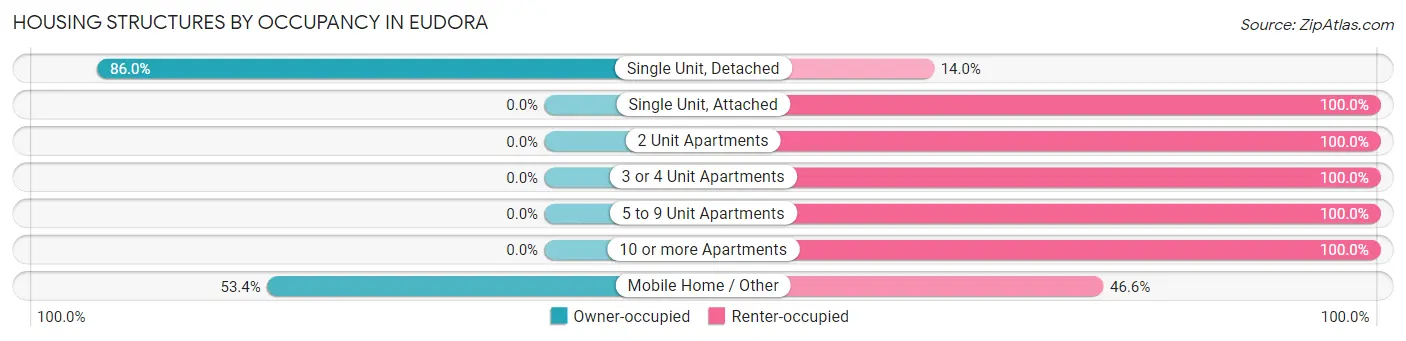
| Structure Type | Owner-occupied | Renter-occupied |
| Single Unit, Detached | 1,485 (86.0%) | 241 (14.0%) |
| Single Unit, Attached | 0 (0.0%) | 179 (100.0%) |
| 2 Unit Apartments | 0 (0.0%) | 46 (100.0%) |
| 3 or 4 Unit Apartments | 0 (0.0%) | 62 (100.0%) |
| 5 to 9 Unit Apartments | 0 (0.0%) | 6 (100.0%) |
| 10 or more Apartments | 0 (0.0%) | 68 (100.0%) |
| Mobile Home / Other | 39 (53.4%) | 34 (46.6%) |
| Total | 1,524 (70.6%) | 636 (29.4%) |
Housing Structures by Number of Rooms in Eudora
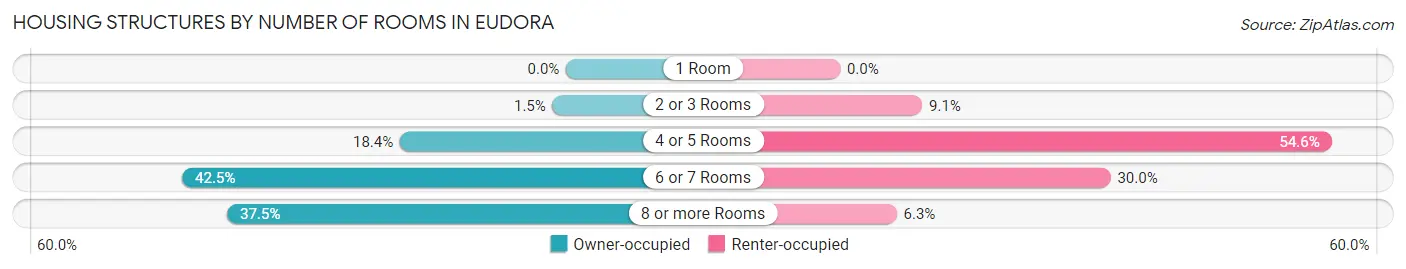
| Number of Rooms | Owner-occupied | Renter-occupied |
| 1 Room | 0 (0.0%) | 0 (0.0%) |
| 2 or 3 Rooms | 23 (1.5%) | 58 (9.1%) |
| 4 or 5 Rooms | 281 (18.4%) | 347 (54.6%) |
| 6 or 7 Rooms | 648 (42.5%) | 191 (30.0%) |
| 8 or more Rooms | 572 (37.5%) | 40 (6.3%) |
| Total | 1,524 (100.0%) | 636 (100.0%) |
Housing Structure by Heating Type in Eudora
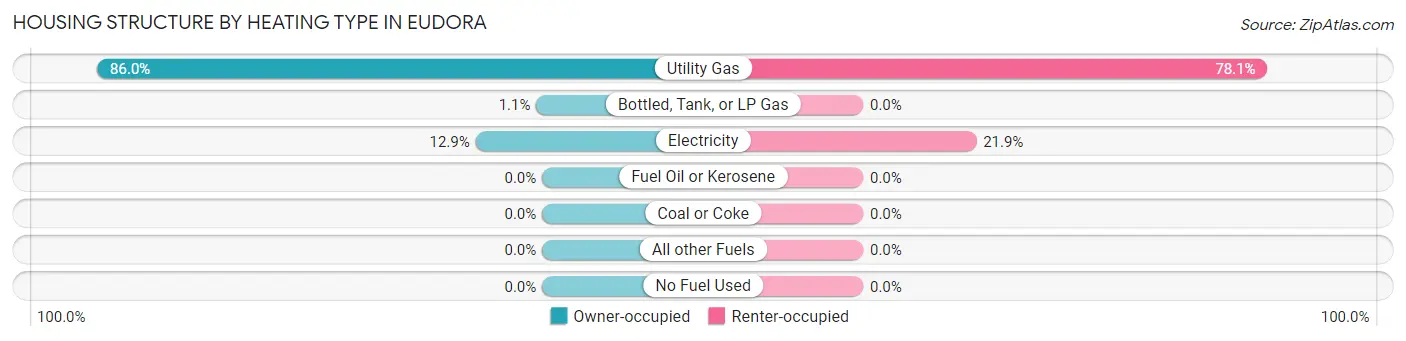
| Heating Type | Owner-occupied | Renter-occupied |
| Utility Gas | 1,311 (86.0%) | 497 (78.1%) |
| Bottled, Tank, or LP Gas | 17 (1.1%) | 0 (0.0%) |
| Electricity | 196 (12.9%) | 139 (21.9%) |
| Fuel Oil or Kerosene | 0 (0.0%) | 0 (0.0%) |
| Coal or Coke | 0 (0.0%) | 0 (0.0%) |
| All other Fuels | 0 (0.0%) | 0 (0.0%) |
| No Fuel Used | 0 (0.0%) | 0 (0.0%) |
| Total | 1,524 (100.0%) | 636 (100.0%) |
Household Vehicle Usage in Eudora
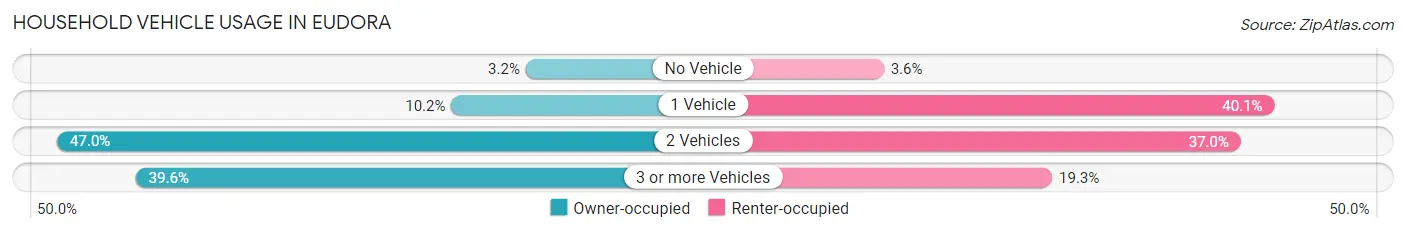
| Vehicles per Household | Owner-occupied | Renter-occupied |
| No Vehicle | 49 (3.2%) | 23 (3.6%) |
| 1 Vehicle | 155 (10.2%) | 255 (40.1%) |
| 2 Vehicles | 716 (47.0%) | 235 (36.9%) |
| 3 or more Vehicles | 604 (39.6%) | 123 (19.3%) |
| Total | 1,524 (100.0%) | 636 (100.0%) |
Real Estate & Mortgages in Eudora
Real Estate and Mortgage Overview in Eudora
| Characteristic | Without Mortgage | With Mortgage |
| Housing Units | 308 | 1,216 |
| Median Property Value | $184,600 | $233,800 |
| Median Household Income | $51,471 | $383 |
| Monthly Housing Costs | $567 | $35 |
| Real Estate Taxes | $2,543 | $28 |
Property Value by Mortgage Status in Eudora
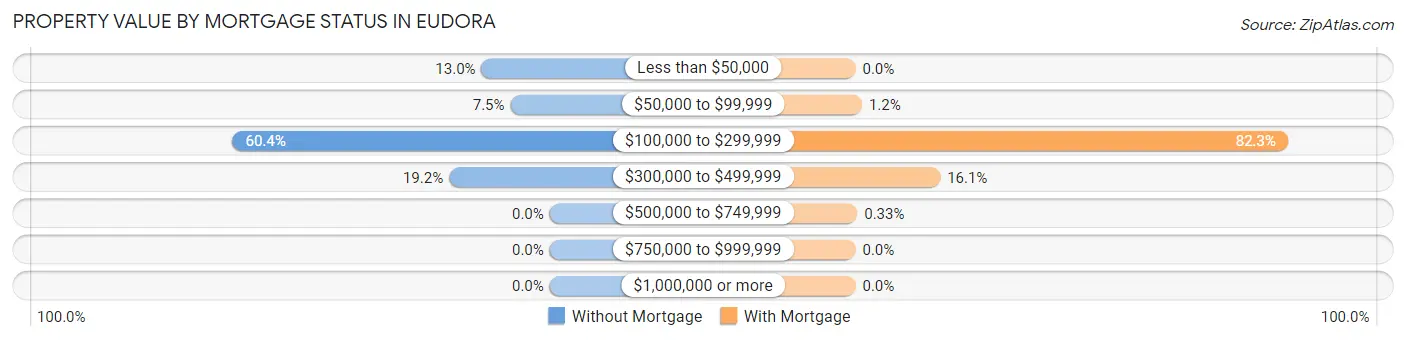
| Property Value | Without Mortgage | With Mortgage |
| Less than $50,000 | 40 (13.0%) | 0 (0.0%) |
| $50,000 to $99,999 | 23 (7.5%) | 15 (1.2%) |
| $100,000 to $299,999 | 186 (60.4%) | 1,001 (82.3%) |
| $300,000 to $499,999 | 59 (19.2%) | 196 (16.1%) |
| $500,000 to $749,999 | 0 (0.0%) | 4 (0.3%) |
| $750,000 to $999,999 | 0 (0.0%) | 0 (0.0%) |
| $1,000,000 or more | 0 (0.0%) | 0 (0.0%) |
| Total | 308 (100.0%) | 1,216 (100.0%) |
Household Income by Mortgage Status in Eudora
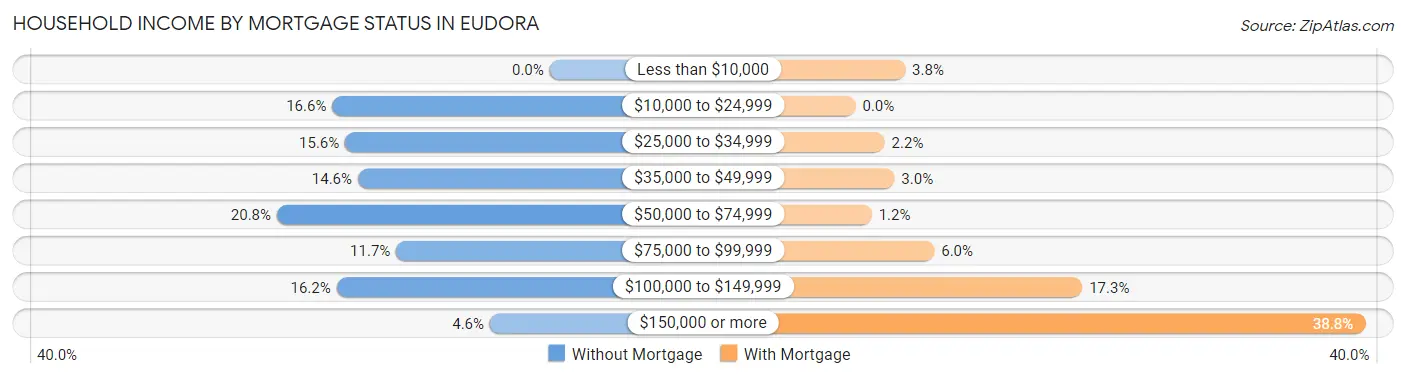
| Household Income | Without Mortgage | With Mortgage |
| Less than $10,000 | 0 (0.0%) | 46 (3.8%) |
| $10,000 to $24,999 | 51 (16.6%) | 0 (0.0%) |
| $25,000 to $34,999 | 48 (15.6%) | 27 (2.2%) |
| $35,000 to $49,999 | 45 (14.6%) | 36 (3.0%) |
| $50,000 to $74,999 | 64 (20.8%) | 15 (1.2%) |
| $75,000 to $99,999 | 36 (11.7%) | 73 (6.0%) |
| $100,000 to $149,999 | 50 (16.2%) | 210 (17.3%) |
| $150,000 or more | 14 (4.5%) | 472 (38.8%) |
| Total | 308 (100.0%) | 1,216 (100.0%) |
Property Value to Household Income Ratio in Eudora
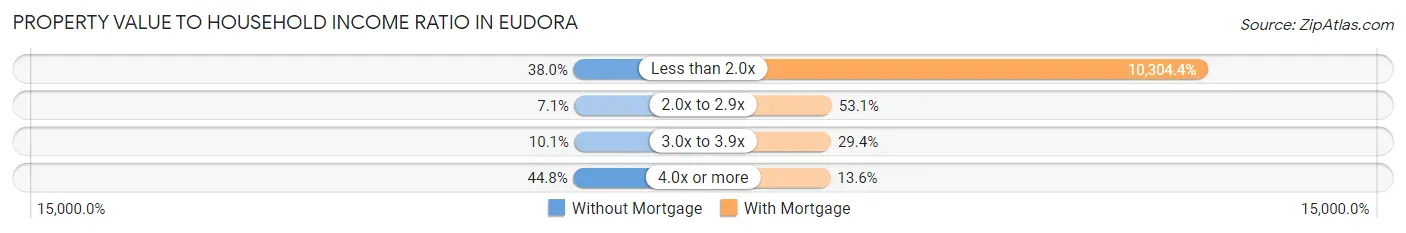
| Value-to-Income Ratio | Without Mortgage | With Mortgage |
| Less than 2.0x | 117 (38.0%) | 125,302 (10,304.4%) |
| 2.0x to 2.9x | 22 (7.1%) | 646 (53.1%) |
| 3.0x to 3.9x | 31 (10.1%) | 357 (29.4%) |
| 4.0x or more | 138 (44.8%) | 165 (13.6%) |
| Total | 308 (100.0%) | 1,216 (100.0%) |
Real Estate Taxes by Mortgage Status in Eudora
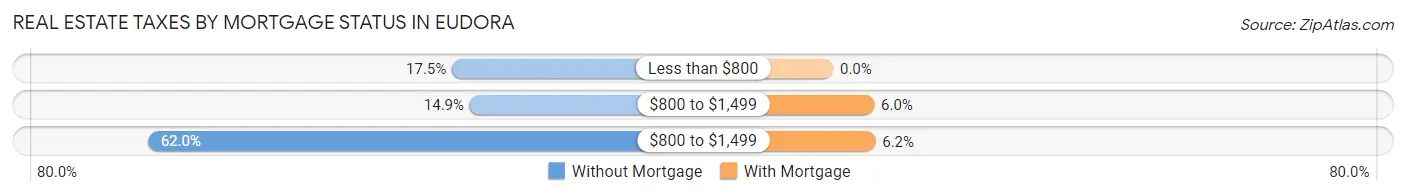
| Property Taxes | Without Mortgage | With Mortgage |
| Less than $800 | 54 (17.5%) | 0 (0.0%) |
| $800 to $1,499 | 46 (14.9%) | 73 (6.0%) |
| $800 to $1,499 | 191 (62.0%) | 75 (6.2%) |
| Total | 308 (100.0%) | 1,216 (100.0%) |
Health & Disability in Eudora
Health Insurance Coverage by Age in Eudora
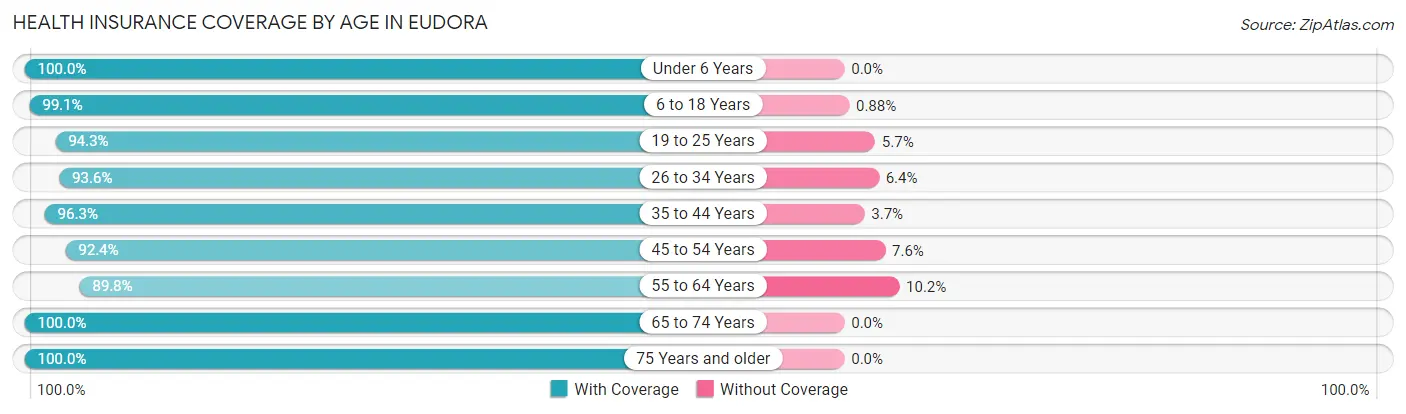
| Age Bracket | With Coverage | Without Coverage |
| Under 6 Years | 455 (100.0%) | 0 (0.0%) |
| 6 to 18 Years | 1,019 (99.1%) | 9 (0.9%) |
| 19 to 25 Years | 429 (94.3%) | 26 (5.7%) |
| 26 to 34 Years | 773 (93.6%) | 53 (6.4%) |
| 35 to 44 Years | 926 (96.3%) | 36 (3.7%) |
| 45 to 54 Years | 522 (92.4%) | 43 (7.6%) |
| 55 to 64 Years | 1,063 (89.8%) | 121 (10.2%) |
| 65 to 74 Years | 337 (100.0%) | 0 (0.0%) |
| 75 Years and older | 149 (100.0%) | 0 (0.0%) |
| Total | 5,673 (95.2%) | 288 (4.8%) |
Health Insurance Coverage by Citizenship Status in Eudora
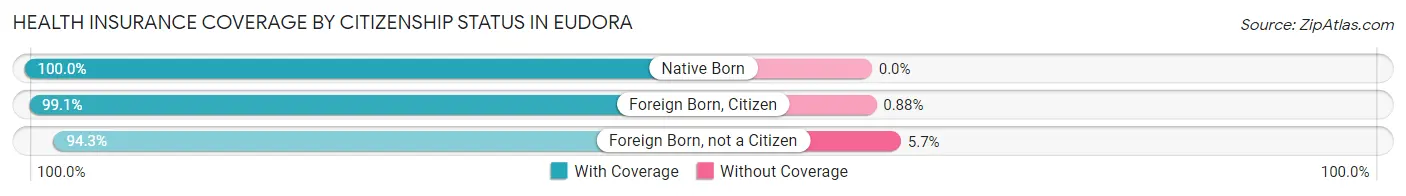
| Citizenship Status | With Coverage | Without Coverage |
| Native Born | 455 (100.0%) | 0 (0.0%) |
| Foreign Born, Citizen | 1,019 (99.1%) | 9 (0.9%) |
| Foreign Born, not a Citizen | 429 (94.3%) | 26 (5.7%) |
Health Insurance Coverage by Household Income in Eudora
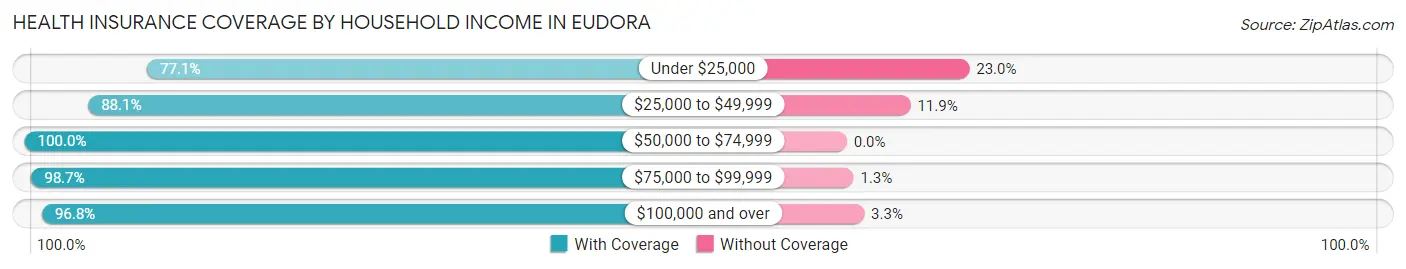
| Household Income | With Coverage | Without Coverage |
| Under $25,000 | 282 (77.0%) | 84 (23.0%) |
| $25,000 to $49,999 | 561 (88.1%) | 76 (11.9%) |
| $50,000 to $74,999 | 440 (100.0%) | 0 (0.0%) |
| $75,000 to $99,999 | 941 (98.7%) | 12 (1.3%) |
| $100,000 and over | 3,449 (96.8%) | 116 (3.3%) |
Public vs Private Health Insurance Coverage by Age in Eudora
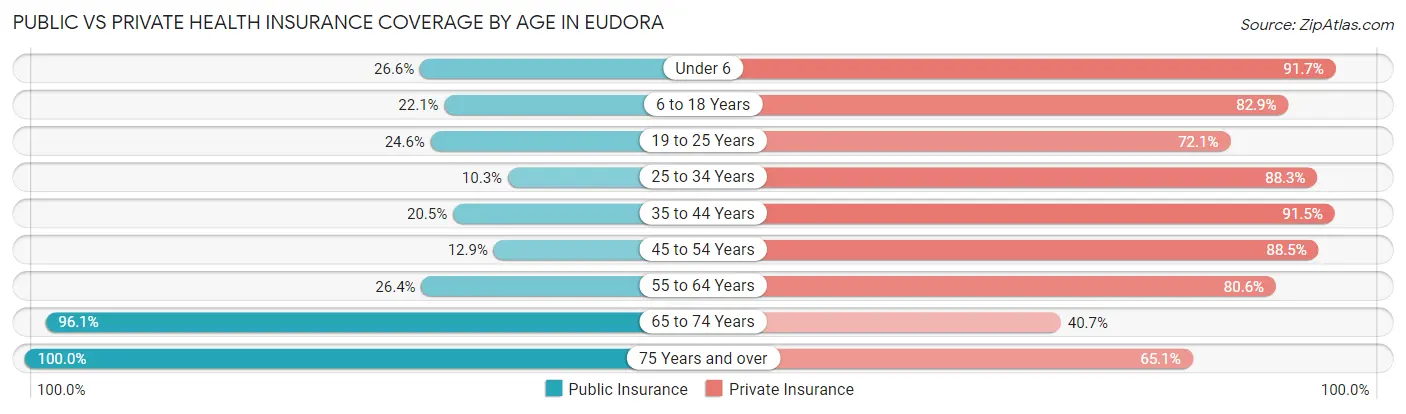
| Age Bracket | Public Insurance | Private Insurance |
| Under 6 | 121 (26.6%) | 417 (91.6%) |
| 6 to 18 Years | 227 (22.1%) | 852 (82.9%) |
| 19 to 25 Years | 112 (24.6%) | 328 (72.1%) |
| 25 to 34 Years | 85 (10.3%) | 729 (88.3%) |
| 35 to 44 Years | 197 (20.5%) | 880 (91.5%) |
| 45 to 54 Years | 73 (12.9%) | 500 (88.5%) |
| 55 to 64 Years | 312 (26.4%) | 954 (80.6%) |
| 65 to 74 Years | 324 (96.1%) | 137 (40.6%) |
| 75 Years and over | 149 (100.0%) | 97 (65.1%) |
| Total | 1,600 (26.8%) | 4,894 (82.1%) |
Disability Status by Sex by Age in Eudora
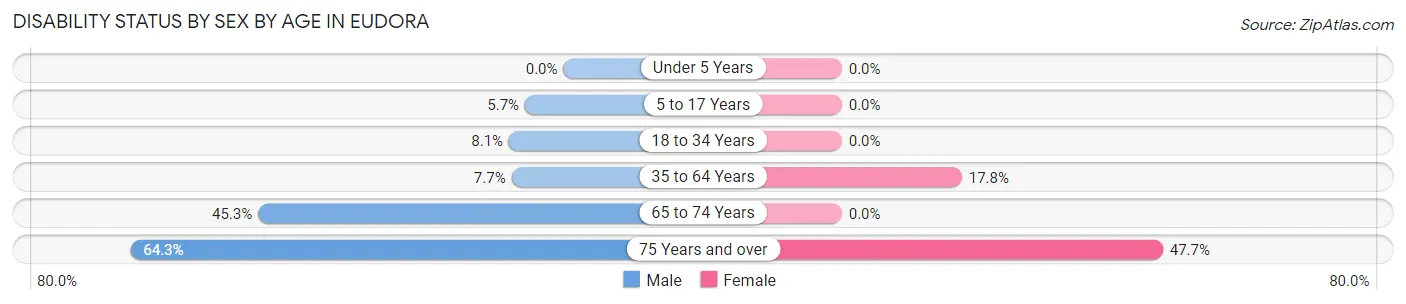
| Age Bracket | Male | Female |
| Under 5 Years | 0 (0.0%) | 0 (0.0%) |
| 5 to 17 Years | 39 (5.7%) | 0 (0.0%) |
| 18 to 34 Years | 50 (8.1%) | 0 (0.0%) |
| 35 to 64 Years | 112 (7.7%) | 224 (17.8%) |
| 65 to 74 Years | 112 (45.3%) | 0 (0.0%) |
| 75 Years and over | 27 (64.3%) | 51 (47.7%) |
Disability Class by Sex by Age in Eudora
Disability Class: Hearing Difficulty
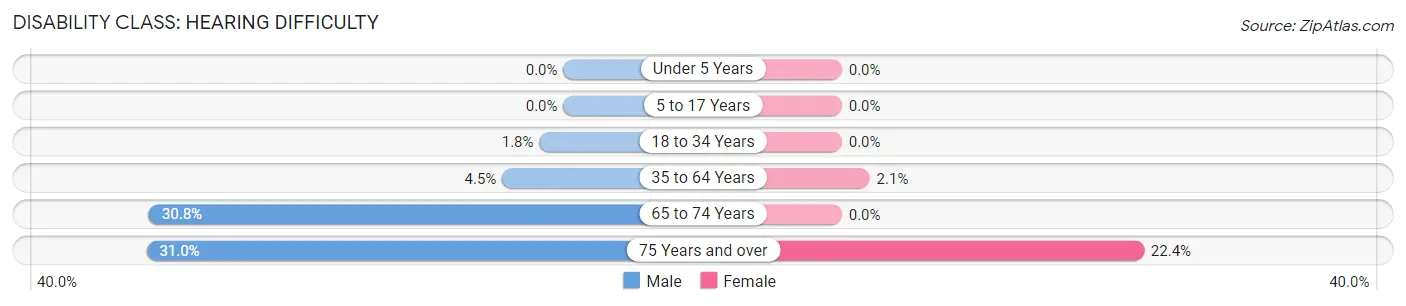
| Age Bracket | Male | Female |
| Under 5 Years | 0 (0.0%) | 0 (0.0%) |
| 5 to 17 Years | 0 (0.0%) | 0 (0.0%) |
| 18 to 34 Years | 11 (1.8%) | 0 (0.0%) |
| 35 to 64 Years | 66 (4.5%) | 26 (2.1%) |
| 65 to 74 Years | 76 (30.8%) | 0 (0.0%) |
| 75 Years and over | 13 (30.9%) | 24 (22.4%) |
Disability Class: Vision Difficulty
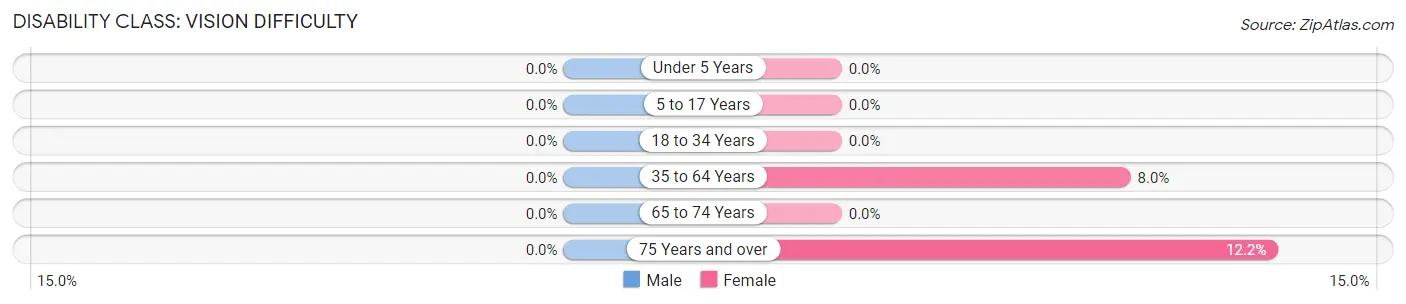
| Age Bracket | Male | Female |
| Under 5 Years | 0 (0.0%) | 0 (0.0%) |
| 5 to 17 Years | 0 (0.0%) | 0 (0.0%) |
| 18 to 34 Years | 0 (0.0%) | 0 (0.0%) |
| 35 to 64 Years | 0 (0.0%) | 101 (8.0%) |
| 65 to 74 Years | 0 (0.0%) | 0 (0.0%) |
| 75 Years and over | 0 (0.0%) | 13 (12.1%) |
Disability Class: Cognitive Difficulty
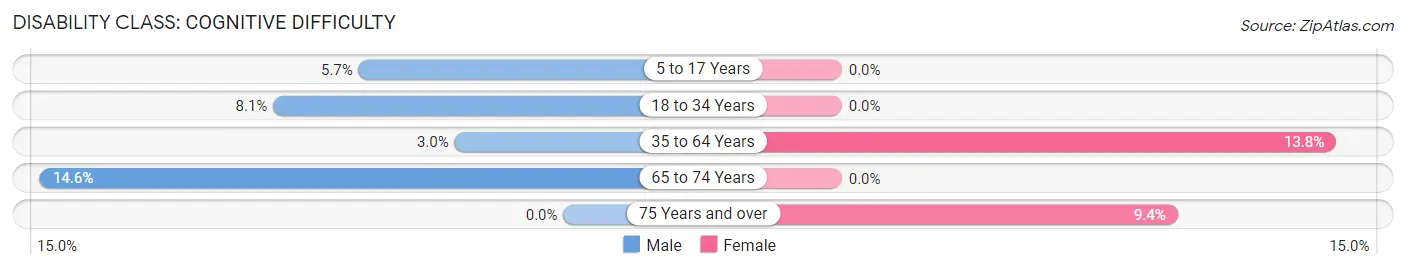
| Age Bracket | Male | Female |
| 5 to 17 Years | 39 (5.7%) | 0 (0.0%) |
| 18 to 34 Years | 50 (8.1%) | 0 (0.0%) |
| 35 to 64 Years | 44 (3.0%) | 173 (13.8%) |
| 65 to 74 Years | 36 (14.6%) | 0 (0.0%) |
| 75 Years and over | 0 (0.0%) | 10 (9.3%) |
Disability Class: Ambulatory Difficulty
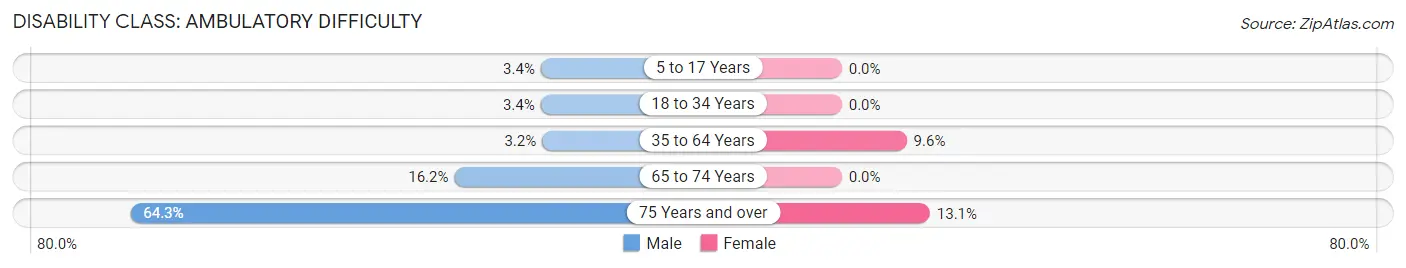
| Age Bracket | Male | Female |
| 5 to 17 Years | 23 (3.4%) | 0 (0.0%) |
| 18 to 34 Years | 21 (3.4%) | 0 (0.0%) |
| 35 to 64 Years | 46 (3.2%) | 121 (9.6%) |
| 65 to 74 Years | 40 (16.2%) | 0 (0.0%) |
| 75 Years and over | 27 (64.3%) | 14 (13.1%) |
Disability Class: Self-Care Difficulty
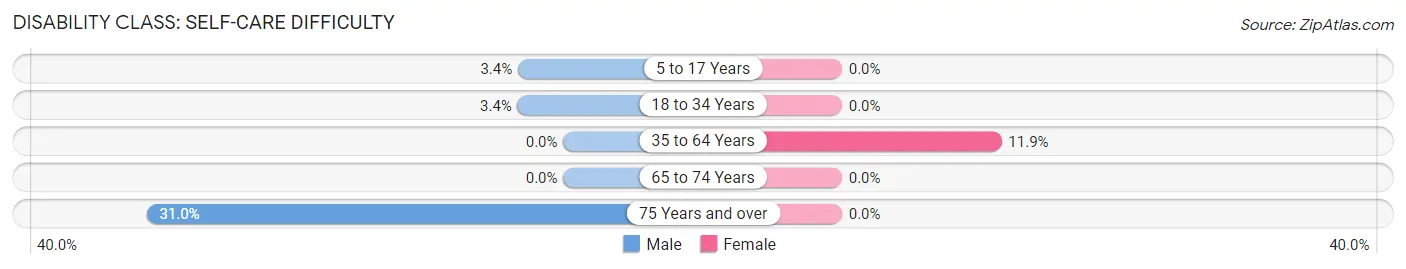
| Age Bracket | Male | Female |
| 5 to 17 Years | 23 (3.4%) | 0 (0.0%) |
| 18 to 34 Years | 21 (3.4%) | 0 (0.0%) |
| 35 to 64 Years | 0 (0.0%) | 149 (11.8%) |
| 65 to 74 Years | 0 (0.0%) | 0 (0.0%) |
| 75 Years and over | 13 (30.9%) | 0 (0.0%) |
Technology Access in Eudora
Computing Device Access in Eudora
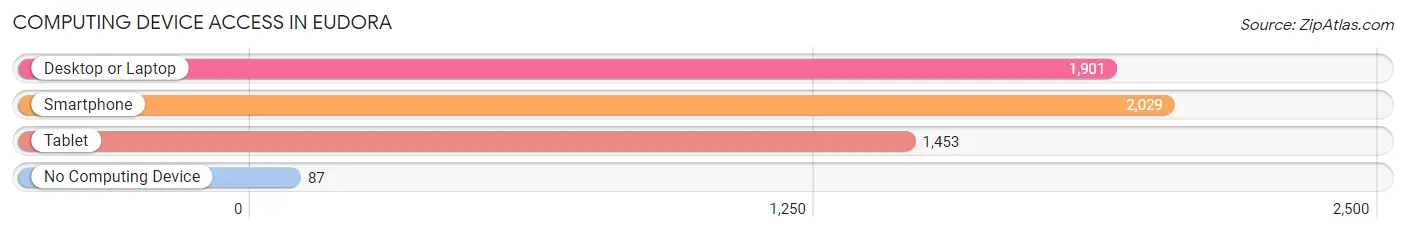
| Device Type | # Households | % Households |
| Desktop or Laptop | 1,901 | 88.0% |
| Smartphone | 2,029 | 93.9% |
| Tablet | 1,453 | 67.3% |
| No Computing Device | 87 | 4.0% |
| Total | 2,160 | 100.0% |
Internet Access in Eudora
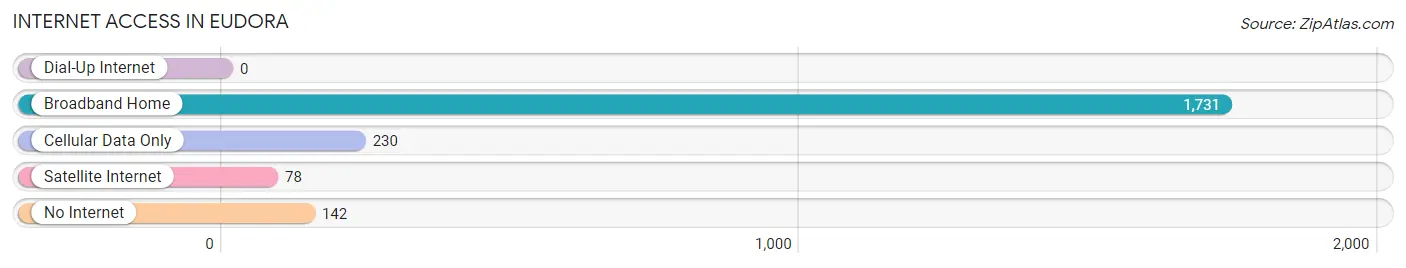
| Internet Type | # Households | % Households |
| Dial-Up Internet | 0 | 0.0% |
| Broadband Home | 1,731 | 80.1% |
| Cellular Data Only | 230 | 10.6% |
| Satellite Internet | 78 | 3.6% |
| No Internet | 142 | 6.6% |
| Total | 2,160 | 100.0% |
Eudora Summary
Eudora, Kansas is a small city located in Douglas County, Kansas. It is situated along the Wakarusa River, about 20 miles southwest of Lawrence and about 40 miles east of Topeka. The city was founded in 1857 and was named after Eudora, the daughter of a local settler. As of the 2010 census, the population of Eudora was 6,136.
Geography
Eudora is located at 38°52'45" North, 95°10'45" West (38.87917, -95.17917). According to the United States Census Bureau, the city has a total area of 4.2 square miles, all of it land.
The city is located in the Wakarusa Valley, which is part of the larger Kansas River Valley. The Wakarusa River runs through the city, and the city is surrounded by rolling hills and farmland.
Economy
Eudora is a small city with a diverse economy. The city is home to several small businesses, including a grocery store, a hardware store, a pharmacy, and a variety of restaurants. The city also has a number of manufacturing and industrial businesses, including a plastics factory, a printing company, and a metal fabrication plant.
The city is also home to a number of educational institutions, including the University of Kansas, Haskell Indian Nations University, and Baker University.
Demographics
As of the 2010 census, there were 6,136 people, 2,521 households, and 1,619 families residing in the city. The population density was 1,461.2 people per square mile. The racial makeup of the city was 87.2% White, 5.2% African American, 0.7% Native American, 0.7% Asian, 0.1% Pacific Islander, 3.2% from other races, and 2.9% from two or more races. Hispanic or Latino of any race were 6.7% of the population.
There were 2,521 households, out of which 32.2% had children under the age of 18 living with them, 46.2% were married couples living together, 13.7% had a female householder with no husband present, and 35.2% were non-families. 29.2% of all households were made up of individuals, and 11.2% had someone living alone who was 65 years of age or older. The average household size was 2.41 and the average family size was 2.97.
In the city, the population was spread out, with 25.2% under the age of 18, 8.2% from 18 to 24, 28.7% from 25 to 44, 22.7% from 45 to 64, and 15.2% who were 65 years of age or older. The median age was 36 years. For every 100 females, there were 91.2 males. For every 100 females age 18 and over, there were 87.2 males.
The median income for a household in the city was $41,944, and the median income for a family was $50,938. Males had a median income of $36,919 versus $26,945 for females. The per capita income for the city was $20,945. About 6.2% of families and 8.7% of the population were below the poverty line, including 10.3% of those under age 18 and 8.2% of those age 65 or over.
Common Questions
What is Per Capita Income in Eudora?
Per Capita income in Eudora is $39,894.
What is the Median Family Income in Eudora?
Median Family Income in Eudora is $115,882.
What is the Median Household income in Eudora?
Median Household Income in Eudora is $111,840.
What is Income or Wage Gap in Eudora?
Income or Wage Gap in Eudora is 32.0%.
Women in Eudora earn 68.0 cents for every dollar earned by a man.
What is Inequality or Gini Index in Eudora?
Inequality or Gini Index in Eudora is 0.34.
What is the Total Population of Eudora?
Total Population of Eudora is 6,025.
What is the Total Male Population of Eudora?
Total Male Population of Eudora is 3,248.
What is the Total Female Population of Eudora?
Total Female Population of Eudora is 2,777.
What is the Ratio of Males per 100 Females in Eudora?
There are 116.96 Males per 100 Females in Eudora.
What is the Ratio of Females per 100 Males in Eudora?
There are 85.50 Females per 100 Males in Eudora.
What is the Median Population Age in Eudora?
Median Population Age in Eudora is 37.6 Years.
What is the Average Family Size in Eudora
Average Family Size in Eudora is 3.1 People.
What is the Average Household Size in Eudora
Average Household Size in Eudora is 2.8 People.
How Large is the Labor Force in Eudora?
There are 3,573 People in the Labor Forcein in Eudora.
What is the Percentage of People in the Labor Force in Eudora?
73.5% of People are in the Labor Force in Eudora.
What is the Unemployment Rate in Eudora?
Unemployment Rate in Eudora is 2.3%.