Bonner Springs, KS Map & Demographics
Bonner Springs Map
Bonner Springs Overview
$35,284
PER CAPITA INCOME
$95,388
AVG FAMILY INCOME
$82,208
AVG HOUSEHOLD INCOME
29.5%
WAGE / INCOME GAP [ % ]
70.5¢/ $1
WAGE / INCOME GAP [ $ ]
$9,207
FAMILY INCOME DEFICIT
0.38
INEQUALITY / GINI INDEX
7,770
TOTAL POPULATION
3,801
MALE POPULATION
3,969
FEMALE POPULATION
95.77
MALES / 100 FEMALES
104.42
FEMALES / 100 MALES
36.6
MEDIAN AGE
3.3
AVG FAMILY SIZE
2.8
AVG HOUSEHOLD SIZE
3,806
LABOR FORCE [ PEOPLE ]
67.2%
PERCENT IN LABOR FORCE
2.5%
UNEMPLOYMENT RATE
Bonner Springs Zip Codes
Bonner Springs Area Codes
Income in Bonner Springs
Income Overview in Bonner Springs
Per Capita Income in Bonner Springs is $35,284, while median incomes of families and households are $95,388 and $82,208 respectively.
| Characteristic | Number | Measure |
| Per Capita Income | 7,770 | $35,284 |
| Median Family Income | 1,987 | $95,388 |
| Mean Family Income | 1,987 | $112,483 |
| Median Household Income | 2,730 | $82,208 |
| Mean Household Income | 2,730 | $97,777 |
| Income Deficit | 1,987 | $9,207 |
| Wage / Income Gap (%) | 7,770 | 29.54% |
| Wage / Income Gap ($) | 7,770 | 70.46¢ per $1 |
| Gini / Inequality Index | 7,770 | 0.38 |
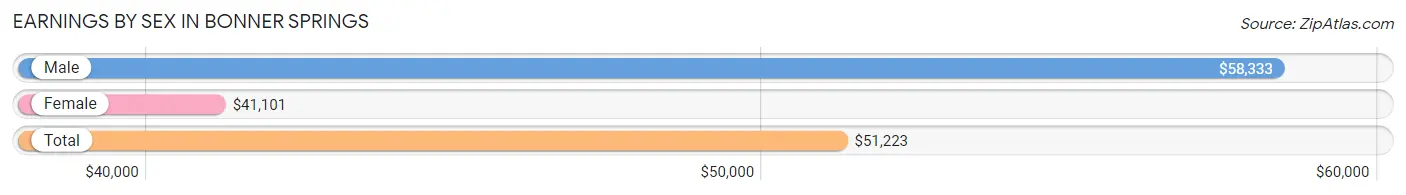
Earnings by Sex in Bonner Springs
Average Earnings in Bonner Springs are $51,223, $58,333 for men and $41,101 for women, a difference of 29.5%.
| Sex | Number | Average Earnings |
| Male | 1,922 (49.3%) | $58,333 |
| Female | 1,975 (50.7%) | $41,101 |
| Total | 3,897 (100.0%) | $51,223 |
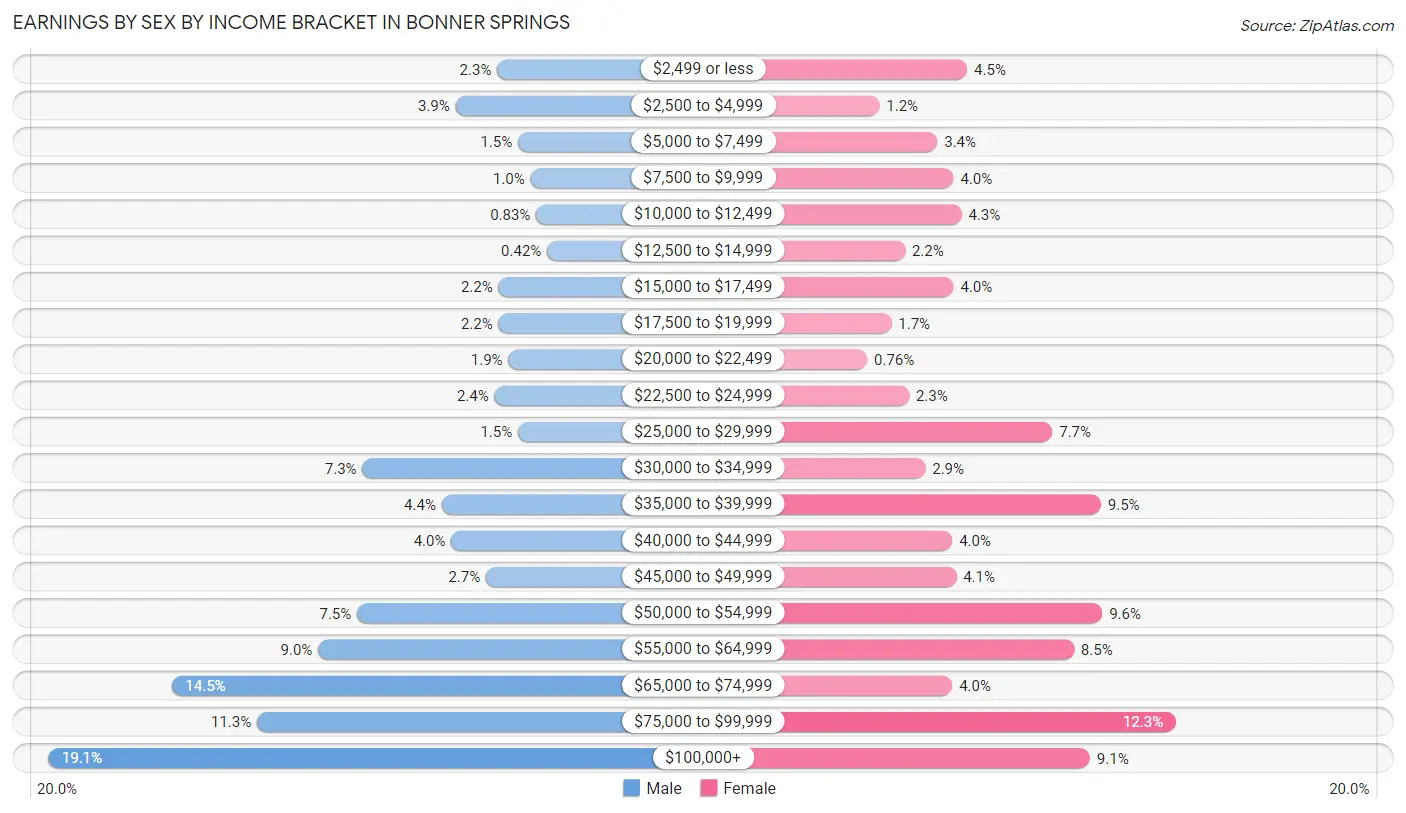
Earnings by Sex by Income Bracket in Bonner Springs
The most common earnings brackets in Bonner Springs are $100,000+ for men (367 | 19.1%) and $75,000 to $99,999 for women (243 | 12.3%).
| Income | Male | Female |
| $2,499 or less | 44 (2.3%) | 89 (4.5%) |
| $2,500 to $4,999 | 74 (3.8%) | 24 (1.2%) |
| $5,000 to $7,499 | 29 (1.5%) | 67 (3.4%) |
| $7,500 to $9,999 | 20 (1.0%) | 79 (4.0%) |
| $10,000 to $12,499 | 16 (0.8%) | 85 (4.3%) |
| $12,500 to $14,999 | 8 (0.4%) | 43 (2.2%) |
| $15,000 to $17,499 | 43 (2.2%) | 79 (4.0%) |
| $17,500 to $19,999 | 43 (2.2%) | 33 (1.7%) |
| $20,000 to $22,499 | 36 (1.9%) | 15 (0.8%) |
| $22,500 to $24,999 | 46 (2.4%) | 46 (2.3%) |
| $25,000 to $29,999 | 29 (1.5%) | 152 (7.7%) |
| $30,000 to $34,999 | 141 (7.3%) | 58 (2.9%) |
| $35,000 to $39,999 | 84 (4.4%) | 188 (9.5%) |
| $40,000 to $44,999 | 77 (4.0%) | 78 (4.0%) |
| $45,000 to $49,999 | 52 (2.7%) | 81 (4.1%) |
| $50,000 to $54,999 | 145 (7.5%) | 189 (9.6%) |
| $55,000 to $64,999 | 173 (9.0%) | 168 (8.5%) |
| $65,000 to $74,999 | 278 (14.5%) | 78 (4.0%) |
| $75,000 to $99,999 | 217 (11.3%) | 243 (12.3%) |
| $100,000+ | 367 (19.1%) | 180 (9.1%) |
| Total | 1,922 (100.0%) | 1,975 (100.0%) |
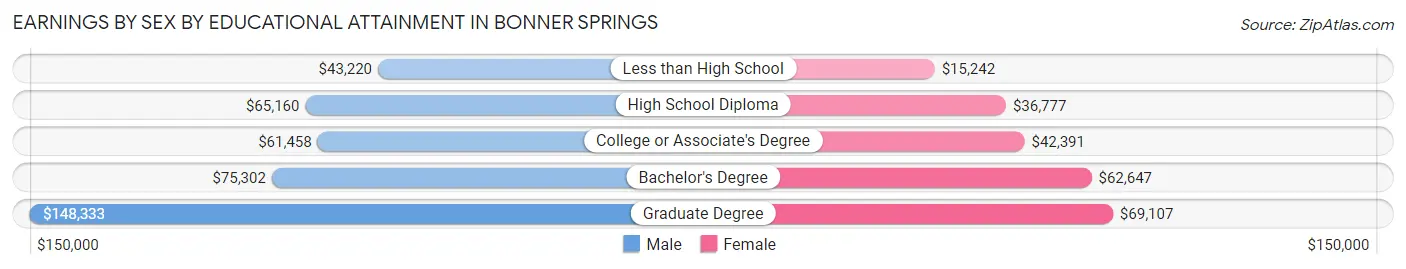
Earnings by Sex by Educational Attainment in Bonner Springs
Average earnings in Bonner Springs are $65,281 for men and $49,375 for women, a difference of 24.4%. Men with an educational attainment of graduate degree enjoy the highest average annual earnings of $148,333, while those with less than high school education earn the least with $43,220. Women with an educational attainment of graduate degree earn the most with the average annual earnings of $69,107, while those with less than high school education have the smallest earnings of $15,242.
| Educational Attainment | Male Income | Female Income |
| Less than High School | $43,220 | $15,242 |
| High School Diploma | $65,160 | $36,777 |
| College or Associate's Degree | $61,458 | $42,391 |
| Bachelor's Degree | $75,302 | $62,647 |
| Graduate Degree | $148,333 | $69,107 |
| Total | $65,281 | $49,375 |
Family Income in Bonner Springs
Family Income Brackets in Bonner Springs
According to the Bonner Springs family income data, there are 465 families falling into the $75,000 to $99,999 income range, which is the most common income bracket and makes up 23.4% of all families. Conversely, the $10,000 to $14,999 income bracket is the least frequent group with only 14 families (0.7%) belonging to this category.
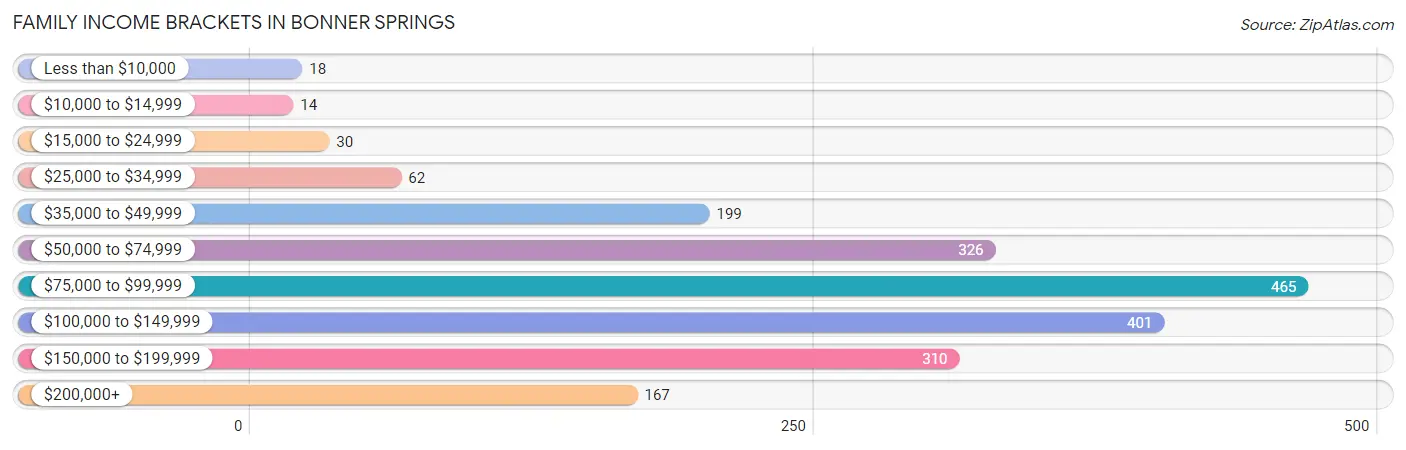
| Income Bracket | # Families | % Families |
| Less than $10,000 | 18 | 0.9% |
| $10,000 to $14,999 | 14 | 0.7% |
| $15,000 to $24,999 | 30 | 1.5% |
| $25,000 to $34,999 | 62 | 3.1% |
| $35,000 to $49,999 | 199 | 10.0% |
| $50,000 to $74,999 | 326 | 16.4% |
| $75,000 to $99,999 | 465 | 23.4% |
| $100,000 to $149,999 | 401 | 20.2% |
| $150,000 to $199,999 | 310 | 15.6% |
| $200,000+ | 167 | 8.4% |
Family Income by Famaliy Size in Bonner Springs
4-person families (352 | 17.7%) account for the highest median family income in Bonner Springs with $105,547 per family, while 2-person families (981 | 49.4%) have the highest median income of $45,838 per family member.
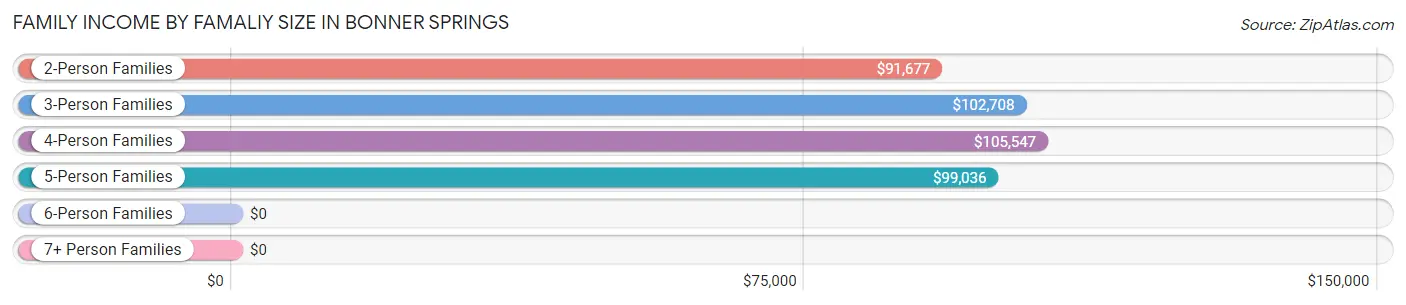
| Income Bracket | # Families | Median Income |
| 2-Person Families | 981 (49.4%) | $91,677 |
| 3-Person Families | 319 (16.1%) | $102,708 |
| 4-Person Families | 352 (17.7%) | $105,547 |
| 5-Person Families | 274 (13.8%) | $99,036 |
| 6-Person Families | 28 (1.4%) | $0 |
| 7+ Person Families | 33 (1.7%) | $0 |
| Total | 1,987 (100.0%) | $95,388 |
Family Income by Number of Earners in Bonner Springs
The median family income in Bonner Springs is $95,388, with families comprising 3+ earners (226) having the highest median family income of $139,712, while families with no earners (173) have the lowest median family income of $62,760, accounting for 11.4% and 8.7% of families, respectively.
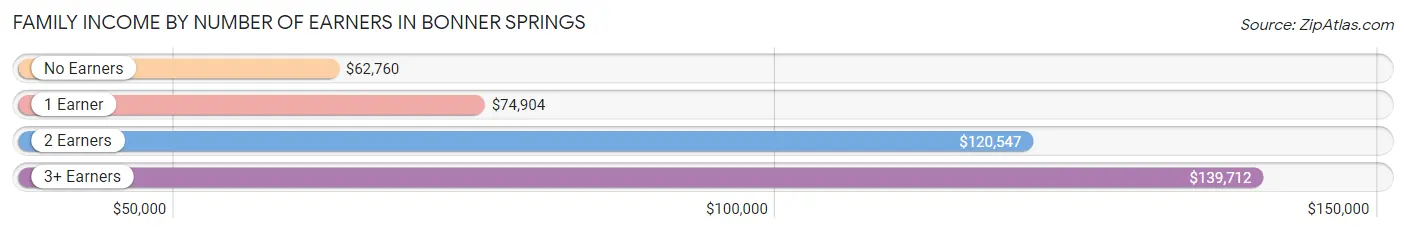
| Number of Earners | # Families | Median Income |
| No Earners | 173 (8.7%) | $62,760 |
| 1 Earner | 729 (36.7%) | $74,904 |
| 2 Earners | 859 (43.2%) | $120,547 |
| 3+ Earners | 226 (11.4%) | $139,712 |
| Total | 1,987 (100.0%) | $95,388 |
Household Income in Bonner Springs
Household Income Brackets in Bonner Springs
With 532 households falling in the category, the $75,000 to $99,999 income range is the most frequent in Bonner Springs, accounting for 19.5% of all households. In contrast, only 41 households (1.5%) fall into the $10,000 to $14,999 income bracket, making it the least populous group.
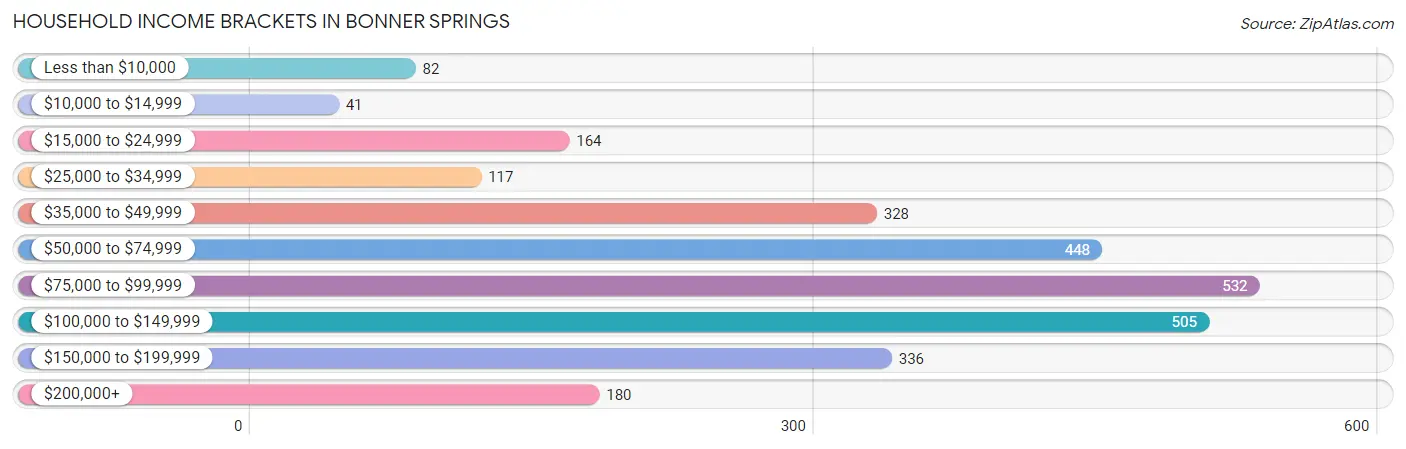
| Income Bracket | # Households | % Households |
| Less than $10,000 | 82 | 3.0% |
| $10,000 to $14,999 | 41 | 1.5% |
| $15,000 to $24,999 | 164 | 6.0% |
| $25,000 to $34,999 | 117 | 4.3% |
| $35,000 to $49,999 | 328 | 12.0% |
| $50,000 to $74,999 | 448 | 16.4% |
| $75,000 to $99,999 | 532 | 19.5% |
| $100,000 to $149,999 | 505 | 18.5% |
| $150,000 to $199,999 | 336 | 12.3% |
| $200,000+ | 180 | 6.6% |
Household Income by Householder Age in Bonner Springs
The median household income in Bonner Springs is $82,208, with the highest median household income of $103,917 found in the 45 to 64 years age bracket for the primary householder. A total of 1,079 households (39.5%) fall into this category. Meanwhile, the 65+ years age bracket for the primary householder has the lowest median household income of $53,707, with 634 households (23.2%) in this group.
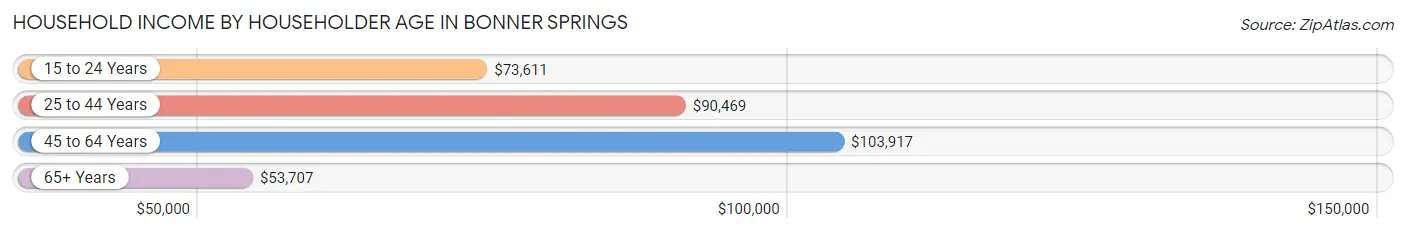
| Income Bracket | # Households | Median Income |
| 15 to 24 Years | 98 (3.6%) | $73,611 |
| 25 to 44 Years | 919 (33.7%) | $90,469 |
| 45 to 64 Years | 1,079 (39.5%) | $103,917 |
| 65+ Years | 634 (23.2%) | $53,707 |
| Total | 2,730 (100.0%) | $82,208 |
Poverty in Bonner Springs
Income Below Poverty by Sex and Age in Bonner Springs
With 12.8% poverty level for males and 12.3% for females among the residents of Bonner Springs, 15 year old males and 16 and 17 year old females are the most vulnerable to poverty, with 52 males (61.2%) and 36 females (31.6%) in their respective age groups living below the poverty level.
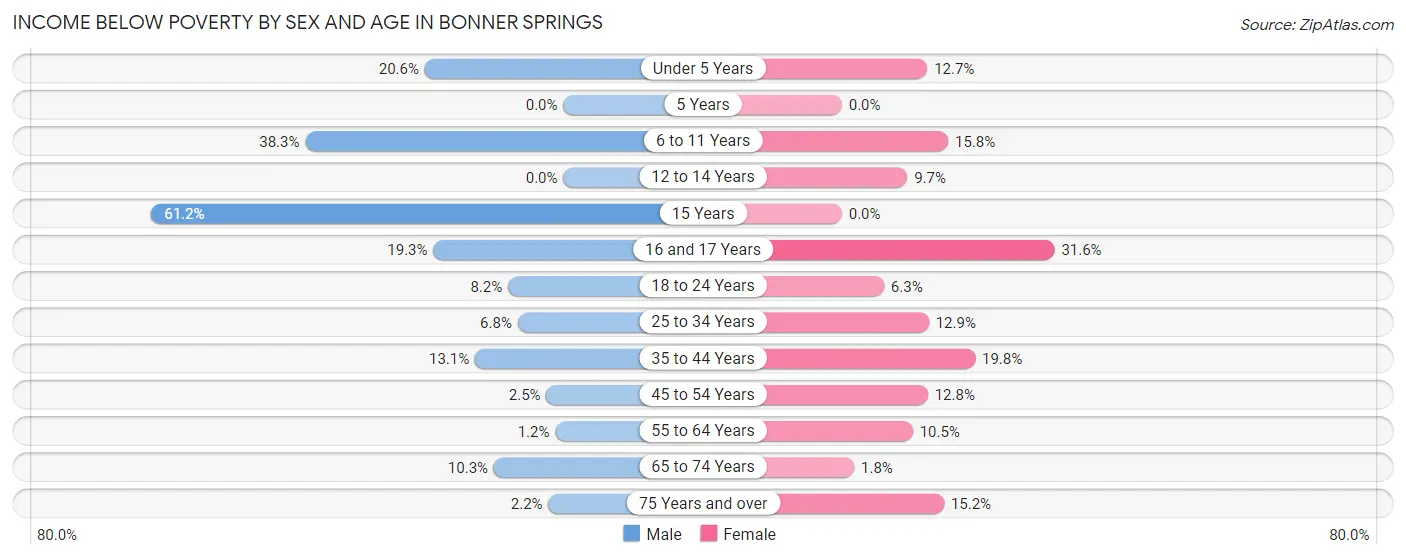
| Age Bracket | Male | Female |
| Under 5 Years | 64 (20.6%) | 45 (12.7%) |
| 5 Years | 0 (0.0%) | 0 (0.0%) |
| 6 to 11 Years | 182 (38.3%) | 42 (15.8%) |
| 12 to 14 Years | 0 (0.0%) | 30 (9.7%) |
| 15 Years | 52 (61.2%) | 0 (0.0%) |
| 16 and 17 Years | 22 (19.3%) | 36 (31.6%) |
| 18 to 24 Years | 17 (8.2%) | 13 (6.2%) |
| 25 to 34 Years | 30 (6.8%) | 75 (12.9%) |
| 35 to 44 Years | 56 (13.1%) | 73 (19.8%) |
| 45 to 54 Years | 8 (2.5%) | 62 (12.8%) |
| 55 to 64 Years | 8 (1.2%) | 69 (10.5%) |
| 65 to 74 Years | 37 (10.3%) | 6 (1.8%) |
| 75 Years and over | 3 (2.2%) | 32 (15.2%) |
| Total | 479 (12.8%) | 483 (12.3%) |
Income Above Poverty by Sex and Age in Bonner Springs
According to the poverty statistics in Bonner Springs, males aged 5 years and females aged 5 years are the age groups that are most secure financially, with 100.0% of males and 100.0% of females in these age groups living above the poverty line.
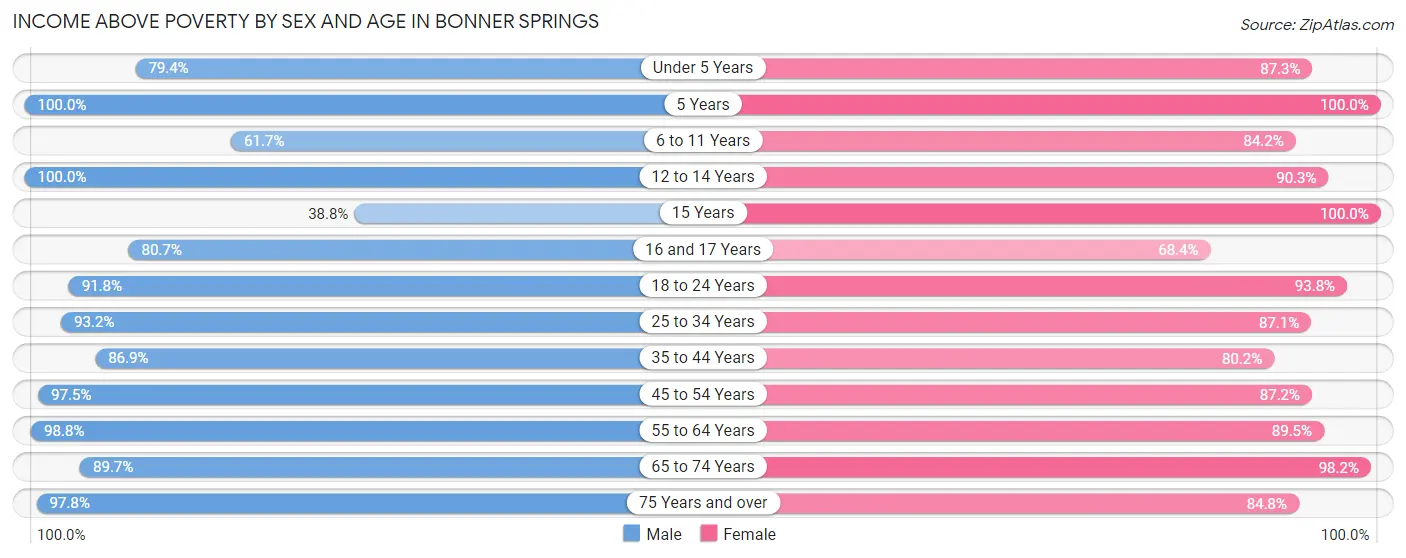
| Age Bracket | Male | Female |
| Under 5 Years | 247 (79.4%) | 310 (87.3%) |
| 5 Years | 123 (100.0%) | 7 (100.0%) |
| 6 to 11 Years | 293 (61.7%) | 224 (84.2%) |
| 12 to 14 Years | 88 (100.0%) | 279 (90.3%) |
| 15 Years | 33 (38.8%) | 45 (100.0%) |
| 16 and 17 Years | 92 (80.7%) | 78 (68.4%) |
| 18 to 24 Years | 190 (91.8%) | 195 (93.8%) |
| 25 to 34 Years | 413 (93.2%) | 506 (87.1%) |
| 35 to 44 Years | 371 (86.9%) | 296 (80.2%) |
| 45 to 54 Years | 311 (97.5%) | 424 (87.2%) |
| 55 to 64 Years | 657 (98.8%) | 586 (89.5%) |
| 65 to 74 Years | 322 (89.7%) | 321 (98.2%) |
| 75 Years and over | 133 (97.8%) | 179 (84.8%) |
| Total | 3,273 (87.2%) | 3,450 (87.7%) |
Income Below Poverty Among Married-Couple Families in Bonner Springs
The poverty statistics for married-couple families in Bonner Springs show that 3.8% or 61 of the total 1,608 families live below the poverty line. Families with 5 or more children have the highest poverty rate of 100.0%, comprising of 33 families. On the other hand, families with no children have the lowest poverty rate of 0.6%, which includes 6 families.
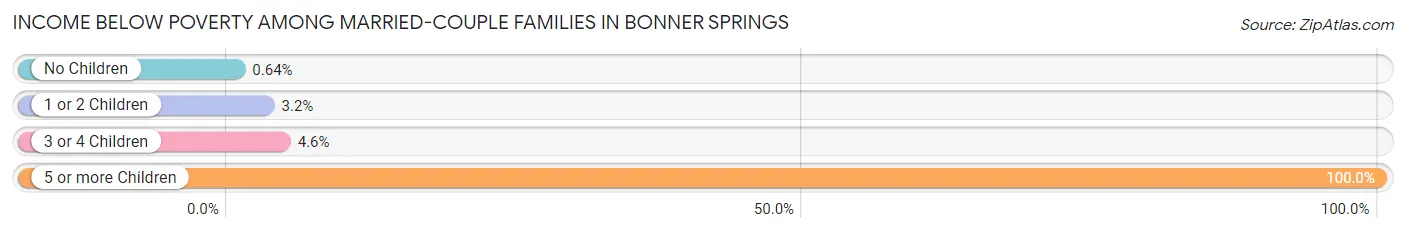
| Children | Above Poverty | Below Poverty |
| No Children | 926 (99.4%) | 6 (0.6%) |
| 1 or 2 Children | 517 (96.8%) | 17 (3.2%) |
| 3 or 4 Children | 104 (95.4%) | 5 (4.6%) |
| 5 or more Children | 0 (0.0%) | 33 (100.0%) |
| Total | 1,547 (96.2%) | 61 (3.8%) |
Income Below Poverty Among Single-Parent Households in Bonner Springs
According to the poverty data in Bonner Springs, 33.0% or 33 single-father households and 14.3% or 40 single-mother households are living below the poverty line. Among single-father households, those with 3 or 4 children have the highest poverty rate, with 11 households (100.0%) experiencing poverty. Likewise, among single-mother households, those with 3 or 4 children have the highest poverty rate, with 22 households (23.4%) falling below the poverty line.
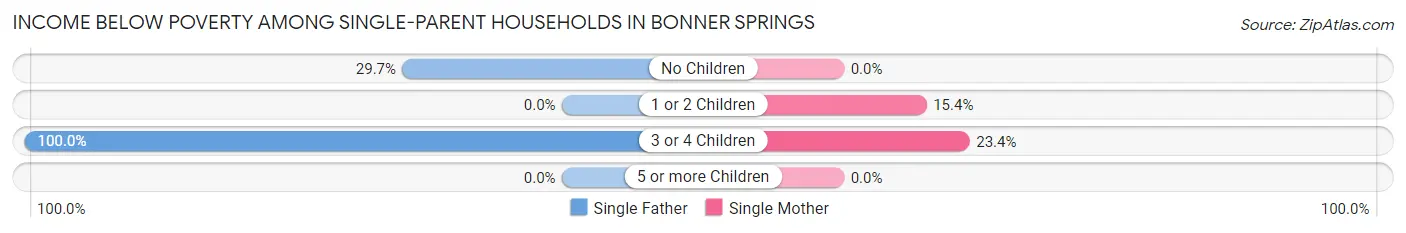
| Children | Single Father | Single Mother |
| No Children | 22 (29.7%) | 0 (0.0%) |
| 1 or 2 Children | 0 (0.0%) | 18 (15.4%) |
| 3 or 4 Children | 11 (100.0%) | 22 (23.4%) |
| 5 or more Children | 0 (0.0%) | 0 (0.0%) |
| Total | 33 (33.0%) | 40 (14.3%) |
Income Below Poverty Among Married-Couple vs Single-Parent Households in Bonner Springs
The poverty data for Bonner Springs shows that 61 of the married-couple family households (3.8%) and 73 of the single-parent households (19.3%) are living below the poverty level. Within the married-couple family households, those with 5 or more children have the highest poverty rate, with 33 households (100.0%) falling below the poverty line. Among the single-parent households, those with 3 or 4 children have the highest poverty rate, with 33 household (31.4%) living below poverty.
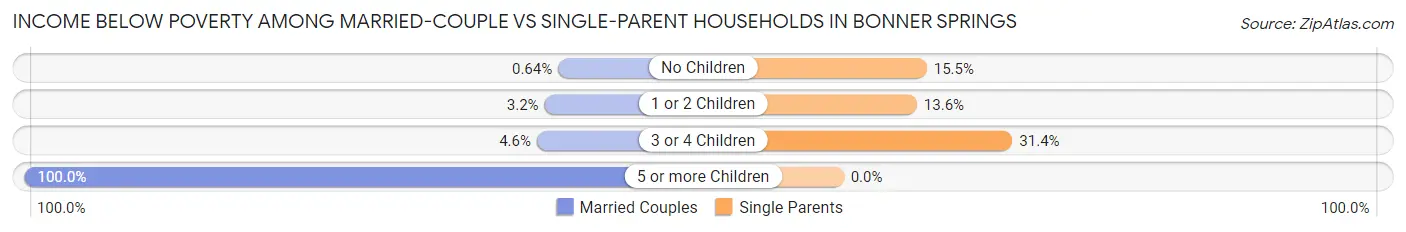
| Children | Married-Couple Families | Single-Parent Households |
| No Children | 6 (0.6%) | 22 (15.5%) |
| 1 or 2 Children | 17 (3.2%) | 18 (13.6%) |
| 3 or 4 Children | 5 (4.6%) | 33 (31.4%) |
| 5 or more Children | 33 (100.0%) | 0 (0.0%) |
| Total | 61 (3.8%) | 73 (19.3%) |
Race in Bonner Springs
The most populous races in Bonner Springs are White / Caucasian (6,119 | 78.7%), Hispanic or Latino (748 | 9.6%), and Two or more Races (551 | 7.1%).
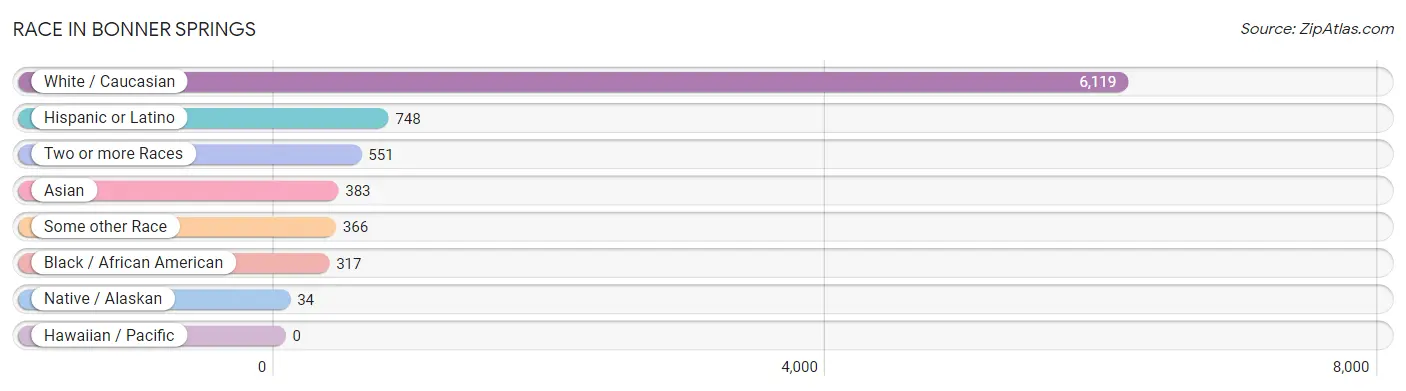
| Race | # Population | % Population |
| Asian | 383 | 4.9% |
| Black / African American | 317 | 4.1% |
| Hawaiian / Pacific | 0 | 0.0% |
| Hispanic or Latino | 748 | 9.6% |
| Native / Alaskan | 34 | 0.4% |
| White / Caucasian | 6,119 | 78.7% |
| Two or more Races | 551 | 7.1% |
| Some other Race | 366 | 4.7% |
| Total | 7,770 | 100.0% |
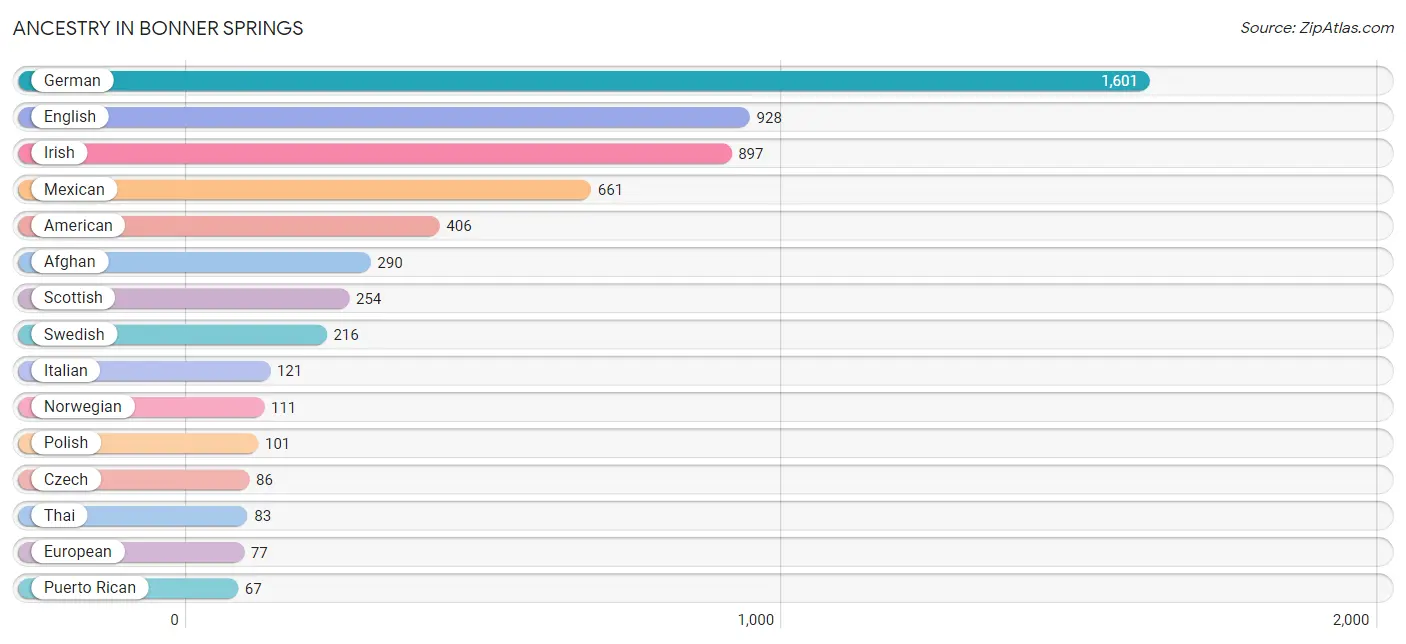
Ancestry in Bonner Springs
The most populous ancestries reported in Bonner Springs are German (1,601 | 20.6%), English (928 | 11.9%), Irish (897 | 11.5%), Mexican (661 | 8.5%), and American (406 | 5.2%), together accounting for 57.8% of all Bonner Springs residents.
| Ancestry | # Population | % Population |
| Afghan | 290 | 3.7% |
| American | 406 | 5.2% |
| Austrian | 6 | 0.1% |
| Belgian | 13 | 0.2% |
| British | 59 | 0.8% |
| Central American | 19 | 0.2% |
| Cherokee | 55 | 0.7% |
| Choctaw | 7 | 0.1% |
| Costa Rican | 10 | 0.1% |
| Croatian | 41 | 0.5% |
| Czech | 86 | 1.1% |
| Danish | 60 | 0.8% |
| Dutch | 54 | 0.7% |
| Eastern European | 10 | 0.1% |
| English | 928 | 11.9% |
| European | 77 | 1.0% |
| French | 53 | 0.7% |
| French Canadian | 39 | 0.5% |
| German | 1,601 | 20.6% |
| Greek | 14 | 0.2% |
| Honduran | 9 | 0.1% |
| Hungarian | 14 | 0.2% |
| Irish | 897 | 11.5% |
| Italian | 121 | 1.6% |
| Mexican | 661 | 8.5% |
| Navajo | 31 | 0.4% |
| Northern European | 6 | 0.1% |
| Norwegian | 111 | 1.4% |
| Polish | 101 | 1.3% |
| Puerto Rican | 67 | 0.9% |
| Russian | 28 | 0.4% |
| Scandinavian | 15 | 0.2% |
| Scotch-Irish | 39 | 0.5% |
| Scottish | 254 | 3.3% |
| Spaniard | 1 | 0.0% |
| Sri Lankan | 30 | 0.4% |
| Swedish | 216 | 2.8% |
| Swiss | 10 | 0.1% |
| Thai | 83 | 1.1% |
| Ukrainian | 10 | 0.1% |
| Welsh | 65 | 0.8% | View All 41 Rows |
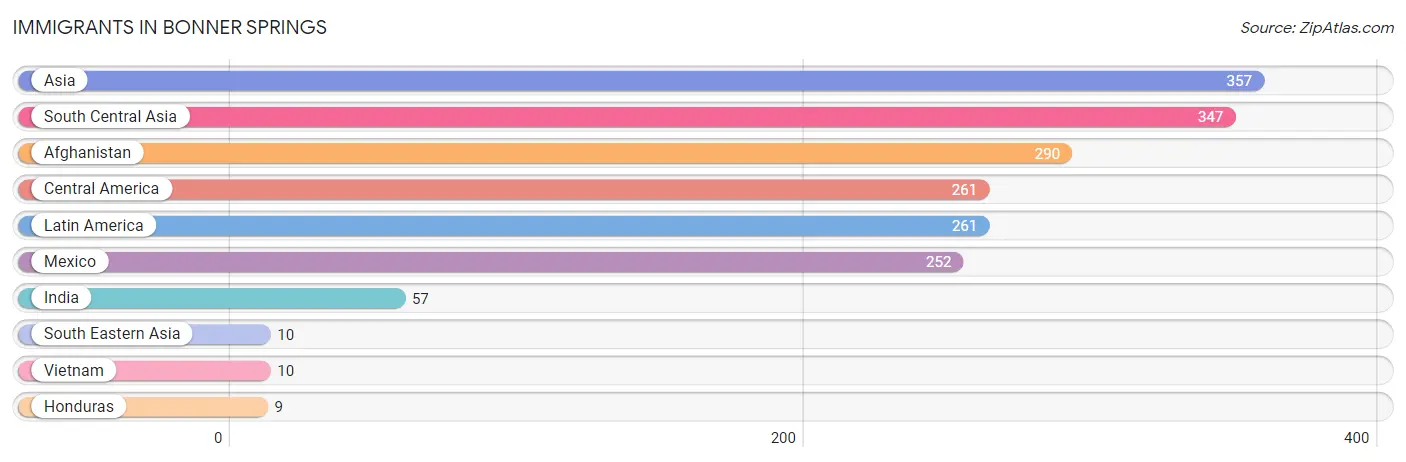
Immigrants in Bonner Springs
The most numerous immigrant groups reported in Bonner Springs came from Asia (357 | 4.6%), South Central Asia (347 | 4.5%), Afghanistan (290 | 3.7%), Central America (261 | 3.4%), and Latin America (261 | 3.4%), together accounting for 19.5% of all Bonner Springs residents.
| Immigration Origin | # Population | % Population |
| Afghanistan | 290 | 3.7% |
| Asia | 357 | 4.6% |
| Central America | 261 | 3.4% |
| Honduras | 9 | 0.1% |
| India | 57 | 0.7% |
| Latin America | 261 | 3.4% |
| Mexico | 252 | 3.2% |
| South Central Asia | 347 | 4.5% |
| South Eastern Asia | 10 | 0.1% |
| Vietnam | 10 | 0.1% | View All 10 Rows |
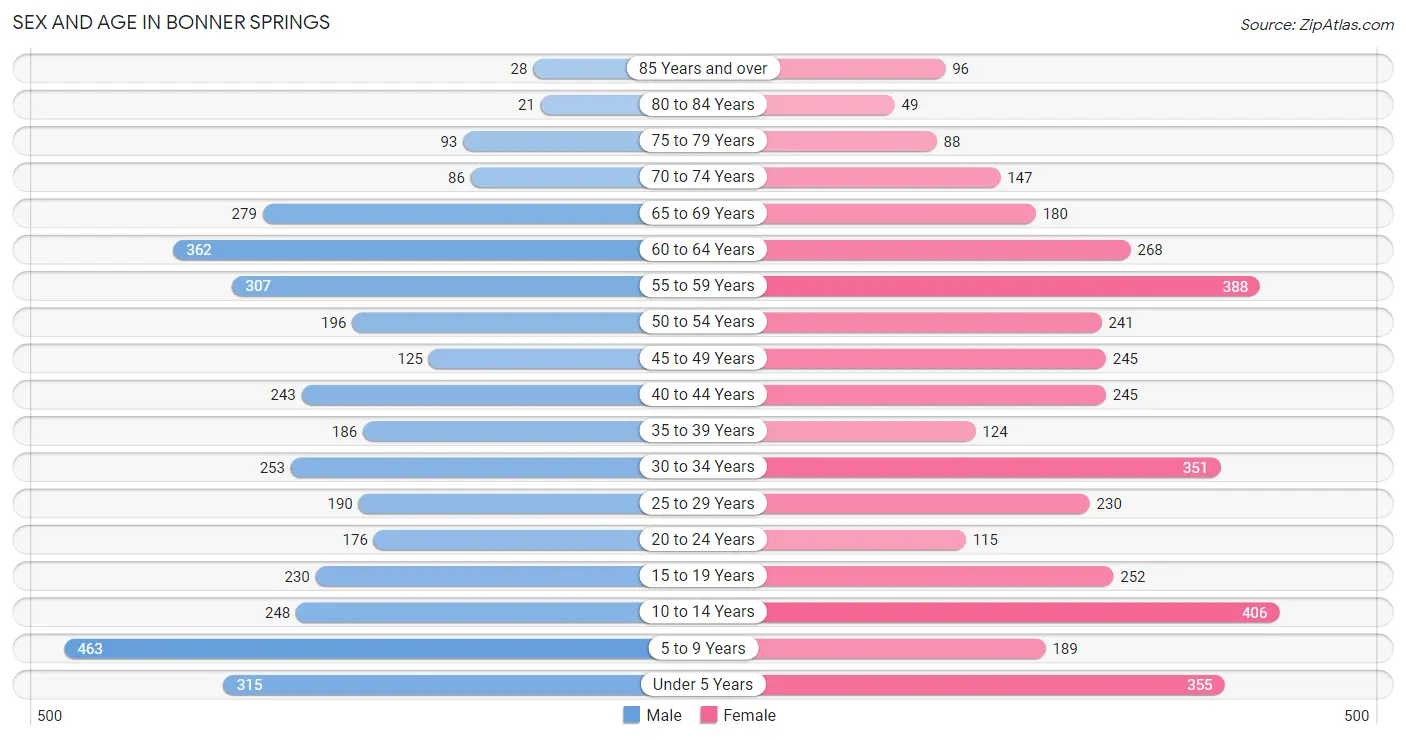
Sex and Age in Bonner Springs
Sex and Age in Bonner Springs
The most populous age groups in Bonner Springs are 5 to 9 Years (463 | 12.2%) for men and 10 to 14 Years (406 | 10.2%) for women.
| Age Bracket | Male | Female |
| Under 5 Years | 315 (8.3%) | 355 (8.9%) |
| 5 to 9 Years | 463 (12.2%) | 189 (4.8%) |
| 10 to 14 Years | 248 (6.5%) | 406 (10.2%) |
| 15 to 19 Years | 230 (6.0%) | 252 (6.4%) |
| 20 to 24 Years | 176 (4.6%) | 115 (2.9%) |
| 25 to 29 Years | 190 (5.0%) | 230 (5.8%) |
| 30 to 34 Years | 253 (6.7%) | 351 (8.8%) |
| 35 to 39 Years | 186 (4.9%) | 124 (3.1%) |
| 40 to 44 Years | 243 (6.4%) | 245 (6.2%) |
| 45 to 49 Years | 125 (3.3%) | 245 (6.2%) |
| 50 to 54 Years | 196 (5.2%) | 241 (6.1%) |
| 55 to 59 Years | 307 (8.1%) | 388 (9.8%) |
| 60 to 64 Years | 362 (9.5%) | 268 (6.8%) |
| 65 to 69 Years | 279 (7.3%) | 180 (4.5%) |
| 70 to 74 Years | 86 (2.3%) | 147 (3.7%) |
| 75 to 79 Years | 93 (2.5%) | 88 (2.2%) |
| 80 to 84 Years | 21 (0.5%) | 49 (1.2%) |
| 85 Years and over | 28 (0.7%) | 96 (2.4%) |
| Total | 3,801 (100.0%) | 3,969 (100.0%) |
Families and Households in Bonner Springs
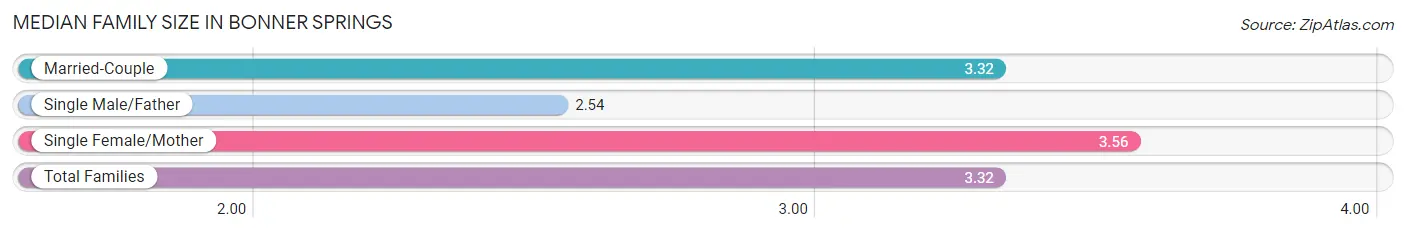
Median Family Size in Bonner Springs
The median family size in Bonner Springs is 3.32 persons per family, with single female/mother families (279 | 14.0%) accounting for the largest median family size of 3.56 persons per family. On the other hand, single male/father families (100 | 5.0%) represent the smallest median family size with 2.54 persons per family.
| Family Type | # Families | Family Size |
| Married-Couple | 1,608 (80.9%) | 3.32 |
| Single Male/Father | 100 (5.0%) | 2.54 |
| Single Female/Mother | 279 (14.0%) | 3.56 |
| Total Families | 1,987 (100.0%) | 3.32 |
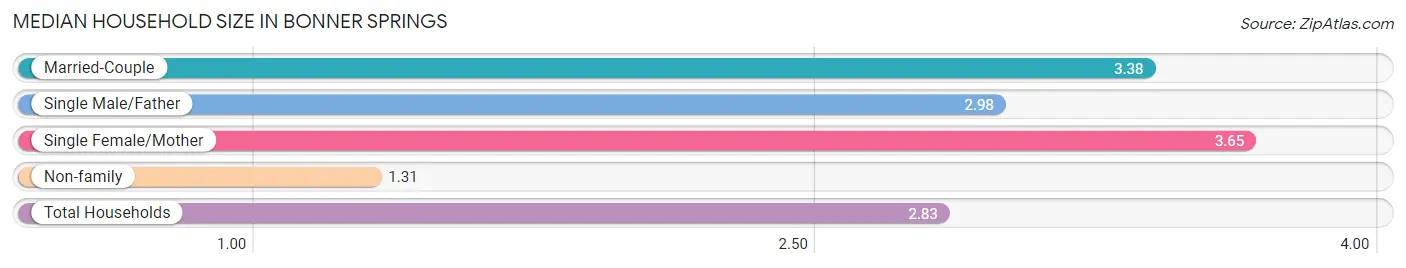
Median Household Size in Bonner Springs
The median household size in Bonner Springs is 2.83 persons per household, with single female/mother households (279 | 10.2%) accounting for the largest median household size of 3.65 persons per household. non-family households (743 | 27.2%) represent the smallest median household size with 1.31 persons per household.
| Household Type | # Households | Household Size |
| Married-Couple | 1,608 (58.9%) | 3.38 |
| Single Male/Father | 100 (3.7%) | 2.98 |
| Single Female/Mother | 279 (10.2%) | 3.65 |
| Non-family | 743 (27.2%) | 1.31 |
| Total Households | 2,730 (100.0%) | 2.83 |
Household Size by Marriage Status in Bonner Springs
Out of a total of 2,730 households in Bonner Springs, 1,987 (72.8%) are family households, while 743 (27.2%) are nonfamily households. The most numerous type of family households are 2-person households, comprising 952, and the most common type of nonfamily households are 1-person households, comprising 540.
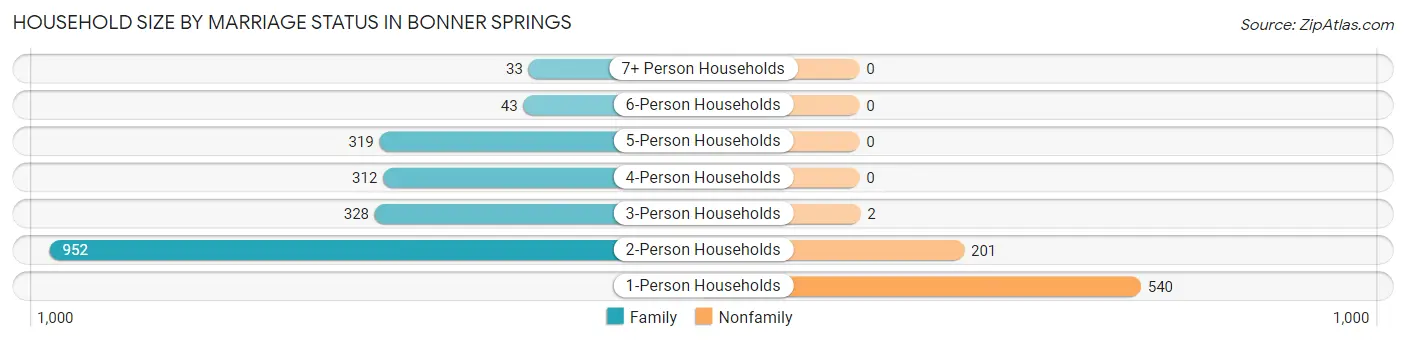
| Household Size | Family Households | Nonfamily Households |
| 1-Person Households | - | 540 (19.8%) |
| 2-Person Households | 952 (34.9%) | 201 (7.4%) |
| 3-Person Households | 328 (12.0%) | 2 (0.1%) |
| 4-Person Households | 312 (11.4%) | 0 (0.0%) |
| 5-Person Households | 319 (11.7%) | 0 (0.0%) |
| 6-Person Households | 43 (1.6%) | 0 (0.0%) |
| 7+ Person Households | 33 (1.2%) | 0 (0.0%) |
| Total | 1,987 (72.8%) | 743 (27.2%) |
Female Fertility in Bonner Springs
Fertility by Age in Bonner Springs
Average fertility rate in Bonner Springs is 41.0 births per 1,000 women. Women in the age bracket of 20 to 34 years have the highest fertility rate with 95.0 births per 1,000 women. Women in the age bracket of 20 to 34 years acount for 100.0% of all women with births.
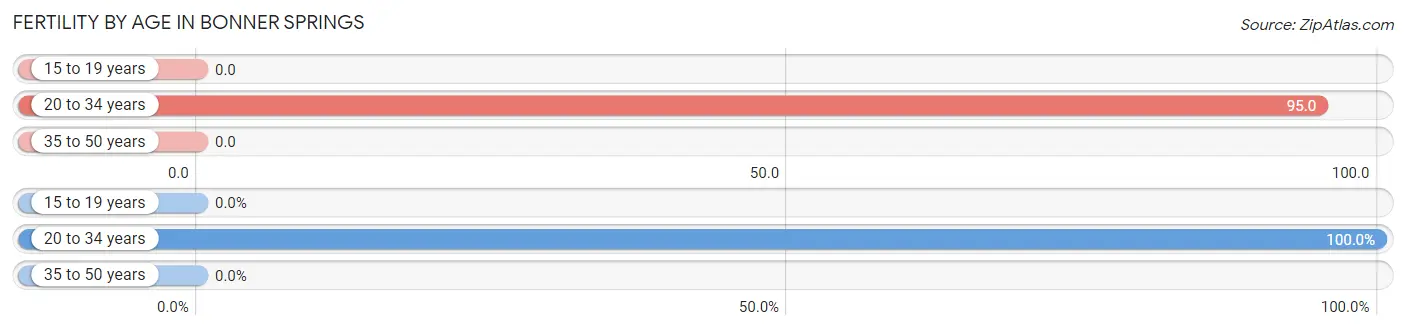
| Age Bracket | Women with Births | Births / 1,000 Women |
| 15 to 19 years | 0 (0.0%) | 0.0 |
| 20 to 34 years | 66 (100.0%) | 95.0 |
| 35 to 50 years | 0 (0.0%) | 0.0 |
| Total | 66 (100.0%) | 41.0 |
Fertility by Age by Marriage Status in Bonner Springs
84.8% of women with births (66) in Bonner Springs are married. The highest percentage of unmarried women with births falls into 20 to 34 years age bracket with 15.1% of them unmarried at the time of birth, while the lowest percentage of unmarried women with births belong to 20 to 34 years age bracket with 15.1% of them unmarried.
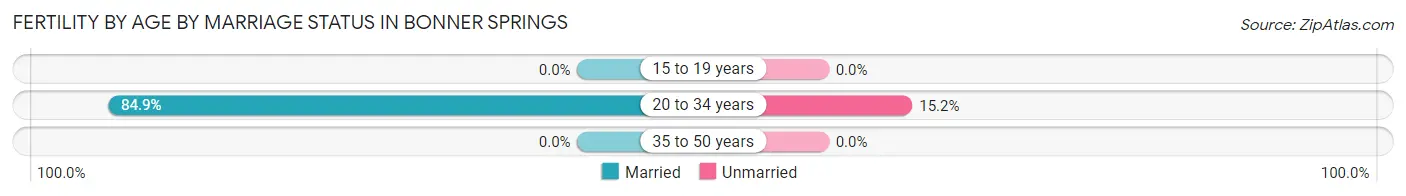
| Age Bracket | Married | Unmarried |
| 15 to 19 years | 0 (0.0%) | 0 (0.0%) |
| 20 to 34 years | 56 (84.9%) | 10 (15.1%) |
| 35 to 50 years | 0 (0.0%) | 0 (0.0%) |
| Total | 56 (84.9%) | 10 (15.1%) |
Fertility by Education in Bonner Springs
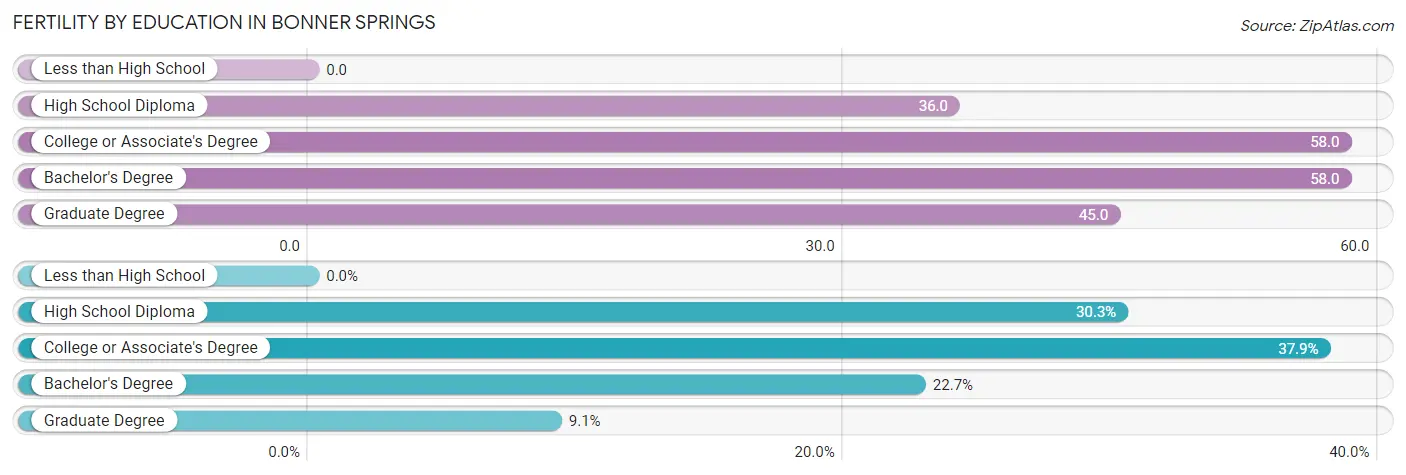
| Educational Attainment | Women with Births | Births / 1,000 Women |
| Less than High School | 0 (0.0%) | 0.0 |
| High School Diploma | 20 (30.3%) | 36.0 |
| College or Associate's Degree | 25 (37.9%) | 58.0 |
| Bachelor's Degree | 15 (22.7%) | 58.0 |
| Graduate Degree | 6 (9.1%) | 45.0 |
| Total | 66 (100.0%) | 41.0 |
Fertility by Education by Marriage Status in Bonner Springs
15.1% of women with births in Bonner Springs are unmarried. Women with the educational attainment of high school diploma are most likely to be married with 100.0% of them married at childbirth, while women with the educational attainment of college or associate's degree are least likely to be married with 40.0% of them unmarried at childbirth.
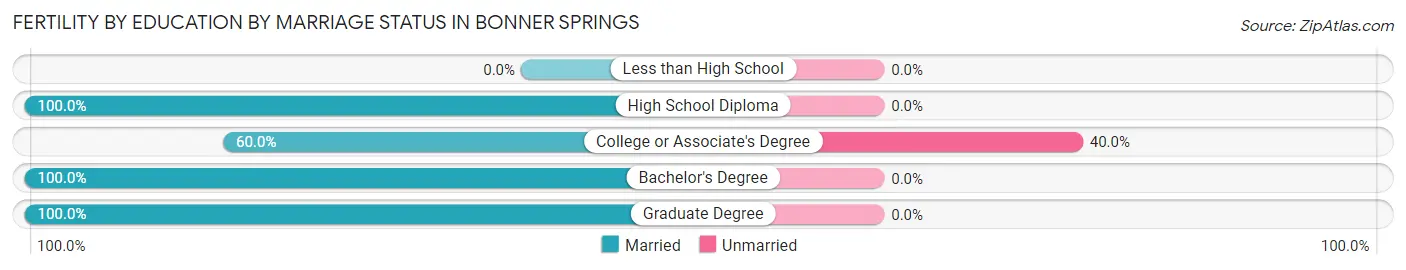
| Educational Attainment | Married | Unmarried |
| Less than High School | 0 (0.0%) | 0 (0.0%) |
| High School Diploma | 20 (100.0%) | 0 (0.0%) |
| College or Associate's Degree | 15 (60.0%) | 10 (40.0%) |
| Bachelor's Degree | 15 (100.0%) | 0 (0.0%) |
| Graduate Degree | 6 (100.0%) | 0 (0.0%) |
| Total | 56 (84.9%) | 10 (15.1%) |
Employment Characteristics in Bonner Springs
Employment by Class of Employer in Bonner Springs
Among the 3,611 employed individuals in Bonner Springs, private company employees (2,434 | 67.4%), local government employees (471 | 13.0%), and not-for-profit organizations (258 | 7.1%) make up the most common classes of employment.
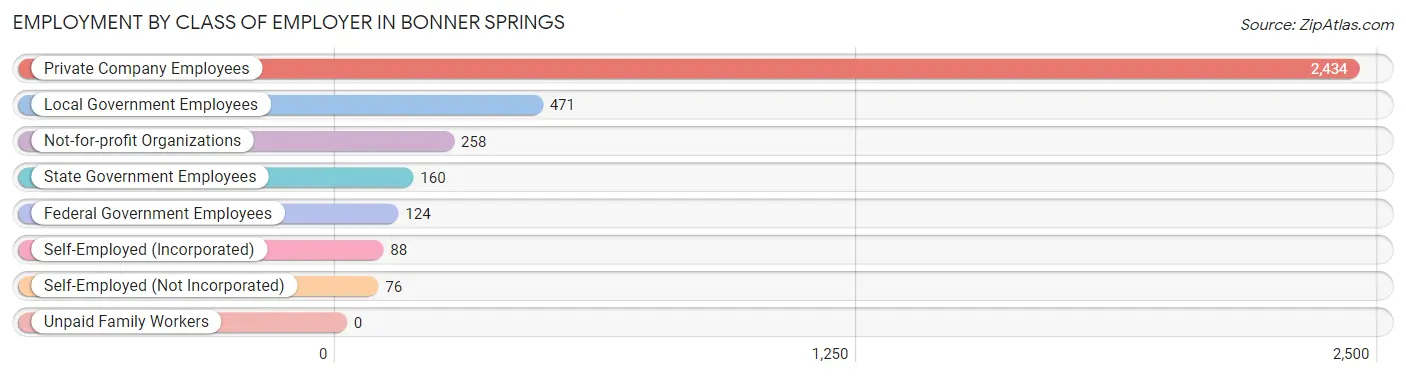
| Employer Class | # Employees | % Employees |
| Private Company Employees | 2,434 | 67.4% |
| Self-Employed (Incorporated) | 88 | 2.4% |
| Self-Employed (Not Incorporated) | 76 | 2.1% |
| Not-for-profit Organizations | 258 | 7.1% |
| Local Government Employees | 471 | 13.0% |
| State Government Employees | 160 | 4.4% |
| Federal Government Employees | 124 | 3.4% |
| Unpaid Family Workers | 0 | 0.0% |
| Total | 3,611 | 100.0% |
Employment Status by Age in Bonner Springs
According to the labor force statistics for Bonner Springs, out of the total population over 16 years of age (5,664), 67.2% or 3,806 individuals are in the labor force, with 2.5% or 95 of them unemployed. The age group with the highest labor force participation rate is 35 to 44 years, with 86.6% or 691 individuals in the labor force. Within the labor force, the 16 to 19 years age range has the highest percentage of unemployed individuals, with 12.4% or 30 of them being unemployed.
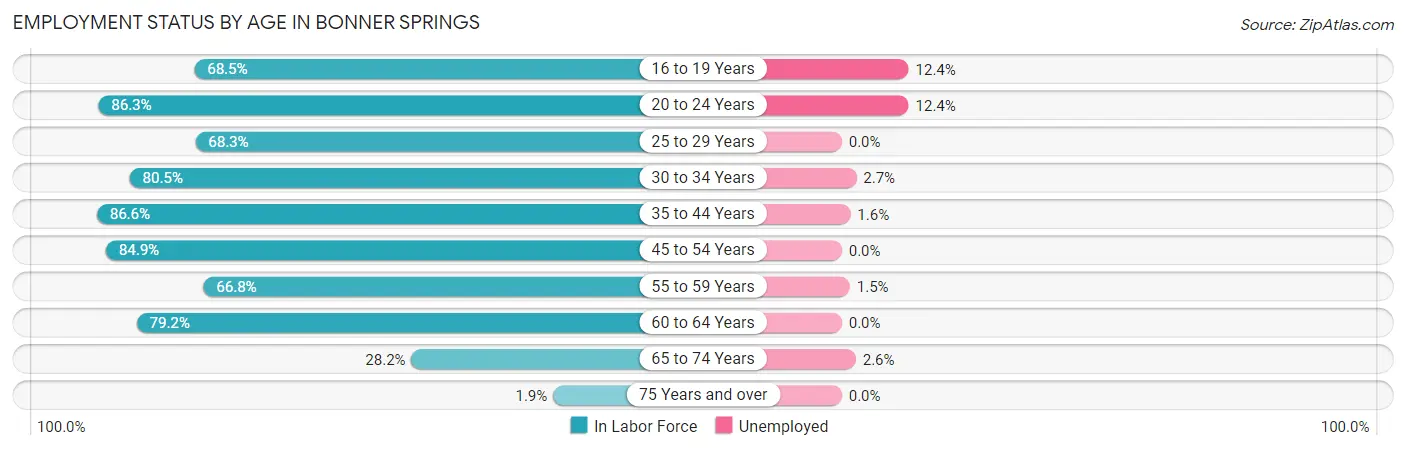
| Age Bracket | In Labor Force | Unemployed |
| 16 to 19 Years | 241 (68.5%) | 30 (12.4%) |
| 20 to 24 Years | 251 (86.3%) | 31 (12.4%) |
| 25 to 29 Years | 287 (68.3%) | 0 (0.0%) |
| 30 to 34 Years | 486 (80.5%) | 13 (2.7%) |
| 35 to 44 Years | 691 (86.6%) | 11 (1.6%) |
| 45 to 54 Years | 685 (84.9%) | 0 (0.0%) |
| 55 to 59 Years | 464 (66.8%) | 7 (1.5%) |
| 60 to 64 Years | 499 (79.2%) | 0 (0.0%) |
| 65 to 74 Years | 195 (28.2%) | 5 (2.6%) |
| 75 Years and over | 7 (1.9%) | 0 (0.0%) |
| Total | 3,806 (67.2%) | 95 (2.5%) |
Employment Status by Educational Attainment in Bonner Springs
According to labor force statistics for Bonner Springs, 78.7% of individuals (3,112) out of the total population between 25 and 64 years of age (3,954) are in the labor force, with 1.0% or 31 of them being unemployed. The group with the highest labor force participation rate are those with the educational attainment of bachelor's degree or higher, with 91.5% or 865 individuals in the labor force. Within the labor force, individuals with bachelor's degree or higher education have the highest percentage of unemployment, with 2.3% or 20 of them being unemployed.
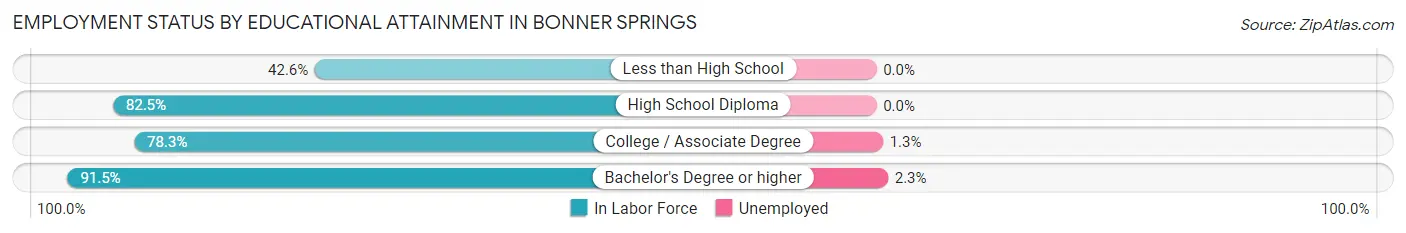
| Educational Attainment | In Labor Force | Unemployed |
| Less than High School | 201 (42.6%) | 0 (0.0%) |
| High School Diploma | 1,167 (82.5%) | 0 (0.0%) |
| College / Associate Degree | 879 (78.3%) | 15 (1.3%) |
| Bachelor's Degree or higher | 865 (91.5%) | 22 (2.3%) |
| Total | 3,112 (78.7%) | 40 (1.0%) |
Employment Occupations by Sex in Bonner Springs
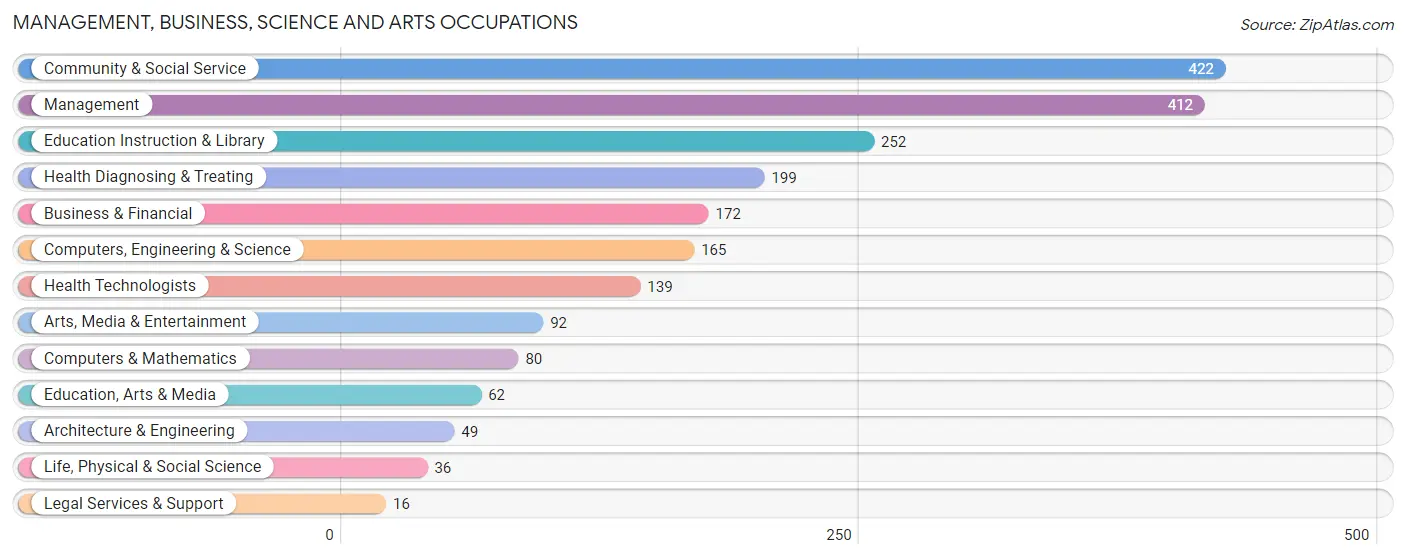
Management, Business, Science and Arts Occupations
The most common Management, Business, Science and Arts occupations in Bonner Springs are Community & Social Service (422 | 11.4%), Management (412 | 11.1%), Education Instruction & Library (252 | 6.8%), Health Diagnosing & Treating (199 | 5.4%), and Business & Financial (172 | 4.6%).
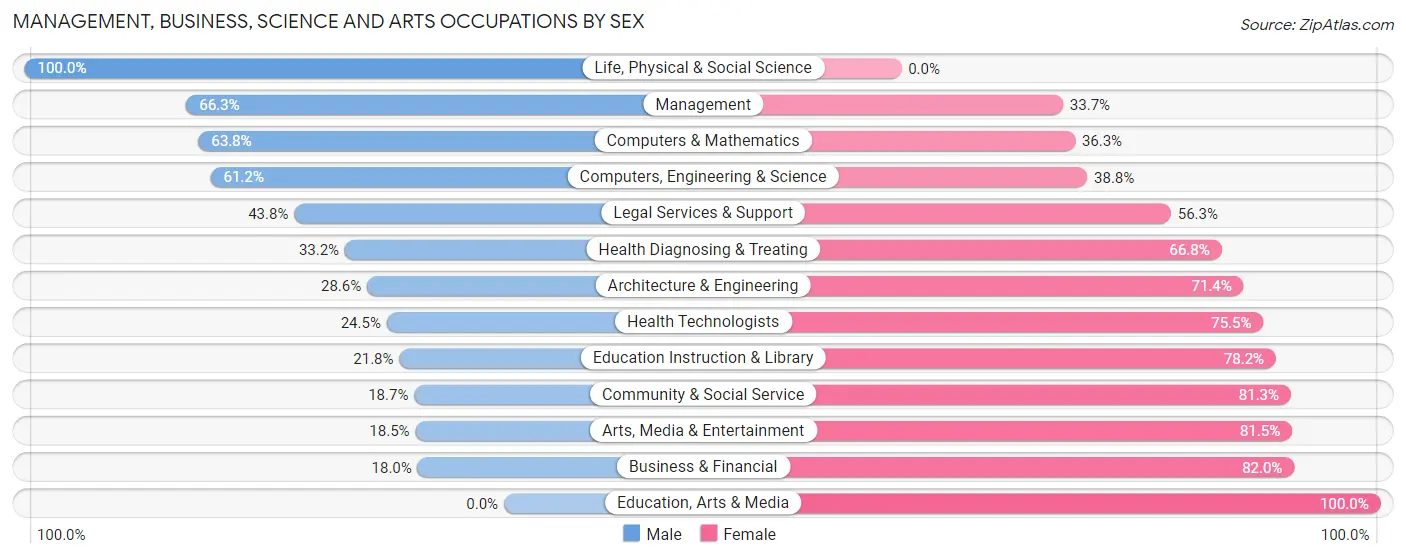
Management, Business, Science and Arts Occupations by Sex
Within the Management, Business, Science and Arts occupations in Bonner Springs, the most male-oriented occupations are Life, Physical & Social Science (100.0%), Management (66.3%), and Computers & Mathematics (63.7%), while the most female-oriented occupations are Education, Arts & Media (100.0%), Business & Financial (82.0%), and Arts, Media & Entertainment (81.5%).
| Occupation | Male | Female |
| Management | 273 (66.3%) | 139 (33.7%) |
| Business & Financial | 31 (18.0%) | 141 (82.0%) |
| Computers, Engineering & Science | 101 (61.2%) | 64 (38.8%) |
| Computers & Mathematics | 51 (63.7%) | 29 (36.2%) |
| Architecture & Engineering | 14 (28.6%) | 35 (71.4%) |
| Life, Physical & Social Science | 36 (100.0%) | 0 (0.0%) |
| Community & Social Service | 79 (18.7%) | 343 (81.3%) |
| Education, Arts & Media | 0 (0.0%) | 62 (100.0%) |
| Legal Services & Support | 7 (43.8%) | 9 (56.2%) |
| Education Instruction & Library | 55 (21.8%) | 197 (78.2%) |
| Arts, Media & Entertainment | 17 (18.5%) | 75 (81.5%) |
| Health Diagnosing & Treating | 66 (33.2%) | 133 (66.8%) |
| Health Technologists | 34 (24.5%) | 105 (75.5%) |
| Total (Category) | 550 (40.2%) | 820 (59.9%) |
| Total (Overall) | 1,775 (47.9%) | 1,934 (52.1%) |
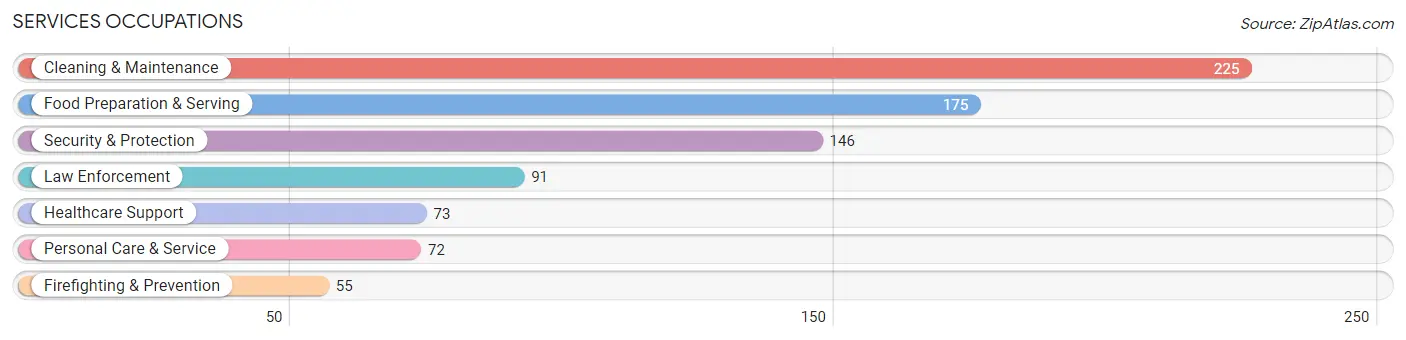
Services Occupations
The most common Services occupations in Bonner Springs are Cleaning & Maintenance (225 | 6.1%), Food Preparation & Serving (175 | 4.7%), Security & Protection (146 | 3.9%), Law Enforcement (91 | 2.5%), and Healthcare Support (73 | 2.0%).
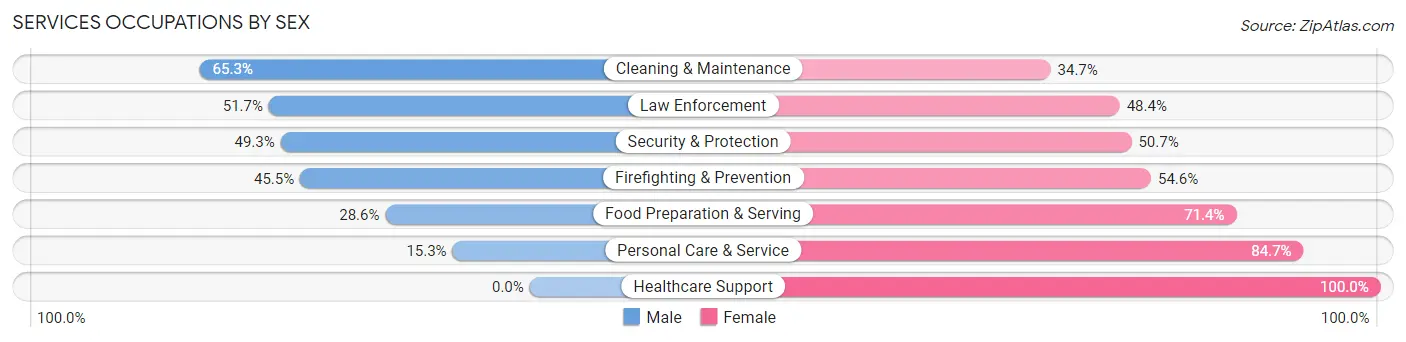
Services Occupations by Sex
Within the Services occupations in Bonner Springs, the most male-oriented occupations are Cleaning & Maintenance (65.3%), Law Enforcement (51.6%), and Security & Protection (49.3%), while the most female-oriented occupations are Healthcare Support (100.0%), Personal Care & Service (84.7%), and Food Preparation & Serving (71.4%).
| Occupation | Male | Female |
| Healthcare Support | 0 (0.0%) | 73 (100.0%) |
| Security & Protection | 72 (49.3%) | 74 (50.7%) |
| Firefighting & Prevention | 25 (45.5%) | 30 (54.5%) |
| Law Enforcement | 47 (51.6%) | 44 (48.3%) |
| Food Preparation & Serving | 50 (28.6%) | 125 (71.4%) |
| Cleaning & Maintenance | 147 (65.3%) | 78 (34.7%) |
| Personal Care & Service | 11 (15.3%) | 61 (84.7%) |
| Total (Category) | 280 (40.5%) | 411 (59.5%) |
| Total (Overall) | 1,775 (47.9%) | 1,934 (52.1%) |
Sales and Office Occupations
The most common Sales and Office occupations in Bonner Springs are Office & Administration (426 | 11.5%), and Sales & Related (236 | 6.4%).
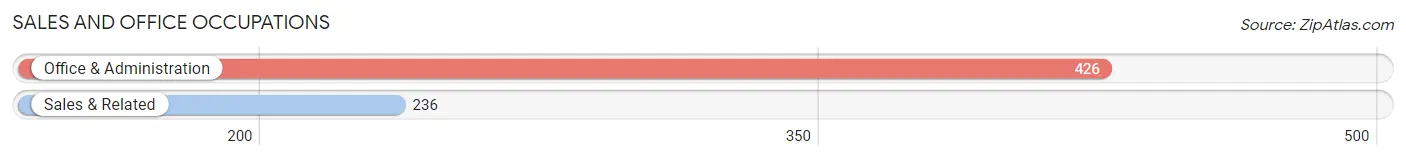
Sales and Office Occupations by Sex
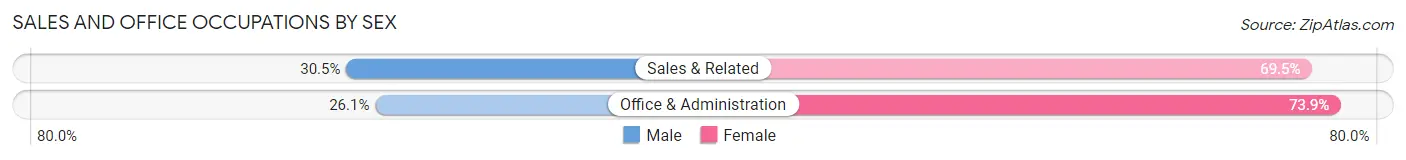
| Occupation | Male | Female |
| Sales & Related | 72 (30.5%) | 164 (69.5%) |
| Office & Administration | 111 (26.1%) | 315 (73.9%) |
| Total (Category) | 183 (27.6%) | 479 (72.4%) |
| Total (Overall) | 1,775 (47.9%) | 1,934 (52.1%) |
Natural Resources, Construction and Maintenance Occupations
The most common Natural Resources, Construction and Maintenance occupations in Bonner Springs are Construction & Extraction (132 | 3.6%), Installation, Maintenance & Repair (88 | 2.4%), and Farming, Fishing & Forestry (59 | 1.6%).
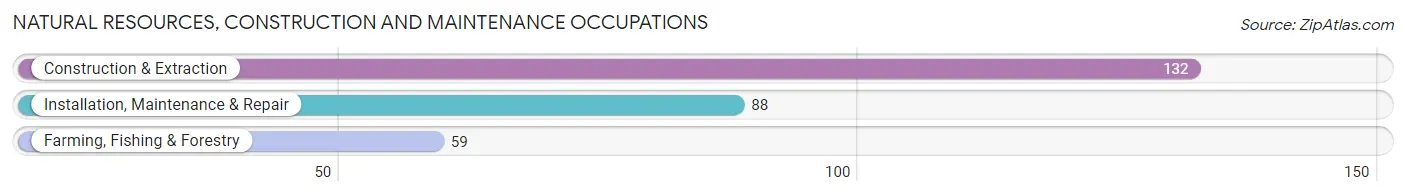
Natural Resources, Construction and Maintenance Occupations by Sex
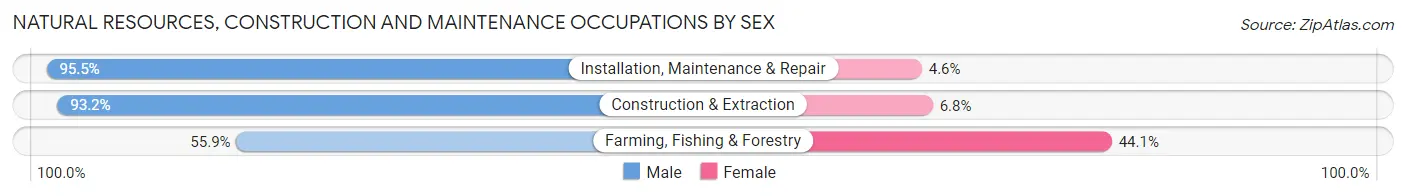
| Occupation | Male | Female |
| Farming, Fishing & Forestry | 33 (55.9%) | 26 (44.1%) |
| Construction & Extraction | 123 (93.2%) | 9 (6.8%) |
| Installation, Maintenance & Repair | 84 (95.5%) | 4 (4.5%) |
| Total (Category) | 240 (86.0%) | 39 (14.0%) |
| Total (Overall) | 1,775 (47.9%) | 1,934 (52.1%) |
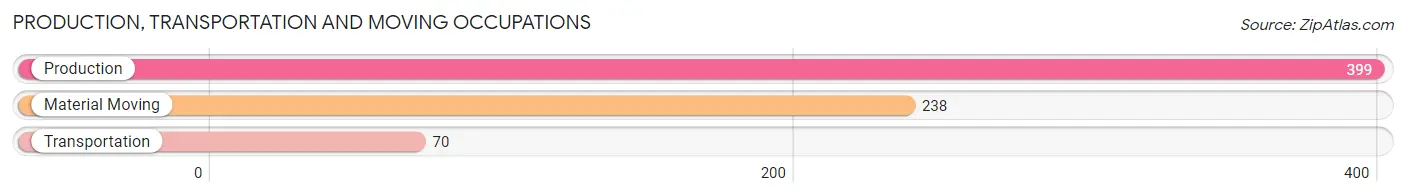
Production, Transportation and Moving Occupations
The most common Production, Transportation and Moving occupations in Bonner Springs are Production (399 | 10.8%), Material Moving (238 | 6.4%), and Transportation (70 | 1.9%).
Production, Transportation and Moving Occupations by Sex
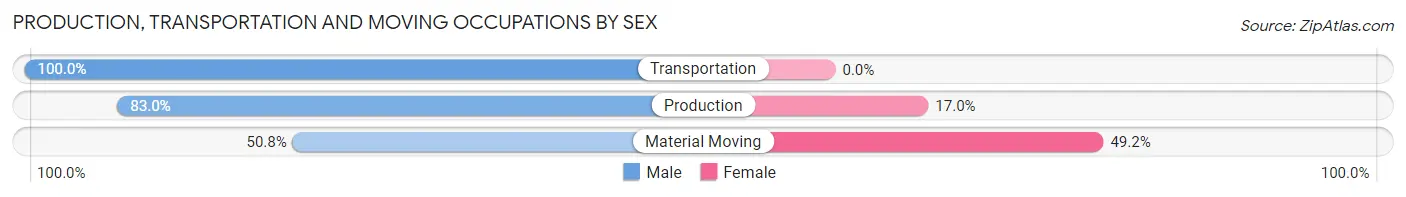
| Occupation | Male | Female |
| Production | 331 (83.0%) | 68 (17.0%) |
| Transportation | 70 (100.0%) | 0 (0.0%) |
| Material Moving | 121 (50.8%) | 117 (49.2%) |
| Total (Category) | 522 (73.8%) | 185 (26.2%) |
| Total (Overall) | 1,775 (47.9%) | 1,934 (52.1%) |
Employment Industries by Sex in Bonner Springs
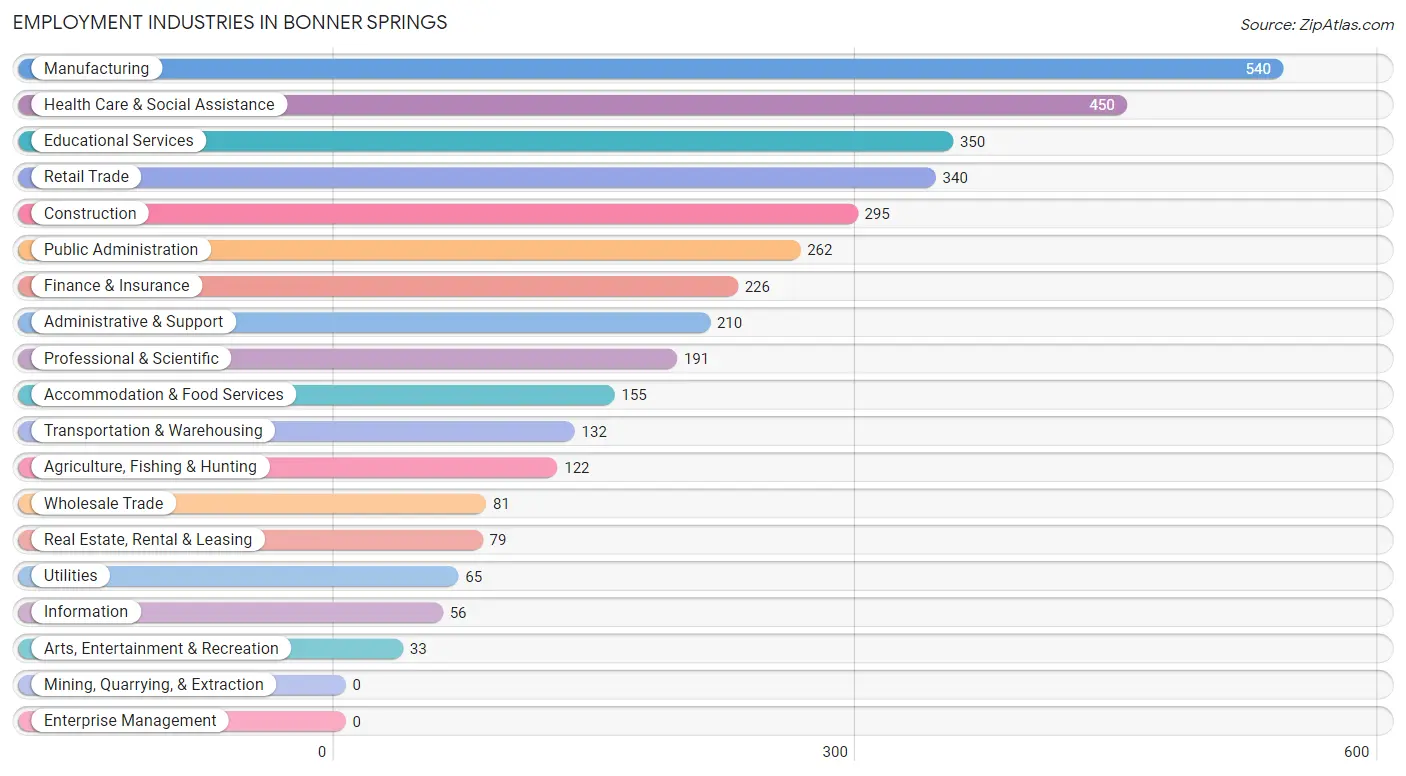
Employment Industries in Bonner Springs
The major employment industries in Bonner Springs include Manufacturing (540 | 14.6%), Health Care & Social Assistance (450 | 12.1%), Educational Services (350 | 9.4%), Retail Trade (340 | 9.2%), and Construction (295 | 8.0%).
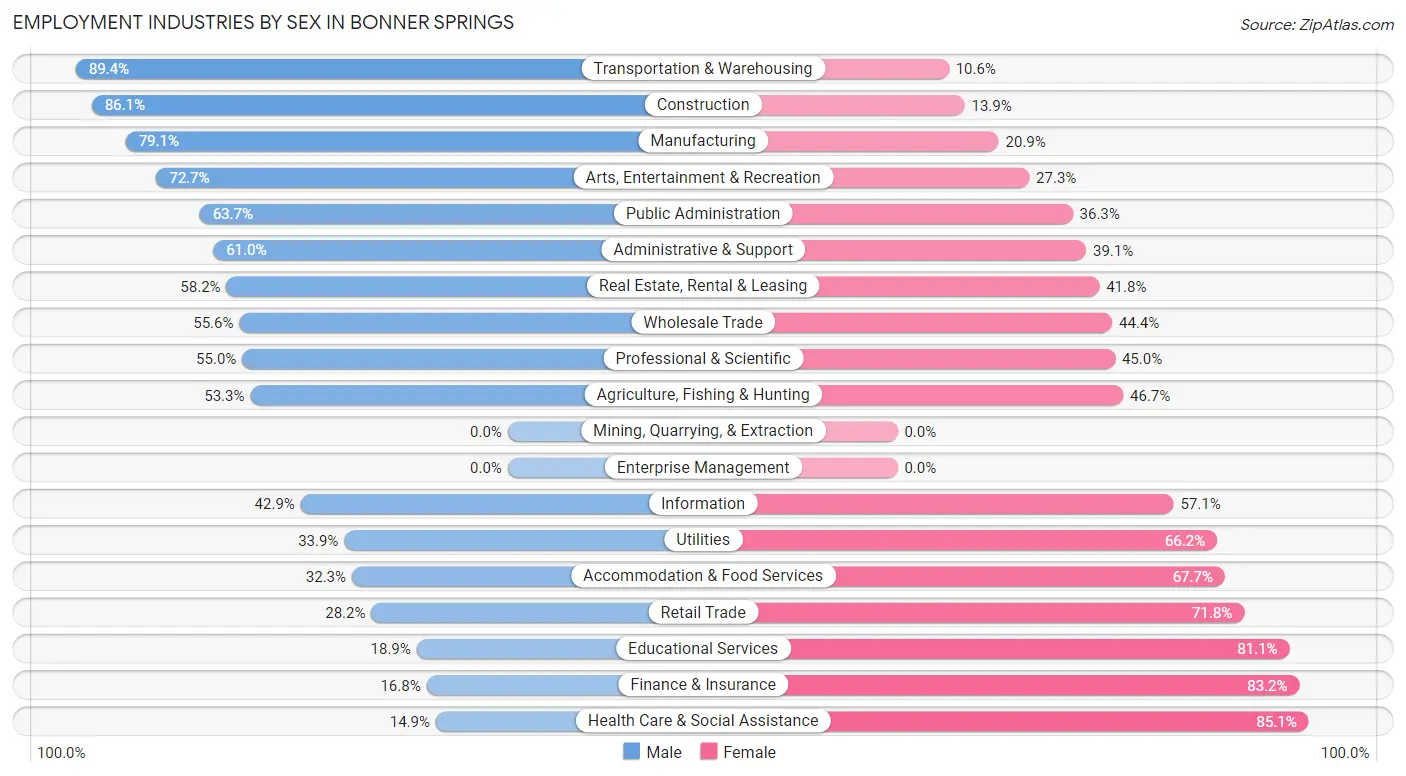
Employment Industries by Sex in Bonner Springs
The Bonner Springs industries that see more men than women are Transportation & Warehousing (89.4%), Construction (86.1%), and Manufacturing (79.1%), whereas the industries that tend to have a higher number of women are Health Care & Social Assistance (85.1%), Finance & Insurance (83.2%), and Educational Services (81.1%).
| Industry | Male | Female |
| Agriculture, Fishing & Hunting | 65 (53.3%) | 57 (46.7%) |
| Mining, Quarrying, & Extraction | 0 (0.0%) | 0 (0.0%) |
| Construction | 254 (86.1%) | 41 (13.9%) |
| Manufacturing | 427 (79.1%) | 113 (20.9%) |
| Wholesale Trade | 45 (55.6%) | 36 (44.4%) |
| Retail Trade | 96 (28.2%) | 244 (71.8%) |
| Transportation & Warehousing | 118 (89.4%) | 14 (10.6%) |
| Utilities | 22 (33.9%) | 43 (66.1%) |
| Information | 24 (42.9%) | 32 (57.1%) |
| Finance & Insurance | 38 (16.8%) | 188 (83.2%) |
| Real Estate, Rental & Leasing | 46 (58.2%) | 33 (41.8%) |
| Professional & Scientific | 105 (55.0%) | 86 (45.0%) |
| Enterprise Management | 0 (0.0%) | 0 (0.0%) |
| Administrative & Support | 128 (61.0%) | 82 (39.1%) |
| Educational Services | 66 (18.9%) | 284 (81.1%) |
| Health Care & Social Assistance | 67 (14.9%) | 383 (85.1%) |
| Arts, Entertainment & Recreation | 24 (72.7%) | 9 (27.3%) |
| Accommodation & Food Services | 50 (32.3%) | 105 (67.7%) |
| Public Administration | 167 (63.7%) | 95 (36.3%) |
| Total | 1,775 (47.9%) | 1,934 (52.1%) |
Education in Bonner Springs
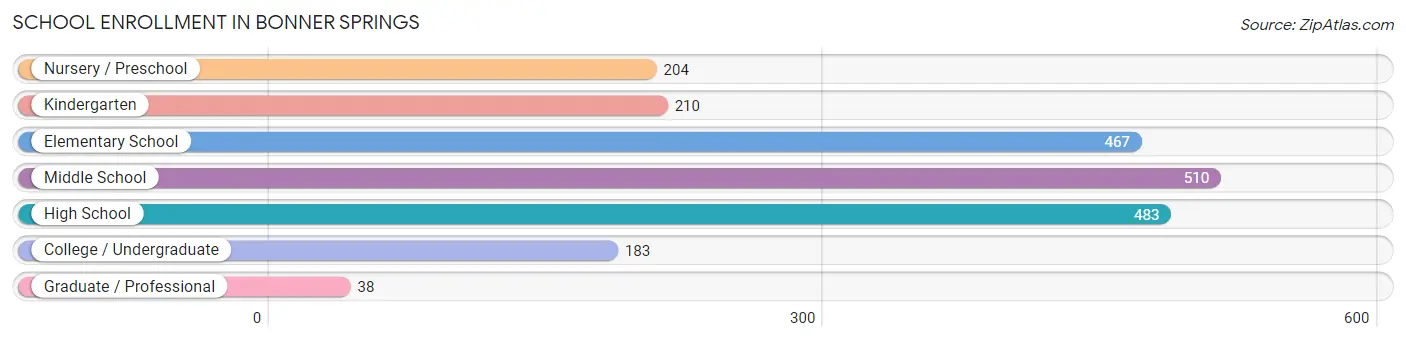
School Enrollment in Bonner Springs
The most common levels of schooling among the 2,095 students in Bonner Springs are middle school (510 | 24.3%), high school (483 | 23.1%), and elementary school (467 | 22.3%).
| School Level | # Students | % Students |
| Nursery / Preschool | 204 | 9.7% |
| Kindergarten | 210 | 10.0% |
| Elementary School | 467 | 22.3% |
| Middle School | 510 | 24.3% |
| High School | 483 | 23.1% |
| College / Undergraduate | 183 | 8.7% |
| Graduate / Professional | 38 | 1.8% |
| Total | 2,095 | 100.0% |
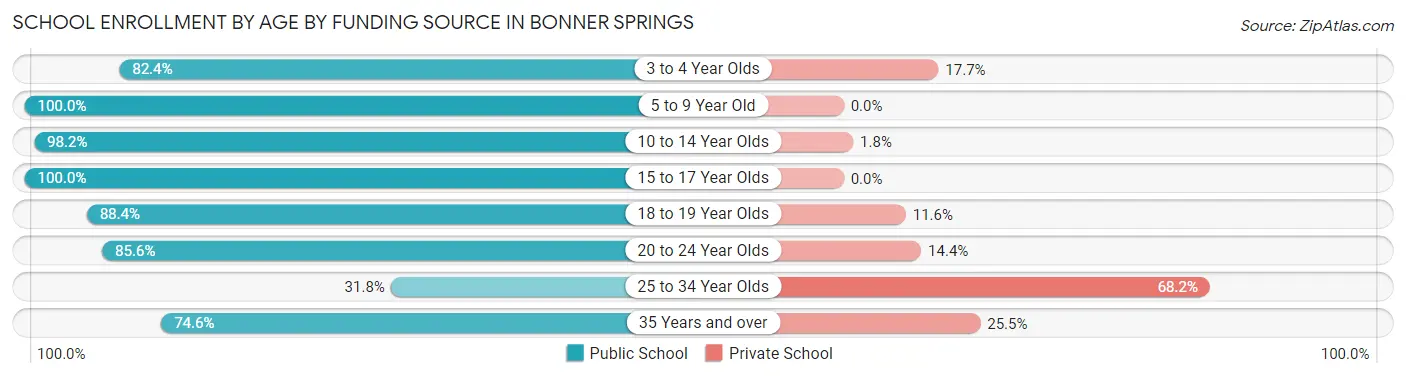
School Enrollment by Age by Funding Source in Bonner Springs
Out of a total of 2,095 students who are enrolled in schools in Bonner Springs, 115 (5.5%) attend a private institution, while the remaining 1,980 (94.5%) are enrolled in public schools. The age group of 25 to 34 year olds has the highest likelihood of being enrolled in private schools, with 30 (68.2% in the age bracket) enrolled. Conversely, the age group of 5 to 9 year old has the lowest likelihood of being enrolled in a private school, with 632 (100.0% in the age bracket) attending a public institution.
| Age Bracket | Public School | Private School |
| 3 to 4 Year Olds | 154 (82.4%) | 33 (17.6%) |
| 5 to 9 Year Old | 632 (100.0%) | 0 (0.0%) |
| 10 to 14 Year Olds | 611 (98.2%) | 11 (1.8%) |
| 15 to 17 Year Olds | 337 (100.0%) | 0 (0.0%) |
| 18 to 19 Year Olds | 107 (88.4%) | 14 (11.6%) |
| 20 to 24 Year Olds | 83 (85.6%) | 14 (14.4%) |
| 25 to 34 Year Olds | 14 (31.8%) | 30 (68.2%) |
| 35 Years and over | 41 (74.6%) | 14 (25.5%) |
| Total | 1,980 (94.5%) | 115 (5.5%) |
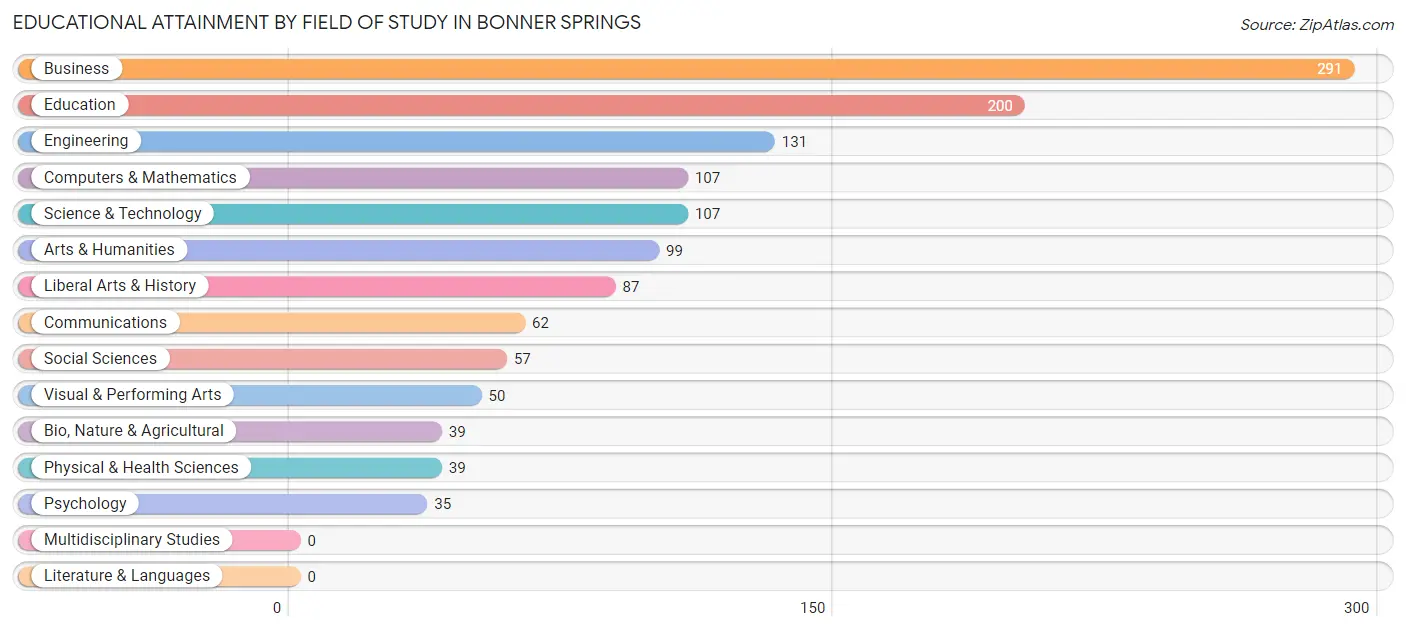
Educational Attainment by Field of Study in Bonner Springs
Business (291 | 22.3%), education (200 | 15.3%), engineering (131 | 10.1%), computers & mathematics (107 | 8.2%), and science & technology (107 | 8.2%) are the most common fields of study among 1,304 individuals in Bonner Springs who have obtained a bachelor's degree or higher.
| Field of Study | # Graduates | % Graduates |
| Computers & Mathematics | 107 | 8.2% |
| Bio, Nature & Agricultural | 39 | 3.0% |
| Physical & Health Sciences | 39 | 3.0% |
| Psychology | 35 | 2.7% |
| Social Sciences | 57 | 4.4% |
| Engineering | 131 | 10.1% |
| Multidisciplinary Studies | 0 | 0.0% |
| Science & Technology | 107 | 8.2% |
| Business | 291 | 22.3% |
| Education | 200 | 15.3% |
| Literature & Languages | 0 | 0.0% |
| Liberal Arts & History | 87 | 6.7% |
| Visual & Performing Arts | 50 | 3.8% |
| Communications | 62 | 4.8% |
| Arts & Humanities | 99 | 7.6% |
| Total | 1,304 | 100.0% |
Transportation & Commute in Bonner Springs
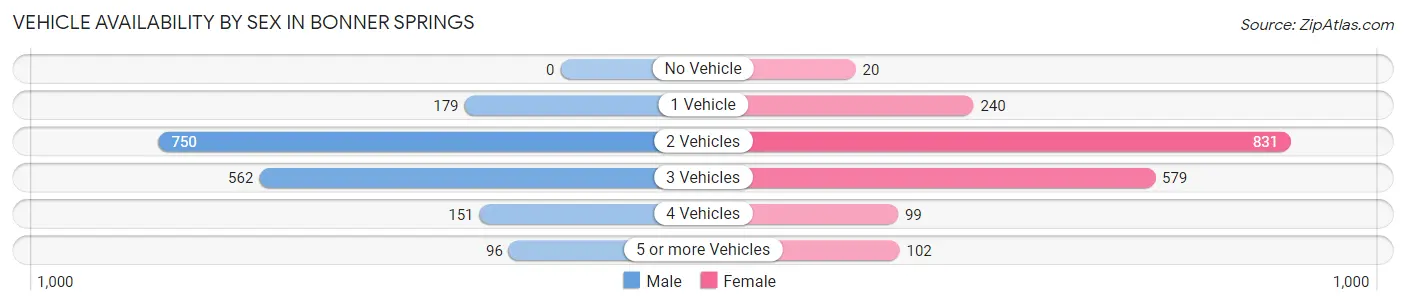
Vehicle Availability by Sex in Bonner Springs
The most prevalent vehicle ownership categories in Bonner Springs are males with 2 vehicles (750, accounting for 43.1%) and females with 2 vehicles (831, making up 40.1%).
| Vehicles Available | Male | Female |
| No Vehicle | 0 (0.0%) | 20 (1.1%) |
| 1 Vehicle | 179 (10.3%) | 240 (12.8%) |
| 2 Vehicles | 750 (43.1%) | 831 (44.4%) |
| 3 Vehicles | 562 (32.3%) | 579 (30.9%) |
| 4 Vehicles | 151 (8.7%) | 99 (5.3%) |
| 5 or more Vehicles | 96 (5.5%) | 102 (5.4%) |
| Total | 1,738 (100.0%) | 1,871 (100.0%) |
Commute Time in Bonner Springs
The most frequently occuring commute durations in Bonner Springs are 30 to 34 minutes (648 commuters, 19.9%), 15 to 19 minutes (520 commuters, 16.0%), and 5 to 9 minutes (517 commuters, 15.9%).
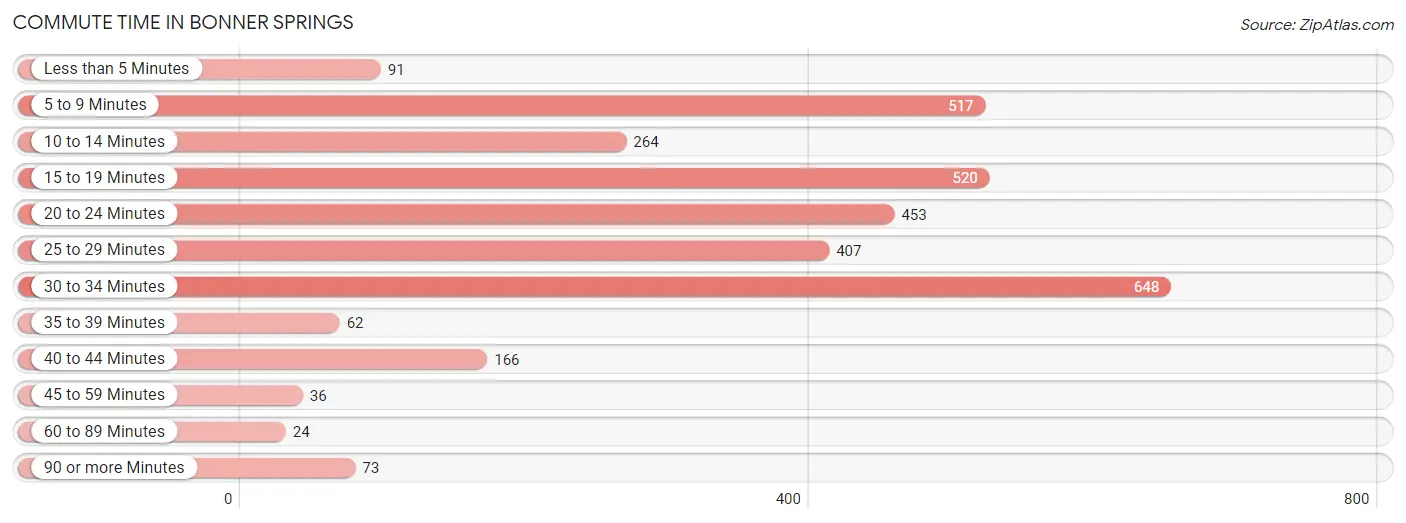
| Commute Time | # Commuters | % Commuters |
| Less than 5 Minutes | 91 | 2.8% |
| 5 to 9 Minutes | 517 | 15.9% |
| 10 to 14 Minutes | 264 | 8.1% |
| 15 to 19 Minutes | 520 | 16.0% |
| 20 to 24 Minutes | 453 | 13.9% |
| 25 to 29 Minutes | 407 | 12.5% |
| 30 to 34 Minutes | 648 | 19.9% |
| 35 to 39 Minutes | 62 | 1.9% |
| 40 to 44 Minutes | 166 | 5.1% |
| 45 to 59 Minutes | 36 | 1.1% |
| 60 to 89 Minutes | 24 | 0.7% |
| 90 or more Minutes | 73 | 2.2% |
Commute Time by Sex in Bonner Springs
The most common commute times in Bonner Springs are 30 to 34 minutes (352 commuters, 21.3%) for males and 30 to 34 minutes (296 commuters, 18.4%) for females.
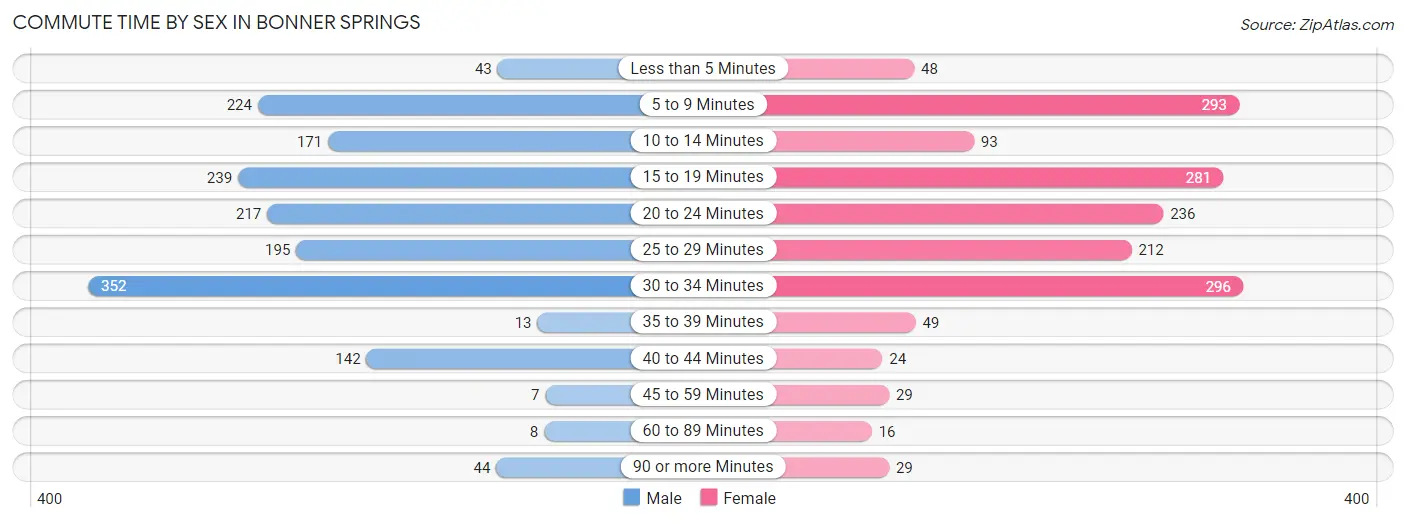
| Commute Time | Male | Female |
| Less than 5 Minutes | 43 (2.6%) | 48 (3.0%) |
| 5 to 9 Minutes | 224 (13.5%) | 293 (18.2%) |
| 10 to 14 Minutes | 171 (10.3%) | 93 (5.8%) |
| 15 to 19 Minutes | 239 (14.4%) | 281 (17.5%) |
| 20 to 24 Minutes | 217 (13.1%) | 236 (14.7%) |
| 25 to 29 Minutes | 195 (11.8%) | 212 (13.2%) |
| 30 to 34 Minutes | 352 (21.3%) | 296 (18.4%) |
| 35 to 39 Minutes | 13 (0.8%) | 49 (3.0%) |
| 40 to 44 Minutes | 142 (8.6%) | 24 (1.5%) |
| 45 to 59 Minutes | 7 (0.4%) | 29 (1.8%) |
| 60 to 89 Minutes | 8 (0.5%) | 16 (1.0%) |
| 90 or more Minutes | 44 (2.7%) | 29 (1.8%) |
Time of Departure to Work by Sex in Bonner Springs
The most frequent times of departure to work in Bonner Springs are 7:00 AM to 7:29 AM (384, 23.2%) for males and 7:30 AM to 7:59 AM (306, 19.1%) for females.
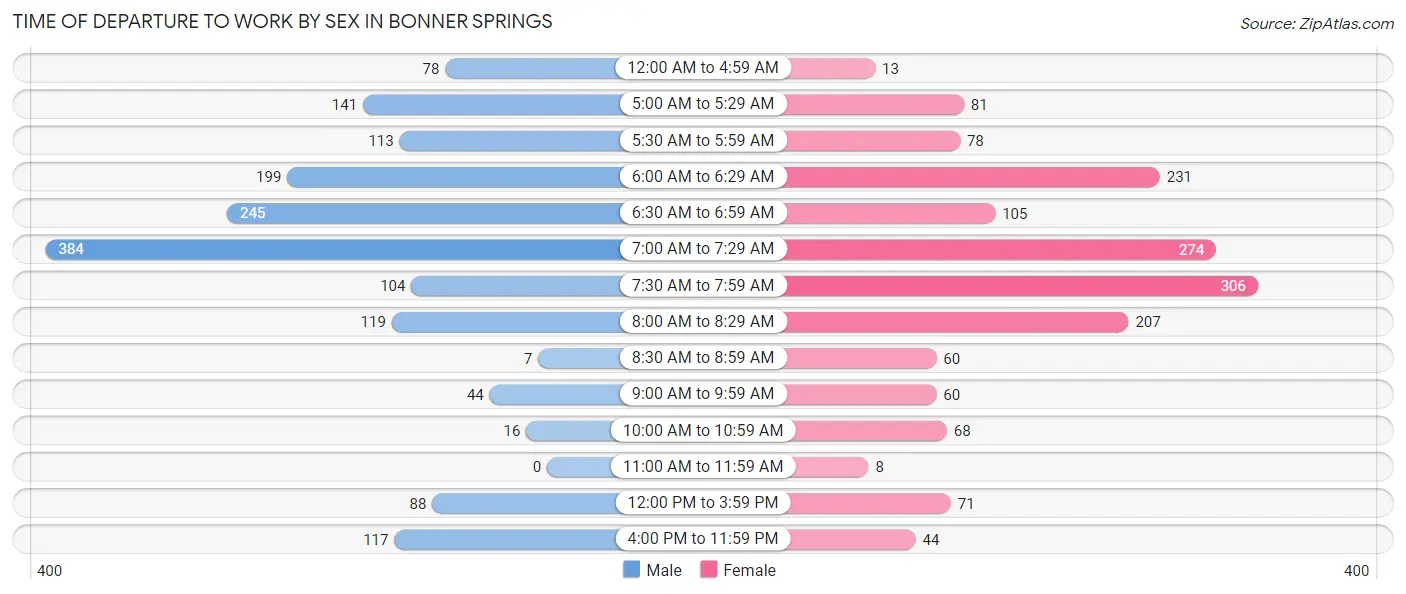
| Time of Departure | Male | Female |
| 12:00 AM to 4:59 AM | 78 (4.7%) | 13 (0.8%) |
| 5:00 AM to 5:29 AM | 141 (8.5%) | 81 (5.0%) |
| 5:30 AM to 5:59 AM | 113 (6.8%) | 78 (4.9%) |
| 6:00 AM to 6:29 AM | 199 (12.0%) | 231 (14.4%) |
| 6:30 AM to 6:59 AM | 245 (14.8%) | 105 (6.5%) |
| 7:00 AM to 7:29 AM | 384 (23.2%) | 274 (17.1%) |
| 7:30 AM to 7:59 AM | 104 (6.3%) | 306 (19.1%) |
| 8:00 AM to 8:29 AM | 119 (7.2%) | 207 (12.9%) |
| 8:30 AM to 8:59 AM | 7 (0.4%) | 60 (3.7%) |
| 9:00 AM to 9:59 AM | 44 (2.7%) | 60 (3.7%) |
| 10:00 AM to 10:59 AM | 16 (1.0%) | 68 (4.2%) |
| 11:00 AM to 11:59 AM | 0 (0.0%) | 8 (0.5%) |
| 12:00 PM to 3:59 PM | 88 (5.3%) | 71 (4.4%) |
| 4:00 PM to 11:59 PM | 117 (7.1%) | 44 (2.7%) |
| Total | 1,655 (100.0%) | 1,606 (100.0%) |
Housing Occupancy in Bonner Springs
Occupancy by Ownership in Bonner Springs
Of the total 2,730 dwellings in Bonner Springs, owner-occupied units account for 2,002 (73.3%), while renter-occupied units make up 728 (26.7%).
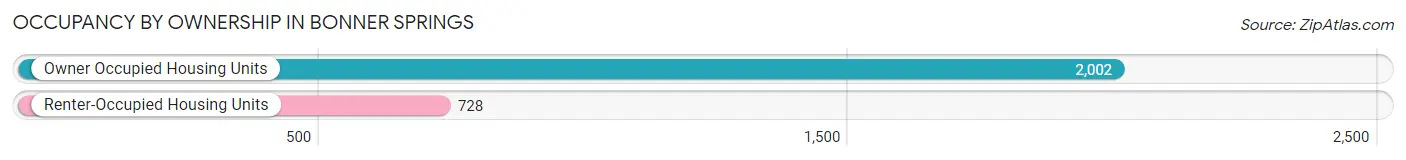
| Occupancy | # Housing Units | % Housing Units |
| Owner Occupied Housing Units | 2,002 | 73.3% |
| Renter-Occupied Housing Units | 728 | 26.7% |
| Total Occupied Housing Units | 2,730 | 100.0% |
Occupancy by Household Size in Bonner Springs
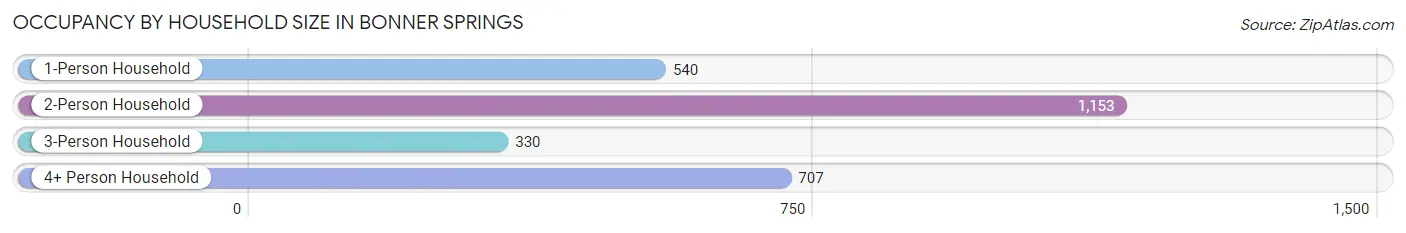
| Household Size | # Housing Units | % Housing Units |
| 1-Person Household | 540 | 19.8% |
| 2-Person Household | 1,153 | 42.2% |
| 3-Person Household | 330 | 12.1% |
| 4+ Person Household | 707 | 25.9% |
| Total Housing Units | 2,730 | 100.0% |
Occupancy by Ownership by Household Size in Bonner Springs
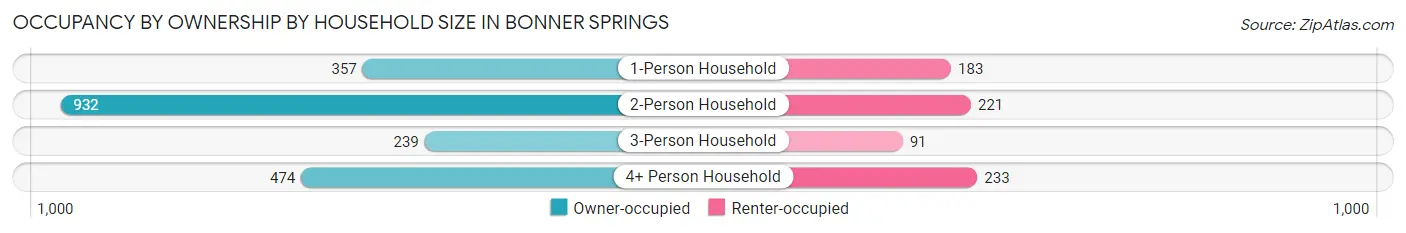
| Household Size | Owner-occupied | Renter-occupied |
| 1-Person Household | 357 (66.1%) | 183 (33.9%) |
| 2-Person Household | 932 (80.8%) | 221 (19.2%) |
| 3-Person Household | 239 (72.4%) | 91 (27.6%) |
| 4+ Person Household | 474 (67.0%) | 233 (33.0%) |
| Total Housing Units | 2,002 (73.3%) | 728 (26.7%) |
Occupancy by Educational Attainment in Bonner Springs
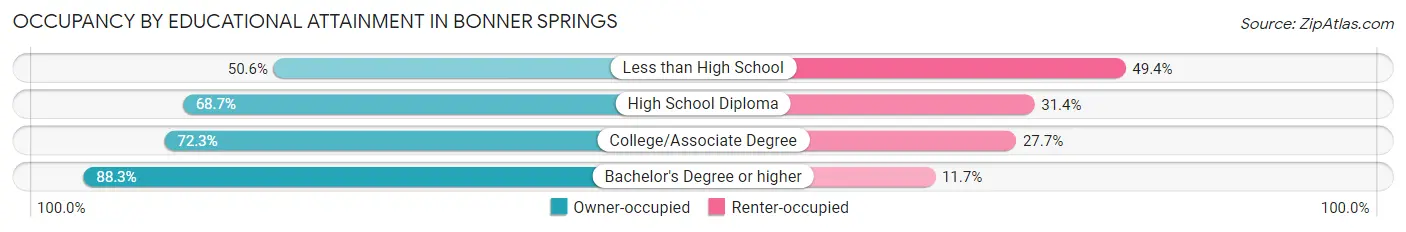
| Household Size | Owner-occupied | Renter-occupied |
| Less than High School | 85 (50.6%) | 83 (49.4%) |
| High School Diploma | 749 (68.6%) | 342 (31.4%) |
| College/Associate Degree | 592 (72.3%) | 227 (27.7%) |
| Bachelor's Degree or higher | 576 (88.3%) | 76 (11.7%) |
Occupancy by Age of Householder in Bonner Springs
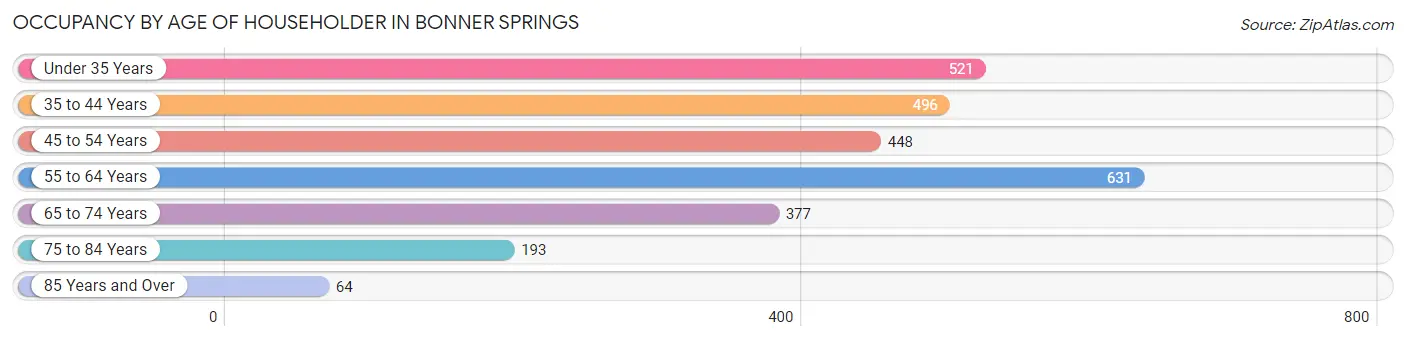
| Age Bracket | # Households | % Households |
| Under 35 Years | 521 | 19.1% |
| 35 to 44 Years | 496 | 18.2% |
| 45 to 54 Years | 448 | 16.4% |
| 55 to 64 Years | 631 | 23.1% |
| 65 to 74 Years | 377 | 13.8% |
| 75 to 84 Years | 193 | 7.1% |
| 85 Years and Over | 64 | 2.3% |
| Total | 2,730 | 100.0% |
Housing Finances in Bonner Springs
Median Income by Occupancy in Bonner Springs
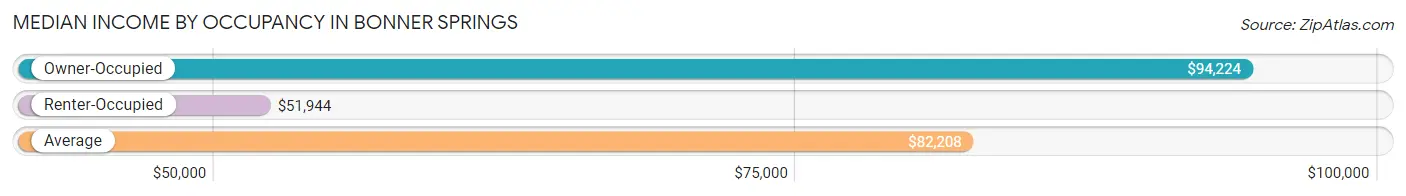
| Occupancy Type | # Households | Median Income |
| Owner-Occupied | 2,002 (73.3%) | $94,224 |
| Renter-Occupied | 728 (26.7%) | $51,944 |
| Average | 2,730 (100.0%) | $82,208 |
Occupancy by Householder Income Bracket in Bonner Springs
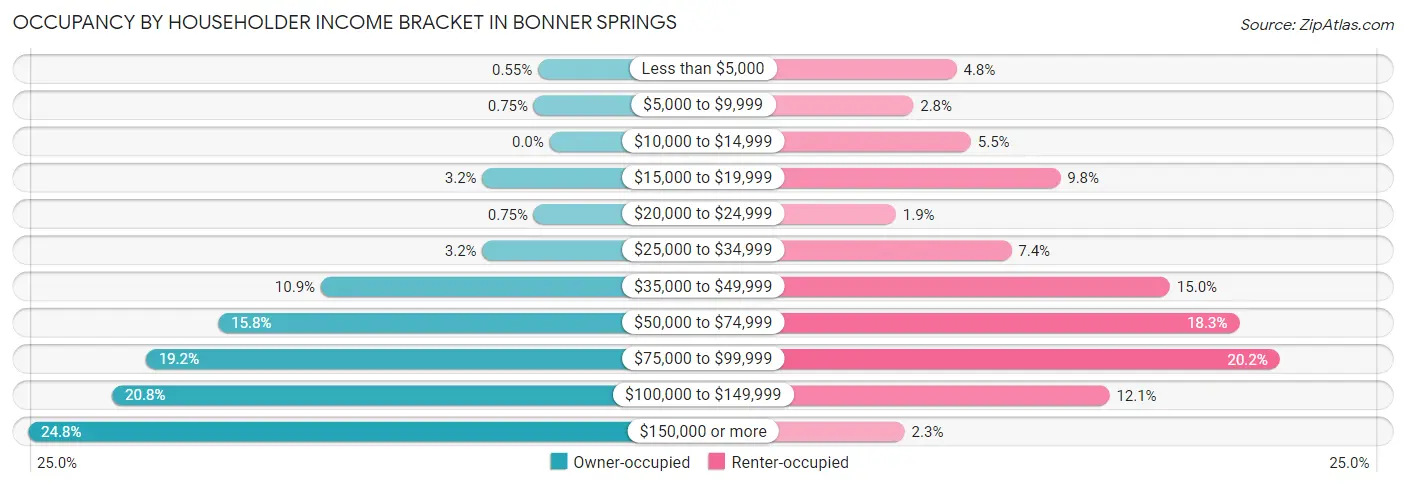
| Income Bracket | Owner-occupied | Renter-occupied |
| Less than $5,000 | 11 (0.5%) | 35 (4.8%) |
| $5,000 to $9,999 | 15 (0.7%) | 20 (2.8%) |
| $10,000 to $14,999 | 0 (0.0%) | 40 (5.5%) |
| $15,000 to $19,999 | 64 (3.2%) | 71 (9.8%) |
| $20,000 to $24,999 | 15 (0.7%) | 14 (1.9%) |
| $25,000 to $34,999 | 64 (3.2%) | 54 (7.4%) |
| $35,000 to $49,999 | 218 (10.9%) | 109 (15.0%) |
| $50,000 to $74,999 | 316 (15.8%) | 133 (18.3%) |
| $75,000 to $99,999 | 385 (19.2%) | 147 (20.2%) |
| $100,000 to $149,999 | 417 (20.8%) | 88 (12.1%) |
| $150,000 or more | 497 (24.8%) | 17 (2.3%) |
| Total | 2,002 (100.0%) | 728 (100.0%) |
Monthly Housing Cost Tiers in Bonner Springs
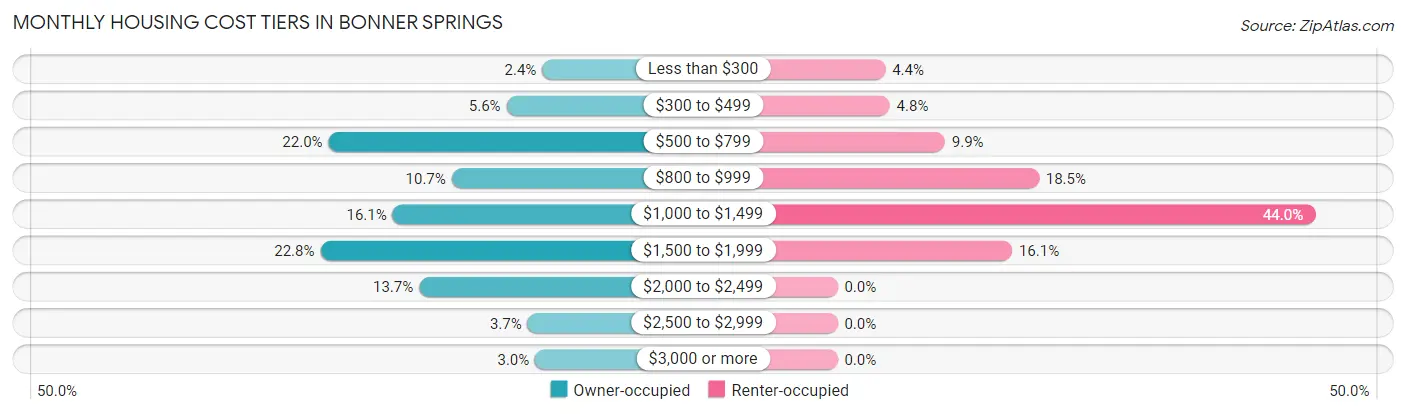
| Monthly Cost | Owner-occupied | Renter-occupied |
| Less than $300 | 47 (2.4%) | 32 (4.4%) |
| $300 to $499 | 113 (5.6%) | 35 (4.8%) |
| $500 to $799 | 441 (22.0%) | 72 (9.9%) |
| $800 to $999 | 214 (10.7%) | 135 (18.5%) |
| $1,000 to $1,499 | 323 (16.1%) | 320 (44.0%) |
| $1,500 to $1,999 | 456 (22.8%) | 117 (16.1%) |
| $2,000 to $2,499 | 274 (13.7%) | 0 (0.0%) |
| $2,500 to $2,999 | 74 (3.7%) | 0 (0.0%) |
| $3,000 or more | 60 (3.0%) | 0 (0.0%) |
| Total | 2,002 (100.0%) | 728 (100.0%) |
Physical Housing Characteristics in Bonner Springs
Housing Structures in Bonner Springs
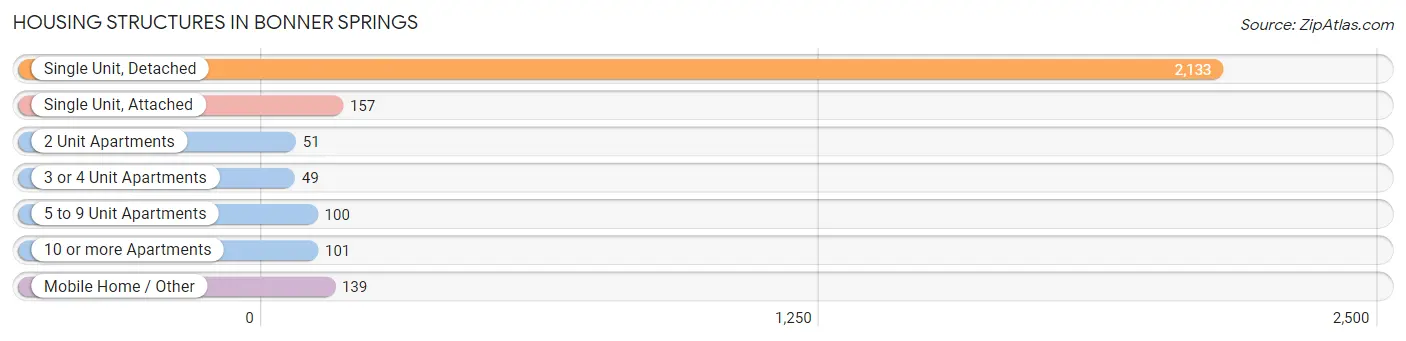
| Structure Type | # Housing Units | % Housing Units |
| Single Unit, Detached | 2,133 | 78.1% |
| Single Unit, Attached | 157 | 5.8% |
| 2 Unit Apartments | 51 | 1.9% |
| 3 or 4 Unit Apartments | 49 | 1.8% |
| 5 to 9 Unit Apartments | 100 | 3.7% |
| 10 or more Apartments | 101 | 3.7% |
| Mobile Home / Other | 139 | 5.1% |
| Total | 2,730 | 100.0% |
Housing Structures by Occupancy in Bonner Springs
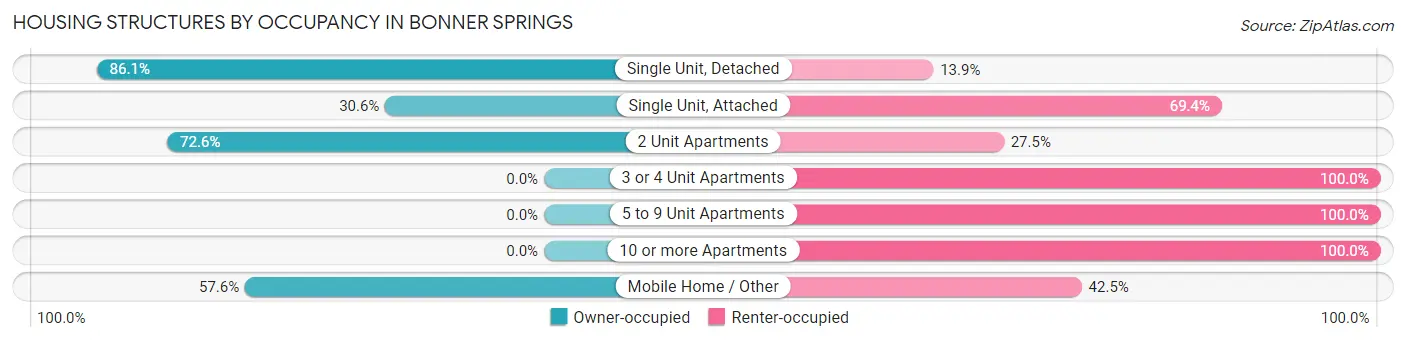
| Structure Type | Owner-occupied | Renter-occupied |
| Single Unit, Detached | 1,837 (86.1%) | 296 (13.9%) |
| Single Unit, Attached | 48 (30.6%) | 109 (69.4%) |
| 2 Unit Apartments | 37 (72.6%) | 14 (27.5%) |
| 3 or 4 Unit Apartments | 0 (0.0%) | 49 (100.0%) |
| 5 to 9 Unit Apartments | 0 (0.0%) | 100 (100.0%) |
| 10 or more Apartments | 0 (0.0%) | 101 (100.0%) |
| Mobile Home / Other | 80 (57.6%) | 59 (42.4%) |
| Total | 2,002 (73.3%) | 728 (26.7%) |
Housing Structures by Number of Rooms in Bonner Springs
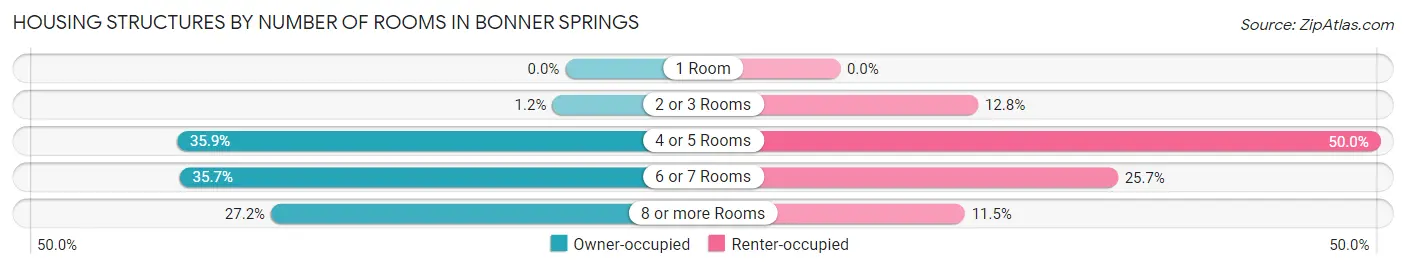
| Number of Rooms | Owner-occupied | Renter-occupied |
| 1 Room | 0 (0.0%) | 0 (0.0%) |
| 2 or 3 Rooms | 24 (1.2%) | 93 (12.8%) |
| 4 or 5 Rooms | 719 (35.9%) | 364 (50.0%) |
| 6 or 7 Rooms | 714 (35.7%) | 187 (25.7%) |
| 8 or more Rooms | 545 (27.2%) | 84 (11.5%) |
| Total | 2,002 (100.0%) | 728 (100.0%) |
Housing Structure by Heating Type in Bonner Springs
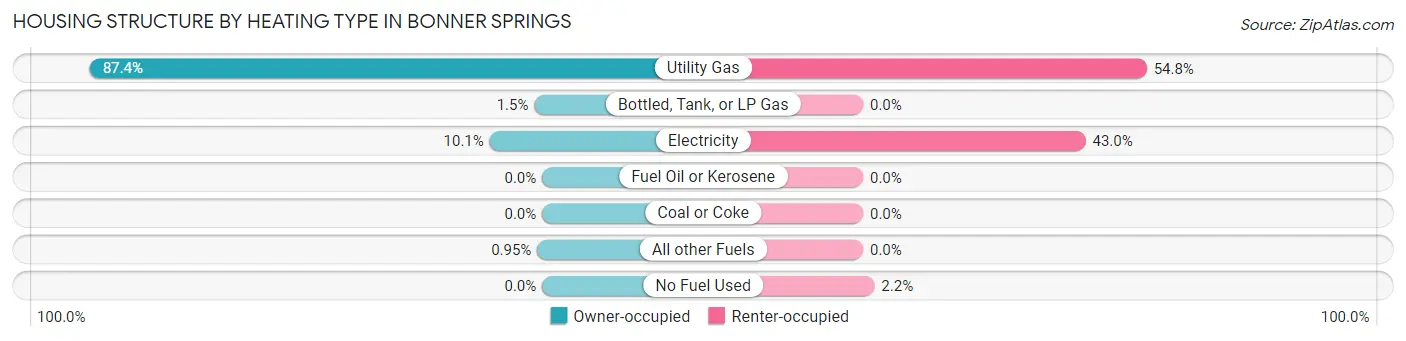
| Heating Type | Owner-occupied | Renter-occupied |
| Utility Gas | 1,750 (87.4%) | 399 (54.8%) |
| Bottled, Tank, or LP Gas | 30 (1.5%) | 0 (0.0%) |
| Electricity | 203 (10.1%) | 313 (43.0%) |
| Fuel Oil or Kerosene | 0 (0.0%) | 0 (0.0%) |
| Coal or Coke | 0 (0.0%) | 0 (0.0%) |
| All other Fuels | 19 (0.9%) | 0 (0.0%) |
| No Fuel Used | 0 (0.0%) | 16 (2.2%) |
| Total | 2,002 (100.0%) | 728 (100.0%) |
Household Vehicle Usage in Bonner Springs
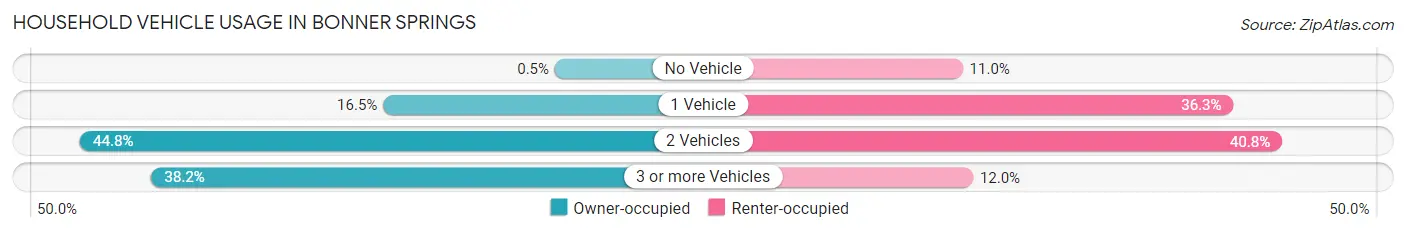
| Vehicles per Household | Owner-occupied | Renter-occupied |
| No Vehicle | 10 (0.5%) | 80 (11.0%) |
| 1 Vehicle | 331 (16.5%) | 264 (36.3%) |
| 2 Vehicles | 897 (44.8%) | 297 (40.8%) |
| 3 or more Vehicles | 764 (38.2%) | 87 (11.9%) |
| Total | 2,002 (100.0%) | 728 (100.0%) |
Real Estate & Mortgages in Bonner Springs
Real Estate and Mortgage Overview in Bonner Springs
| Characteristic | Without Mortgage | With Mortgage |
| Housing Units | 799 | 1,203 |
| Median Property Value | $179,200 | $221,500 |
| Median Household Income | $65,644 | $438 |
| Monthly Housing Costs | $682 | $60 |
| Real Estate Taxes | $3,173 | $33 |
Property Value by Mortgage Status in Bonner Springs
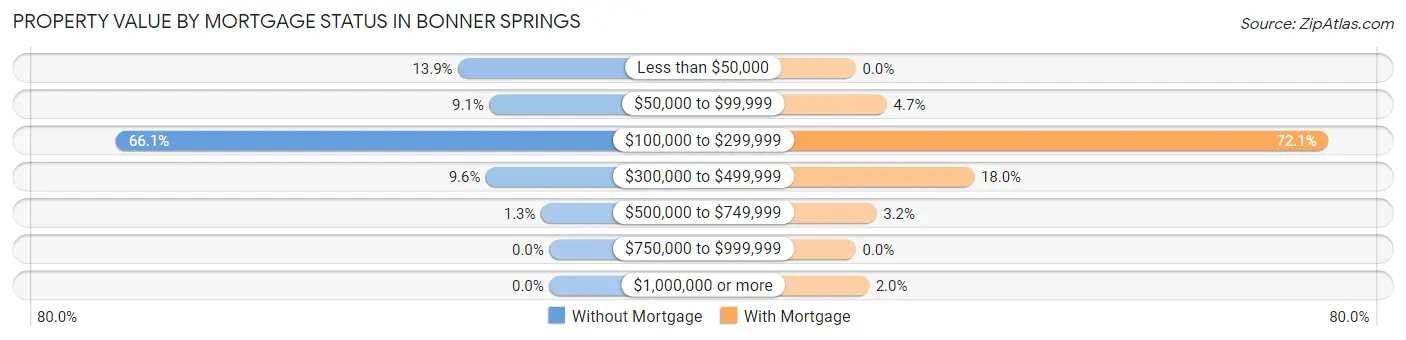
| Property Value | Without Mortgage | With Mortgage |
| Less than $50,000 | 111 (13.9%) | 0 (0.0%) |
| $50,000 to $99,999 | 73 (9.1%) | 57 (4.7%) |
| $100,000 to $299,999 | 528 (66.1%) | 867 (72.1%) |
| $300,000 to $499,999 | 77 (9.6%) | 217 (18.0%) |
| $500,000 to $749,999 | 10 (1.3%) | 38 (3.2%) |
| $750,000 to $999,999 | 0 (0.0%) | 0 (0.0%) |
| $1,000,000 or more | 0 (0.0%) | 24 (2.0%) |
| Total | 799 (100.0%) | 1,203 (100.0%) |
Household Income by Mortgage Status in Bonner Springs
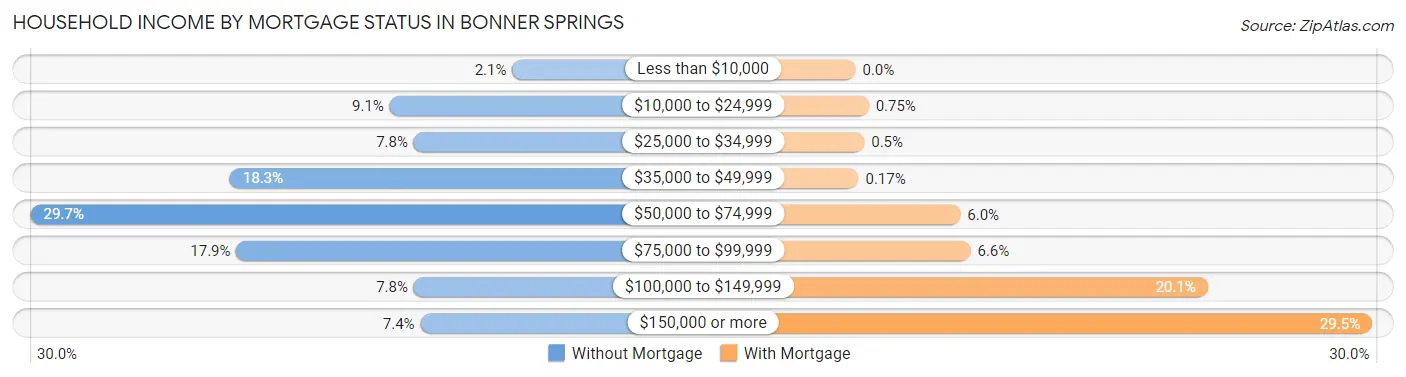
| Household Income | Without Mortgage | With Mortgage |
| Less than $10,000 | 17 (2.1%) | 0 (0.0%) |
| $10,000 to $24,999 | 73 (9.1%) | 9 (0.7%) |
| $25,000 to $34,999 | 62 (7.8%) | 6 (0.5%) |
| $35,000 to $49,999 | 146 (18.3%) | 2 (0.2%) |
| $50,000 to $74,999 | 237 (29.7%) | 72 (6.0%) |
| $75,000 to $99,999 | 143 (17.9%) | 79 (6.6%) |
| $100,000 to $149,999 | 62 (7.8%) | 242 (20.1%) |
| $150,000 or more | 59 (7.4%) | 355 (29.5%) |
| Total | 799 (100.0%) | 1,203 (100.0%) |
Property Value to Household Income Ratio in Bonner Springs
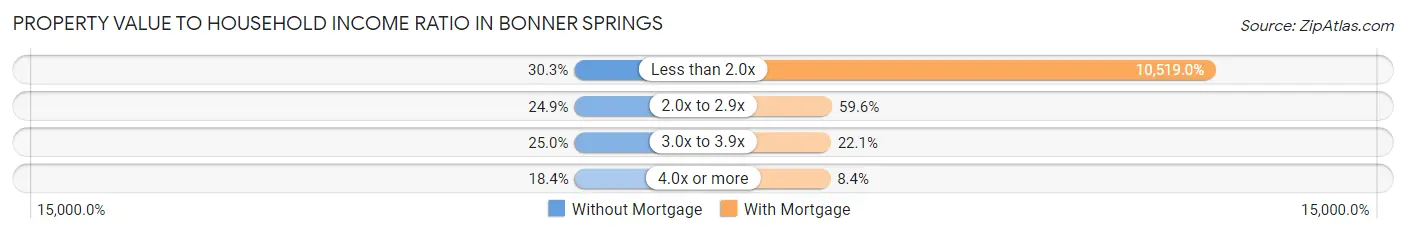
| Value-to-Income Ratio | Without Mortgage | With Mortgage |
| Less than 2.0x | 242 (30.3%) | 126,544 (10,519.0%) |
| 2.0x to 2.9x | 199 (24.9%) | 717 (59.6%) |
| 3.0x to 3.9x | 200 (25.0%) | 266 (22.1%) |
| 4.0x or more | 147 (18.4%) | 101 (8.4%) |
| Total | 799 (100.0%) | 1,203 (100.0%) |
Real Estate Taxes by Mortgage Status in Bonner Springs
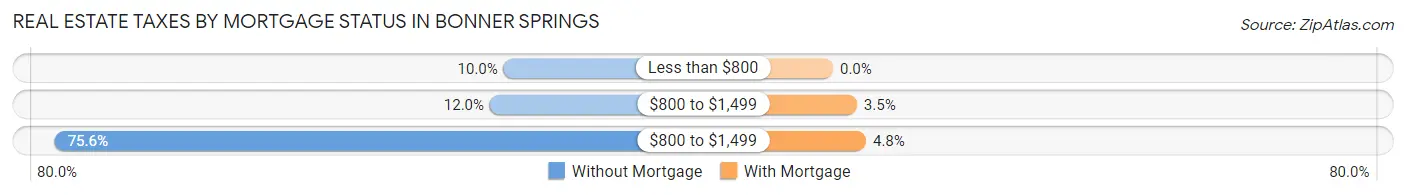
| Property Taxes | Without Mortgage | With Mortgage |
| Less than $800 | 80 (10.0%) | 0 (0.0%) |
| $800 to $1,499 | 96 (12.0%) | 42 (3.5%) |
| $800 to $1,499 | 604 (75.6%) | 58 (4.8%) |
| Total | 799 (100.0%) | 1,203 (100.0%) |
Health & Disability in Bonner Springs
Health Insurance Coverage by Age in Bonner Springs
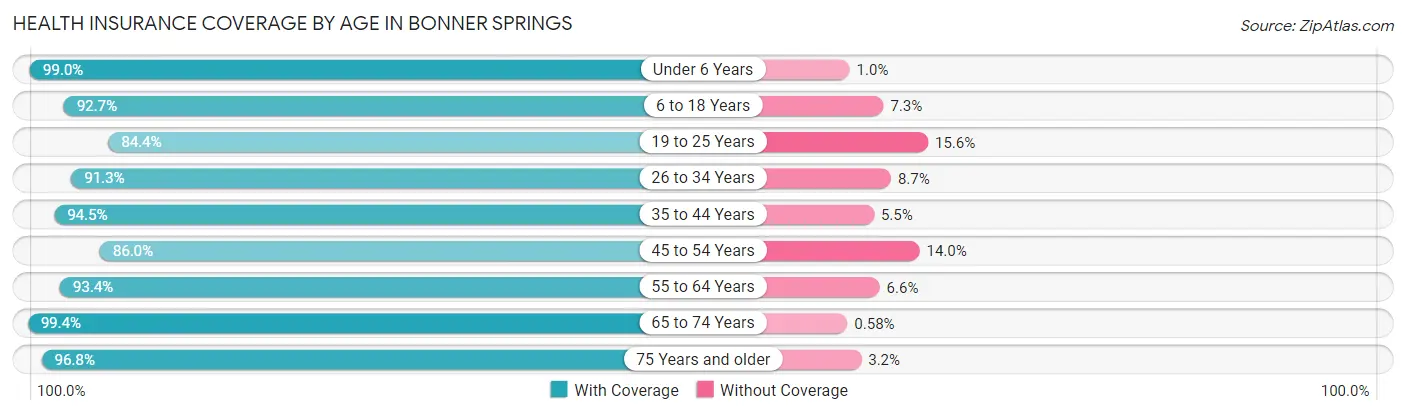
| Age Bracket | With Coverage | Without Coverage |
| Under 6 Years | 792 (99.0%) | 8 (1.0%) |
| 6 to 18 Years | 1,537 (92.7%) | 121 (7.3%) |
| 19 to 25 Years | 335 (84.4%) | 62 (15.6%) |
| 26 to 34 Years | 838 (91.3%) | 80 (8.7%) |
| 35 to 44 Years | 752 (94.5%) | 44 (5.5%) |
| 45 to 54 Years | 692 (86.0%) | 113 (14.0%) |
| 55 to 64 Years | 1,233 (93.4%) | 87 (6.6%) |
| 65 to 74 Years | 682 (99.4%) | 4 (0.6%) |
| 75 Years and older | 336 (96.8%) | 11 (3.2%) |
| Total | 7,197 (93.1%) | 530 (6.9%) |
Health Insurance Coverage by Citizenship Status in Bonner Springs
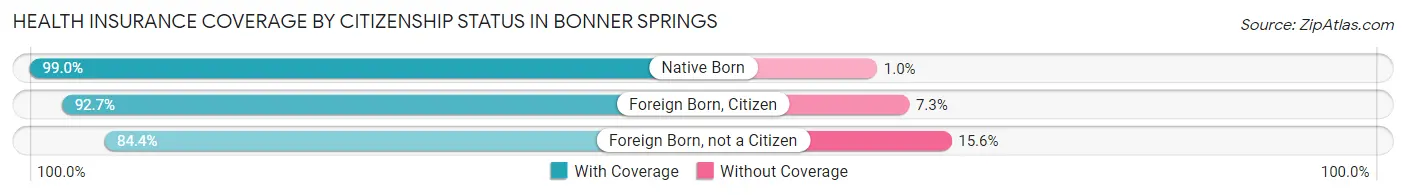
| Citizenship Status | With Coverage | Without Coverage |
| Native Born | 792 (99.0%) | 8 (1.0%) |
| Foreign Born, Citizen | 1,537 (92.7%) | 121 (7.3%) |
| Foreign Born, not a Citizen | 335 (84.4%) | 62 (15.6%) |
Health Insurance Coverage by Household Income in Bonner Springs
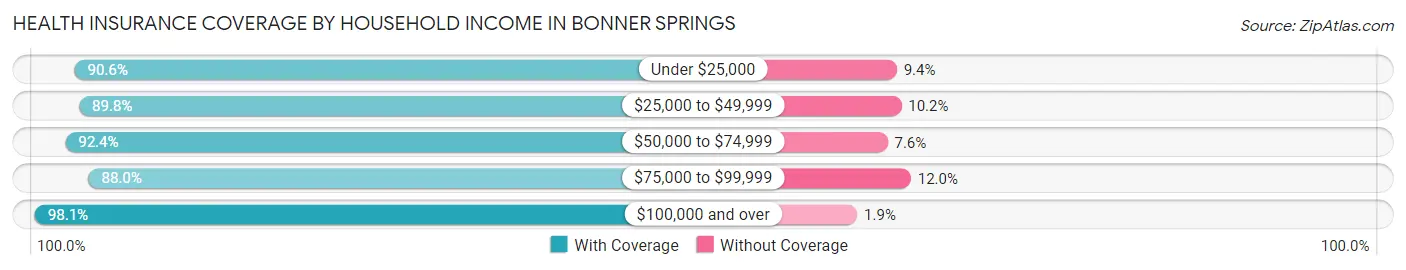
| Household Income | With Coverage | Without Coverage |
| Under $25,000 | 339 (90.6%) | 35 (9.4%) |
| $25,000 to $49,999 | 1,196 (89.8%) | 136 (10.2%) |
| $50,000 to $74,999 | 1,102 (92.4%) | 91 (7.6%) |
| $75,000 to $99,999 | 1,527 (88.0%) | 208 (12.0%) |
| $100,000 and over | 3,027 (98.1%) | 60 (1.9%) |
Public vs Private Health Insurance Coverage by Age in Bonner Springs
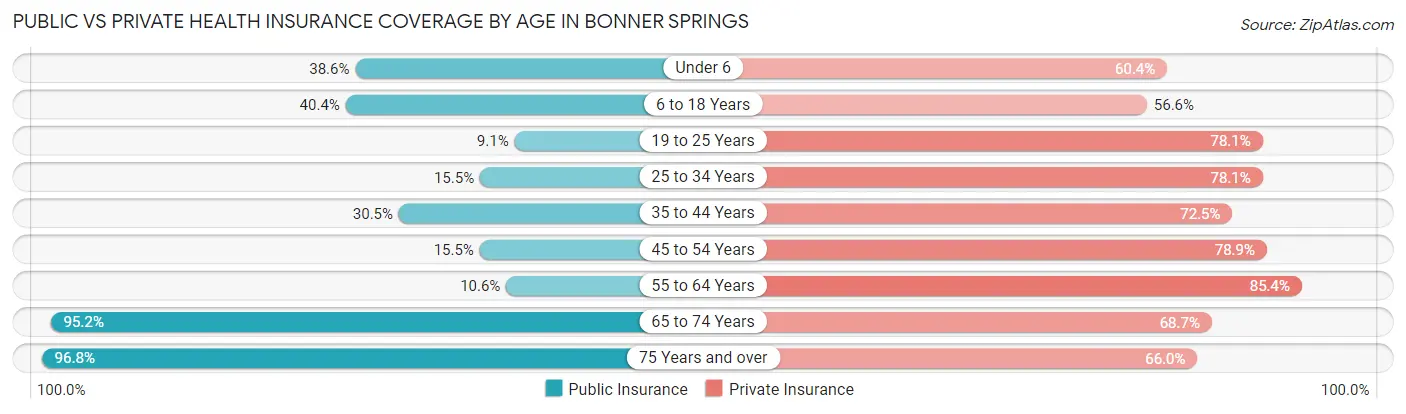
| Age Bracket | Public Insurance | Private Insurance |
| Under 6 | 309 (38.6%) | 483 (60.4%) |
| 6 to 18 Years | 670 (40.4%) | 939 (56.6%) |
| 19 to 25 Years | 36 (9.1%) | 310 (78.1%) |
| 25 to 34 Years | 142 (15.5%) | 717 (78.1%) |
| 35 to 44 Years | 243 (30.5%) | 577 (72.5%) |
| 45 to 54 Years | 125 (15.5%) | 635 (78.9%) |
| 55 to 64 Years | 140 (10.6%) | 1,127 (85.4%) |
| 65 to 74 Years | 653 (95.2%) | 471 (68.7%) |
| 75 Years and over | 336 (96.8%) | 229 (66.0%) |
| Total | 2,654 (34.4%) | 5,488 (71.0%) |
Disability Status by Sex by Age in Bonner Springs
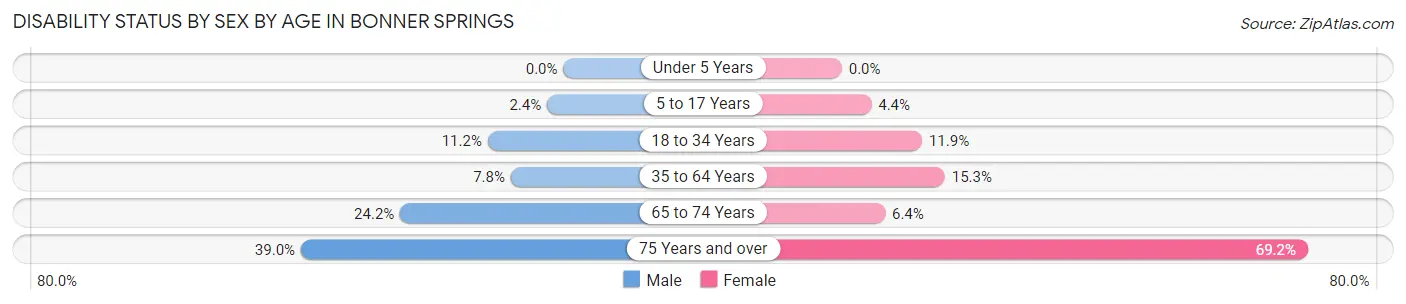
| Age Bracket | Male | Female |
| Under 5 Years | 0 (0.0%) | 0 (0.0%) |
| 5 to 17 Years | 22 (2.4%) | 33 (4.4%) |
| 18 to 34 Years | 73 (11.2%) | 94 (11.9%) |
| 35 to 64 Years | 110 (7.8%) | 231 (15.3%) |
| 65 to 74 Years | 87 (24.2%) | 21 (6.4%) |
| 75 Years and over | 53 (39.0%) | 146 (69.2%) |
Disability Class by Sex by Age in Bonner Springs
Disability Class: Hearing Difficulty
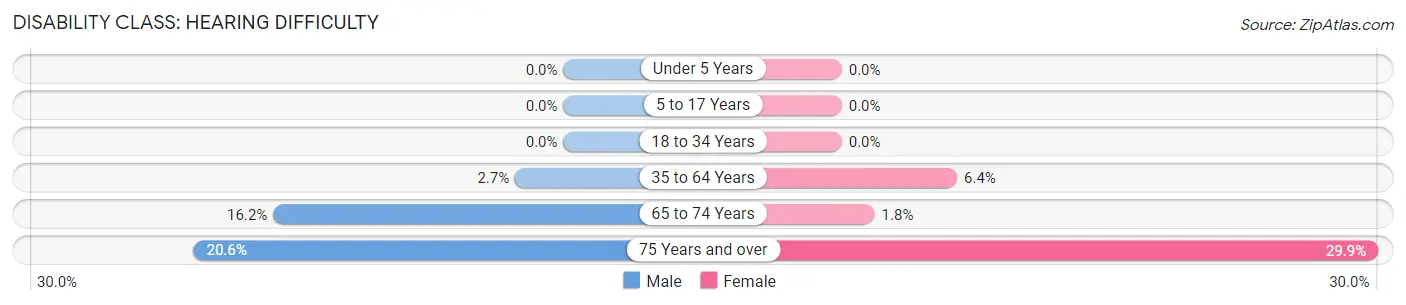
| Age Bracket | Male | Female |
| Under 5 Years | 0 (0.0%) | 0 (0.0%) |
| 5 to 17 Years | 0 (0.0%) | 0 (0.0%) |
| 18 to 34 Years | 0 (0.0%) | 0 (0.0%) |
| 35 to 64 Years | 38 (2.7%) | 97 (6.4%) |
| 65 to 74 Years | 58 (16.2%) | 6 (1.8%) |
| 75 Years and over | 28 (20.6%) | 63 (29.9%) |
Disability Class: Vision Difficulty
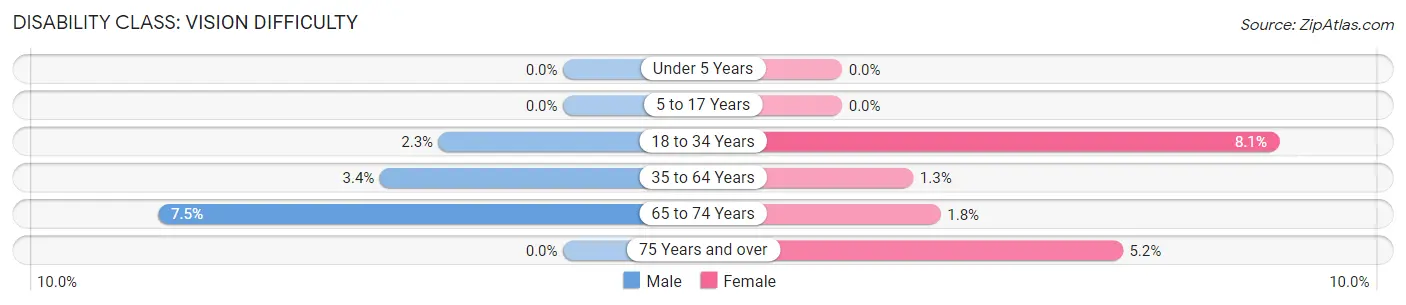
| Age Bracket | Male | Female |
| Under 5 Years | 0 (0.0%) | 0 (0.0%) |
| 5 to 17 Years | 0 (0.0%) | 0 (0.0%) |
| 18 to 34 Years | 15 (2.3%) | 64 (8.1%) |
| 35 to 64 Years | 48 (3.4%) | 20 (1.3%) |
| 65 to 74 Years | 27 (7.5%) | 6 (1.8%) |
| 75 Years and over | 0 (0.0%) | 11 (5.2%) |
Disability Class: Cognitive Difficulty
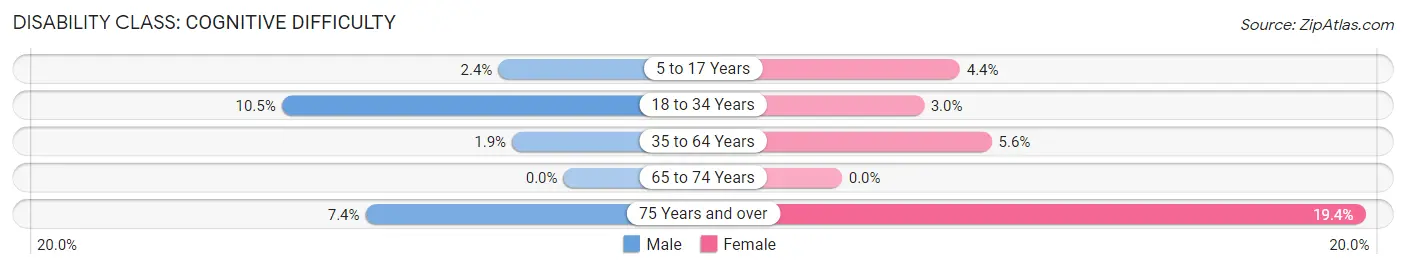
| Age Bracket | Male | Female |
| 5 to 17 Years | 22 (2.4%) | 33 (4.4%) |
| 18 to 34 Years | 68 (10.5%) | 24 (3.0%) |
| 35 to 64 Years | 27 (1.9%) | 84 (5.6%) |
| 65 to 74 Years | 0 (0.0%) | 0 (0.0%) |
| 75 Years and over | 10 (7.3%) | 41 (19.4%) |
Disability Class: Ambulatory Difficulty
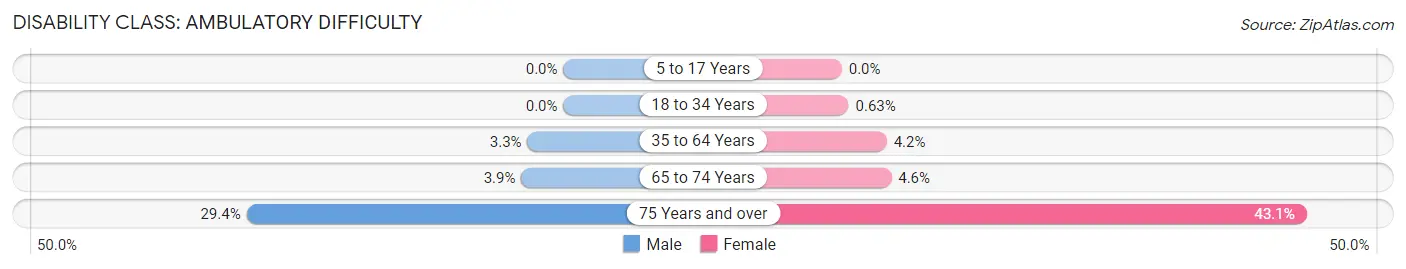
| Age Bracket | Male | Female |
| 5 to 17 Years | 0 (0.0%) | 0 (0.0%) |
| 18 to 34 Years | 0 (0.0%) | 5 (0.6%) |
| 35 to 64 Years | 47 (3.3%) | 63 (4.2%) |
| 65 to 74 Years | 14 (3.9%) | 15 (4.6%) |
| 75 Years and over | 40 (29.4%) | 91 (43.1%) |
Disability Class: Self-Care Difficulty

| Age Bracket | Male | Female |
| 5 to 17 Years | 0 (0.0%) | 0 (0.0%) |
| 18 to 34 Years | 39 (6.0%) | 0 (0.0%) |
| 35 to 64 Years | 31 (2.2%) | 82 (5.4%) |
| 65 to 74 Years | 12 (3.3%) | 0 (0.0%) |
| 75 Years and over | 10 (7.3%) | 43 (20.4%) |
Technology Access in Bonner Springs
Computing Device Access in Bonner Springs
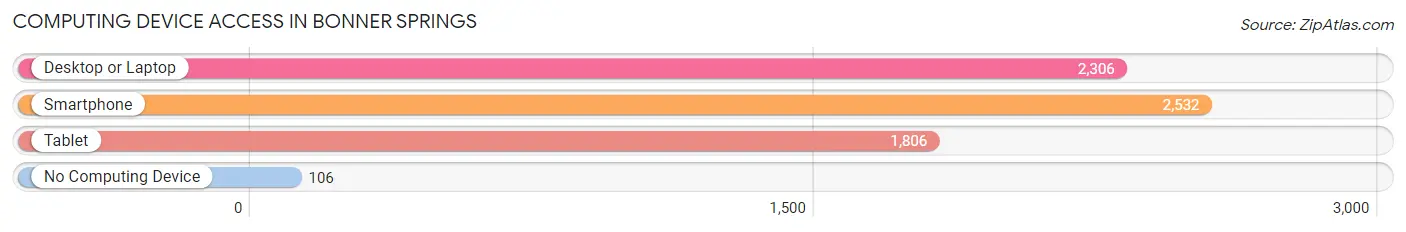
| Device Type | # Households | % Households |
| Desktop or Laptop | 2,306 | 84.5% |
| Smartphone | 2,532 | 92.7% |
| Tablet | 1,806 | 66.1% |
| No Computing Device | 106 | 3.9% |
| Total | 2,730 | 100.0% |
Internet Access in Bonner Springs
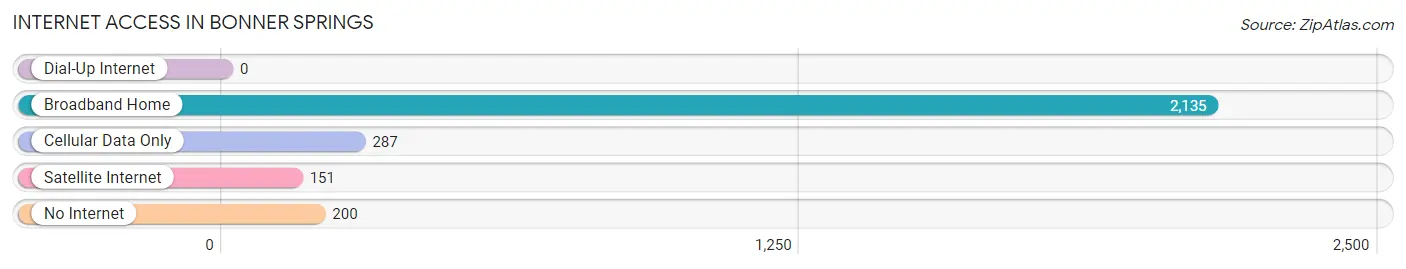
| Internet Type | # Households | % Households |
| Dial-Up Internet | 0 | 0.0% |
| Broadband Home | 2,135 | 78.2% |
| Cellular Data Only | 287 | 10.5% |
| Satellite Internet | 151 | 5.5% |
| No Internet | 200 | 7.3% |
| Total | 2,730 | 100.0% |
Bonner Springs Summary
Bonner Springs, Kansas is a small city located in Wyandotte County, Kansas, United States. It is situated along the Kansas River, approximately 15 miles west of Kansas City, Missouri. The city has a population of approximately 7,500 people and is part of the Kansas City metropolitan area.
History
The area that is now Bonner Springs was originally inhabited by the Kansa Native American tribe. The first European settlers arrived in the area in the early 1800s. The city was founded in 1812 by William Bonner, a settler from Kentucky. Bonner named the city after himself and established a trading post and ferry service on the Kansas River.
In 1855, the city was incorporated and the first post office was established. The city grew rapidly during the late 19th century, and by the early 20th century, it had become a popular tourist destination. The city was home to several amusement parks, including Electric Park, which opened in 1906 and was one of the first amusement parks in the United States.
Geography
Bonner Springs is located in Wyandotte County, Kansas, approximately 15 miles west of Kansas City, Missouri. The city is situated along the Kansas River and is bordered by Edwardsville to the north, Basehor to the east, and Kansas City, Kansas to the south. The city has a total area of 8.3 square miles, all of which is land.
The climate in Bonner Springs is classified as humid continental, with hot, humid summers and cold, dry winters. The average temperature in the summer is around 80°F, and the average temperature in the winter is around 30°F. The city receives an average of 40 inches of precipitation per year.
Economy
The economy of Bonner Springs is largely based on manufacturing and retail. The city is home to several manufacturing companies, including the Bonner Springs Manufacturing Company, which produces automotive parts, and the Bonner Springs Canning Company, which produces canned fruits and vegetables. The city is also home to several retail stores, including Walmart, Target, and Home Depot.
The city is also home to several restaurants, including the popular Mexican restaurant El Maguey. The city is also home to several parks, including the Bonner Springs City Park, which features a lake, walking trails, and a playground.
Demographics
As of the 2010 census, the population of Bonner Springs was 7,314. The racial makeup of the city was 87.3% White, 5.3% African American, 0.7% Native American, 1.2% Asian, 0.1% Pacific Islander, 2.2% from other races, and 3.2% from two or more races. Hispanic or Latino of any race were 6.3% of the population.
The median household income in Bonner Springs was $50,945, and the median family income was $60,917. The per capita income for the city was $22,945. About 8.3% of families and 10.2% of the population were below the poverty line, including 14.2% of those under age 18 and 6.2% of those age 65 or over.
Common Questions
What is Per Capita Income in Bonner Springs?
Per Capita income in Bonner Springs is $35,284.
What is the Median Family Income in Bonner Springs?
Median Family Income in Bonner Springs is $95,388.
What is the Median Household income in Bonner Springs?
Median Household Income in Bonner Springs is $82,208.
What is Income or Wage Gap in Bonner Springs?
Income or Wage Gap in Bonner Springs is 29.5%.
Women in Bonner Springs earn 70.5 cents for every dollar earned by a man.
What is Family Income Deficit in Bonner Springs?
Family Income Deficit in Bonner Springs is $9,207.
Families that are below poverty line in Bonner Springs earn $9,207 less on average than the poverty threshold level.
What is Inequality or Gini Index in Bonner Springs?
Inequality or Gini Index in Bonner Springs is 0.38.
What is the Total Population of Bonner Springs?
Total Population of Bonner Springs is 7,770.
What is the Total Male Population of Bonner Springs?
Total Male Population of Bonner Springs is 3,801.
What is the Total Female Population of Bonner Springs?
Total Female Population of Bonner Springs is 3,969.
What is the Ratio of Males per 100 Females in Bonner Springs?
There are 95.77 Males per 100 Females in Bonner Springs.
What is the Ratio of Females per 100 Males in Bonner Springs?
There are 104.42 Females per 100 Males in Bonner Springs.
What is the Median Population Age in Bonner Springs?
Median Population Age in Bonner Springs is 36.6 Years.
What is the Average Family Size in Bonner Springs
Average Family Size in Bonner Springs is 3.3 People.
What is the Average Household Size in Bonner Springs
Average Household Size in Bonner Springs is 2.8 People.
How Large is the Labor Force in Bonner Springs?
There are 3,806 People in the Labor Forcein in Bonner Springs.
What is the Percentage of People in the Labor Force in Bonner Springs?
67.2% of People are in the Labor Force in Bonner Springs.
What is the Unemployment Rate in Bonner Springs?
Unemployment Rate in Bonner Springs is 2.5%.