Sedgwick, KS Map & Demographics
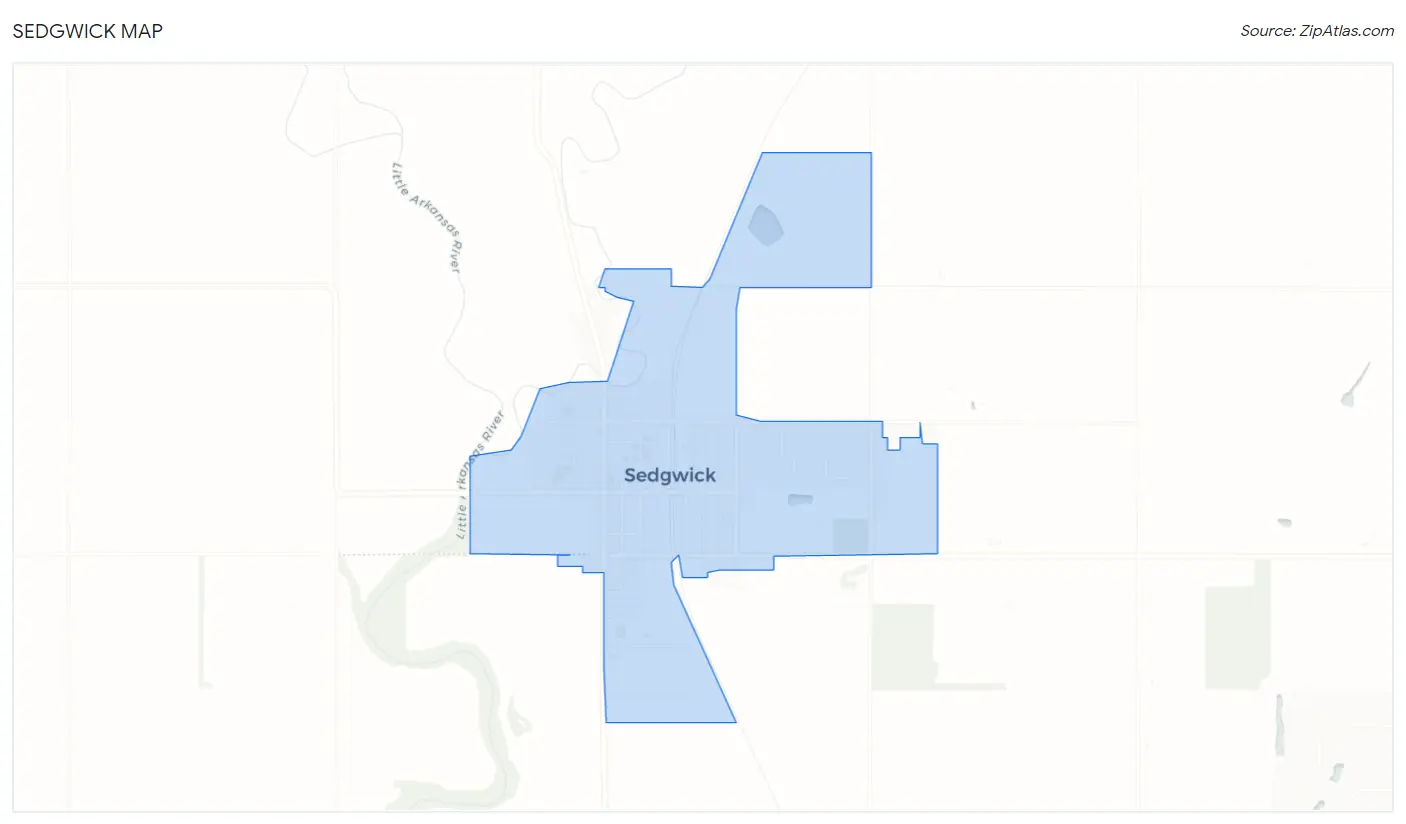
Sedgwick Map
Sedgwick Overview
$35,744
PER CAPITA INCOME
$98,250
AVG FAMILY INCOME
$78,846
AVG HOUSEHOLD INCOME
42.8%
WAGE / INCOME GAP [ % ]
57.2¢/ $1
WAGE / INCOME GAP [ $ ]
0.38
INEQUALITY / GINI INDEX
1,465
TOTAL POPULATION
727
MALE POPULATION
738
FEMALE POPULATION
98.51
MALES / 100 FEMALES
101.51
FEMALES / 100 MALES
38.4
MEDIAN AGE
3.0
AVG FAMILY SIZE
2.6
AVG HOUSEHOLD SIZE
694
LABOR FORCE [ PEOPLE ]
62.2%
PERCENT IN LABOR FORCE
1.0%
UNEMPLOYMENT RATE
Sedgwick Zip Codes
Sedgwick Area Codes
Income in Sedgwick
Income Overview in Sedgwick
Per Capita Income in Sedgwick is $35,744, while median incomes of families and households are $98,250 and $78,846 respectively.
| Characteristic | Number | Measure |
| Per Capita Income | 1,465 | $35,744 |
| Median Family Income | 385 | $98,250 |
| Mean Family Income | 385 | $103,043 |
| Median Household Income | 546 | $78,846 |
| Mean Household Income | 546 | $85,460 |
| Income Deficit | 385 | $0 |
| Wage / Income Gap (%) | 1,465 | 42.82% |
| Wage / Income Gap ($) | 1,465 | 57.18¢ per $1 |
| Gini / Inequality Index | 1,465 | 0.38 |
Earnings by Sex in Sedgwick
Average Earnings in Sedgwick are $46,816, $59,750 for men and $34,167 for women, a difference of 42.8%.
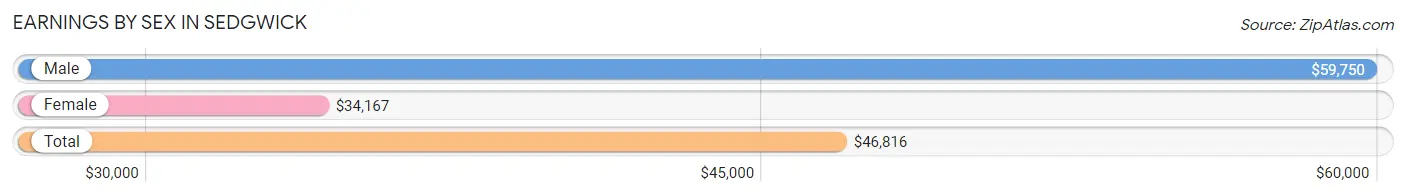
| Sex | Number | Average Earnings |
| Male | 425 (55.8%) | $59,750 |
| Female | 336 (44.2%) | $34,167 |
| Total | 761 (100.0%) | $46,816 |
Earnings by Sex by Income Bracket in Sedgwick
The most common earnings brackets in Sedgwick are $100,000+ for men (69 | 16.2%) and $25,000 to $29,999 for women (51 | 15.2%).
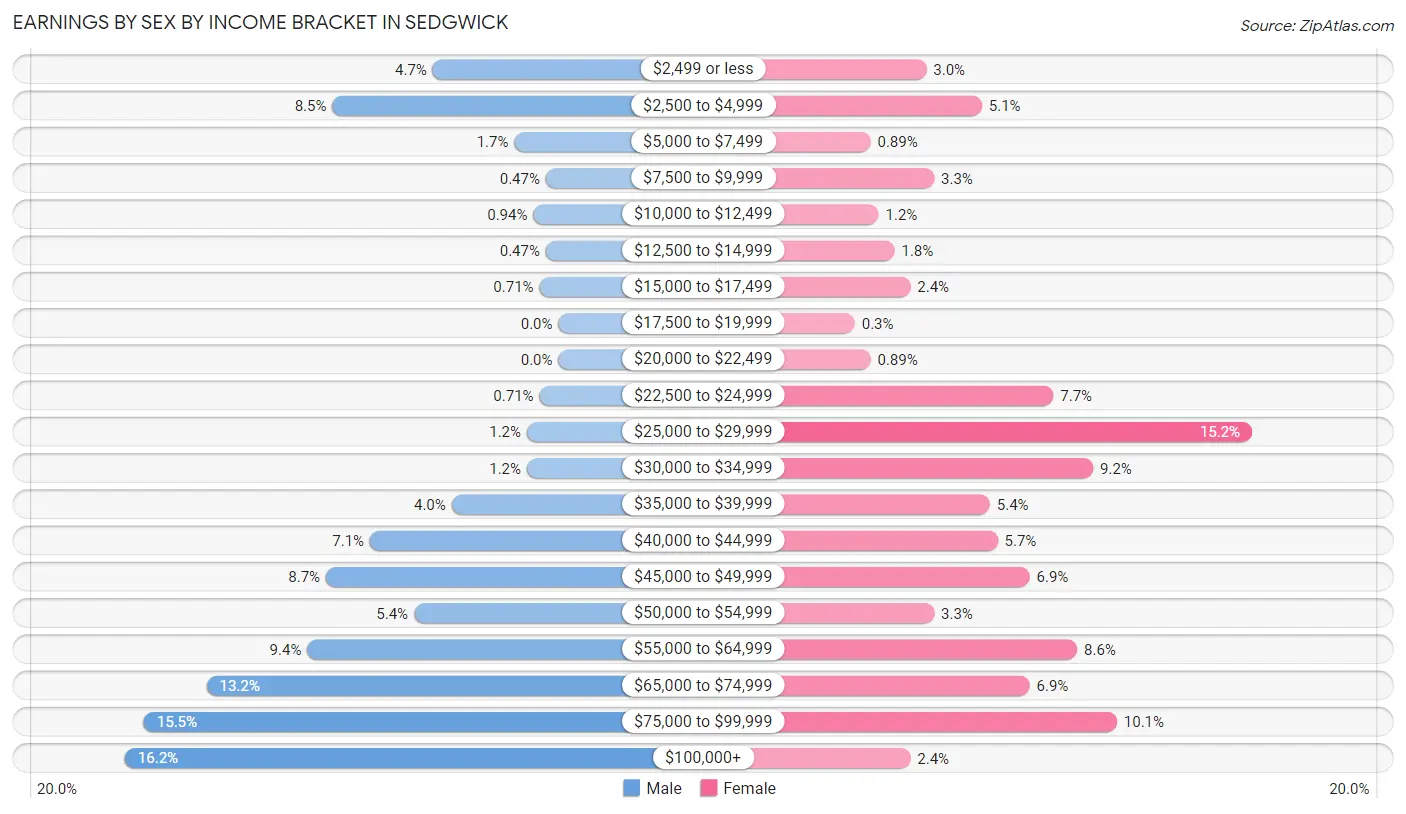
| Income | Male | Female |
| $2,499 or less | 20 (4.7%) | 10 (3.0%) |
| $2,500 to $4,999 | 36 (8.5%) | 17 (5.1%) |
| $5,000 to $7,499 | 7 (1.7%) | 3 (0.9%) |
| $7,500 to $9,999 | 2 (0.5%) | 11 (3.3%) |
| $10,000 to $12,499 | 4 (0.9%) | 4 (1.2%) |
| $12,500 to $14,999 | 2 (0.5%) | 6 (1.8%) |
| $15,000 to $17,499 | 3 (0.7%) | 8 (2.4%) |
| $17,500 to $19,999 | 0 (0.0%) | 1 (0.3%) |
| $20,000 to $22,499 | 0 (0.0%) | 3 (0.9%) |
| $22,500 to $24,999 | 3 (0.7%) | 26 (7.7%) |
| $25,000 to $29,999 | 5 (1.2%) | 51 (15.2%) |
| $30,000 to $34,999 | 5 (1.2%) | 31 (9.2%) |
| $35,000 to $39,999 | 17 (4.0%) | 18 (5.4%) |
| $40,000 to $44,999 | 30 (7.1%) | 19 (5.7%) |
| $45,000 to $49,999 | 37 (8.7%) | 23 (6.9%) |
| $50,000 to $54,999 | 23 (5.4%) | 11 (3.3%) |
| $55,000 to $64,999 | 40 (9.4%) | 29 (8.6%) |
| $65,000 to $74,999 | 56 (13.2%) | 23 (6.9%) |
| $75,000 to $99,999 | 66 (15.5%) | 34 (10.1%) |
| $100,000+ | 69 (16.2%) | 8 (2.4%) |
| Total | 425 (100.0%) | 336 (100.0%) |
Earnings by Sex by Educational Attainment in Sedgwick
Average earnings in Sedgwick are $65,714 for men and $39,000 for women, a difference of 40.6%. Men with an educational attainment of bachelor's degree enjoy the highest average annual earnings of $88,250, while those with less than high school education earn the least with $51,563. Women with an educational attainment of graduate degree earn the most with the average annual earnings of $70,833, while those with high school diploma education have the smallest earnings of $24,464.
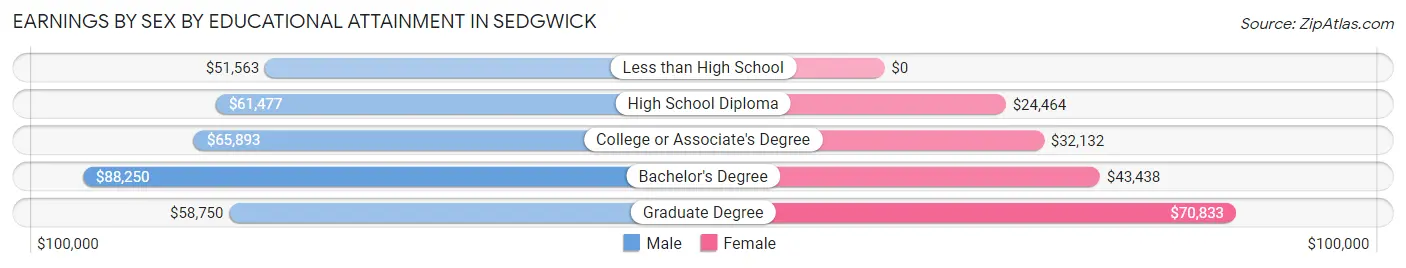
| Educational Attainment | Male Income | Female Income |
| Less than High School | $51,563 | $0 |
| High School Diploma | $61,477 | $24,464 |
| College or Associate's Degree | $65,893 | $32,132 |
| Bachelor's Degree | $88,250 | $43,438 |
| Graduate Degree | $58,750 | $70,833 |
| Total | $65,714 | $39,000 |
Family Income in Sedgwick
Family Income Brackets in Sedgwick
According to the Sedgwick family income data, there are 119 families falling into the $100,000 to $149,999 income range, which is the most common income bracket and makes up 30.9% of all families. Conversely, the less than $10,000 income bracket is the least frequent group with only 6 families (1.6%) belonging to this category.
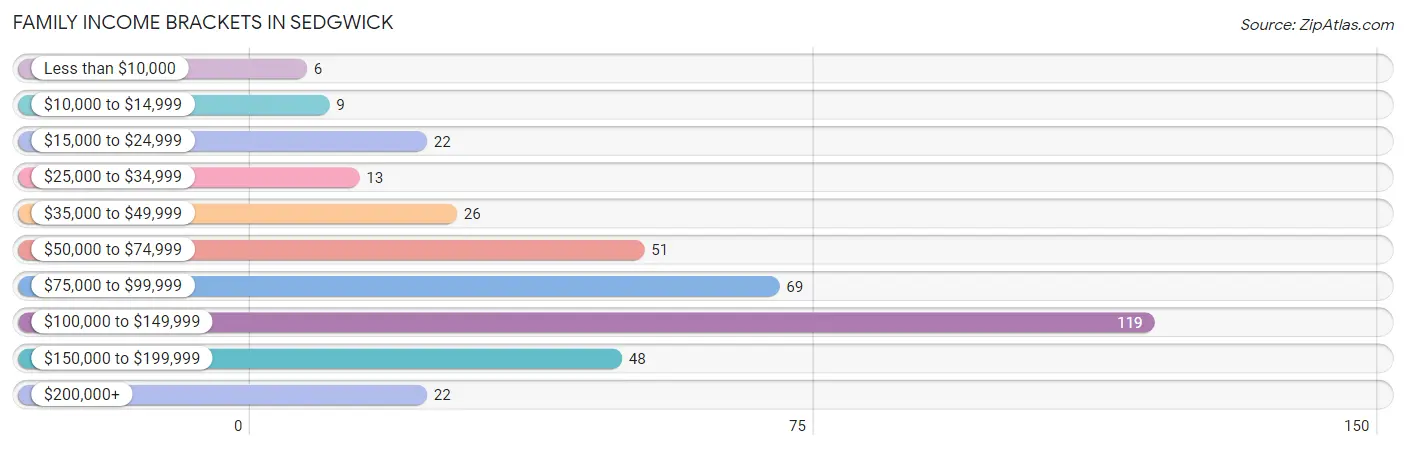
| Income Bracket | # Families | % Families |
| Less than $10,000 | 6 | 1.6% |
| $10,000 to $14,999 | 9 | 2.3% |
| $15,000 to $24,999 | 22 | 5.7% |
| $25,000 to $34,999 | 13 | 3.4% |
| $35,000 to $49,999 | 26 | 6.8% |
| $50,000 to $74,999 | 51 | 13.2% |
| $75,000 to $99,999 | 69 | 17.9% |
| $100,000 to $149,999 | 119 | 30.9% |
| $150,000 to $199,999 | 48 | 12.5% |
| $200,000+ | 22 | 5.7% |
Family Income by Famaliy Size in Sedgwick
5-person families (37 | 9.6%) account for the highest median family income in Sedgwick with $105,313 per family, while 2-person families (204 | 53.0%) have the highest median income of $50,000 per family member.
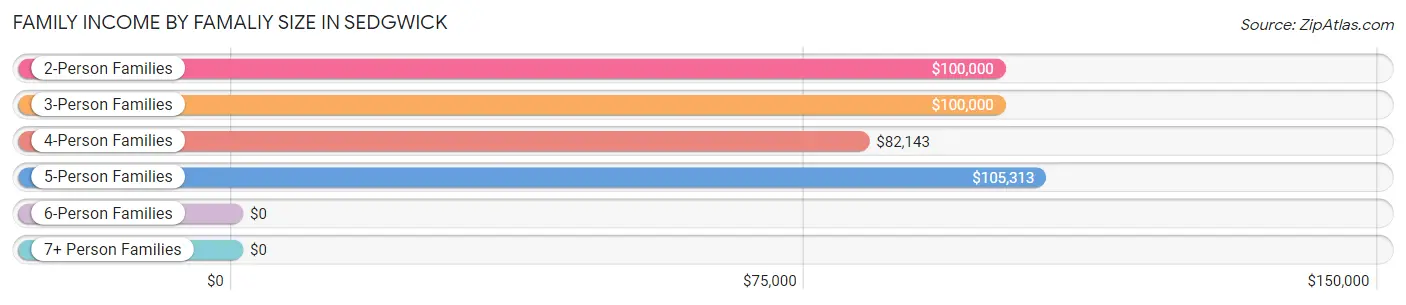
| Income Bracket | # Families | Median Income |
| 2-Person Families | 204 (53.0%) | $100,000 |
| 3-Person Families | 70 (18.2%) | $100,000 |
| 4-Person Families | 74 (19.2%) | $82,143 |
| 5-Person Families | 37 (9.6%) | $105,313 |
| 6-Person Families | 0 (0.0%) | $0 |
| 7+ Person Families | 0 (0.0%) | $0 |
| Total | 385 (100.0%) | $98,250 |
Family Income by Number of Earners in Sedgwick
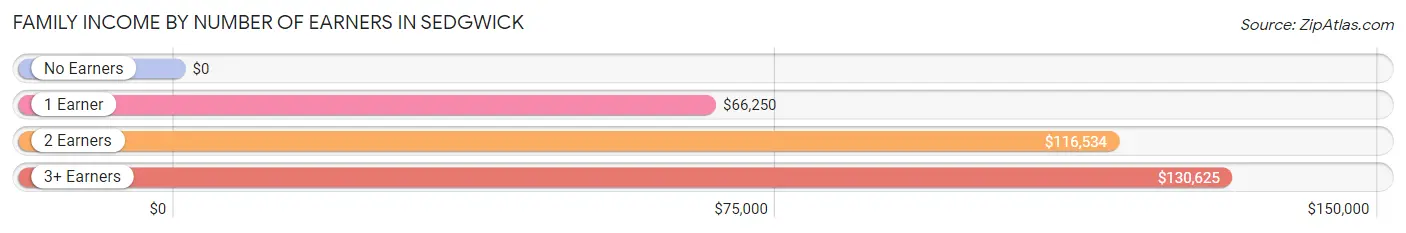
| Number of Earners | # Families | Median Income |
| No Earners | 50 (13.0%) | $0 |
| 1 Earner | 104 (27.0%) | $66,250 |
| 2 Earners | 191 (49.6%) | $116,534 |
| 3+ Earners | 40 (10.4%) | $130,625 |
| Total | 385 (100.0%) | $98,250 |
Household Income in Sedgwick
Household Income Brackets in Sedgwick
With 135 households falling in the category, the $100,000 to $149,999 income range is the most frequent in Sedgwick, accounting for 24.7% of all households. In contrast, only 7 households (1.3%) fall into the $10,000 to $14,999 income bracket, making it the least populous group.
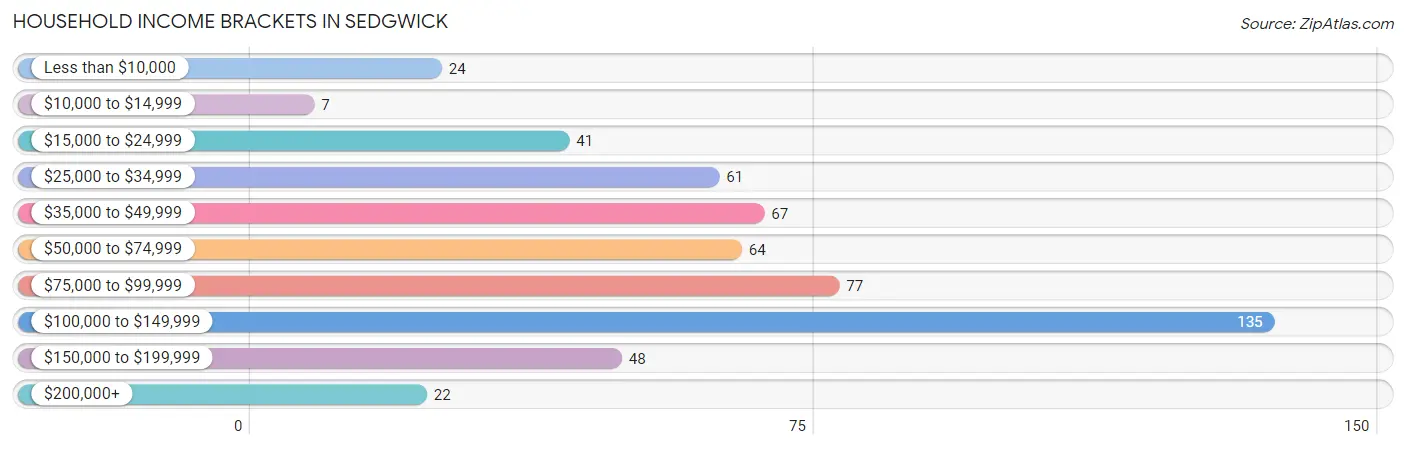
| Income Bracket | # Households | % Households |
| Less than $10,000 | 24 | 4.4% |
| $10,000 to $14,999 | 7 | 1.3% |
| $15,000 to $24,999 | 41 | 7.5% |
| $25,000 to $34,999 | 61 | 11.2% |
| $35,000 to $49,999 | 67 | 12.3% |
| $50,000 to $74,999 | 64 | 11.7% |
| $75,000 to $99,999 | 77 | 14.1% |
| $100,000 to $149,999 | 135 | 24.7% |
| $150,000 to $199,999 | 48 | 8.8% |
| $200,000+ | 22 | 4.0% |
Household Income by Householder Age in Sedgwick
The median household income in Sedgwick is $78,846, with the highest median household income of $97,292 found in the 25 to 44 years age bracket for the primary householder. A total of 181 households (33.2%) fall into this category. Meanwhile, the 15 to 24 years age bracket for the primary householder has the lowest median household income of $0, with 12 households (2.2%) in this group.
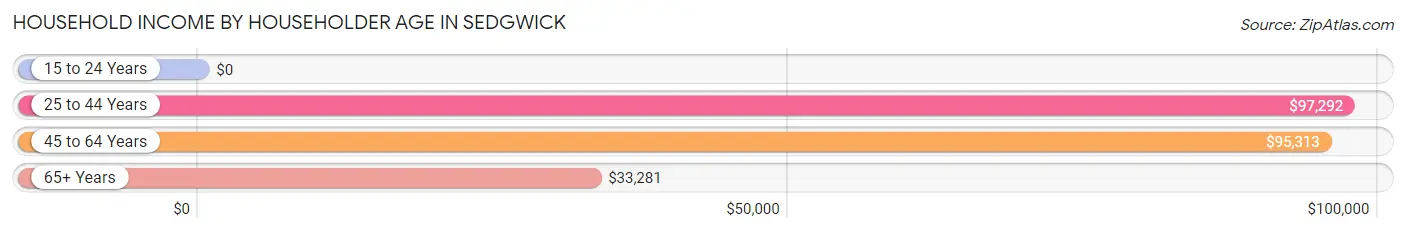
| Income Bracket | # Households | Median Income |
| 15 to 24 Years | 12 (2.2%) | $0 |
| 25 to 44 Years | 181 (33.2%) | $97,292 |
| 45 to 64 Years | 184 (33.7%) | $95,313 |
| 65+ Years | 169 (30.9%) | $33,281 |
| Total | 546 (100.0%) | $78,846 |
Poverty in Sedgwick
Income Below Poverty by Sex and Age in Sedgwick
With 9.8% poverty level for males and 11.2% for females among the residents of Sedgwick, 16 and 17 year old males and 16 and 17 year old females are the most vulnerable to poverty, with 9 males (40.9%) and 9 females (37.5%) in their respective age groups living below the poverty level.
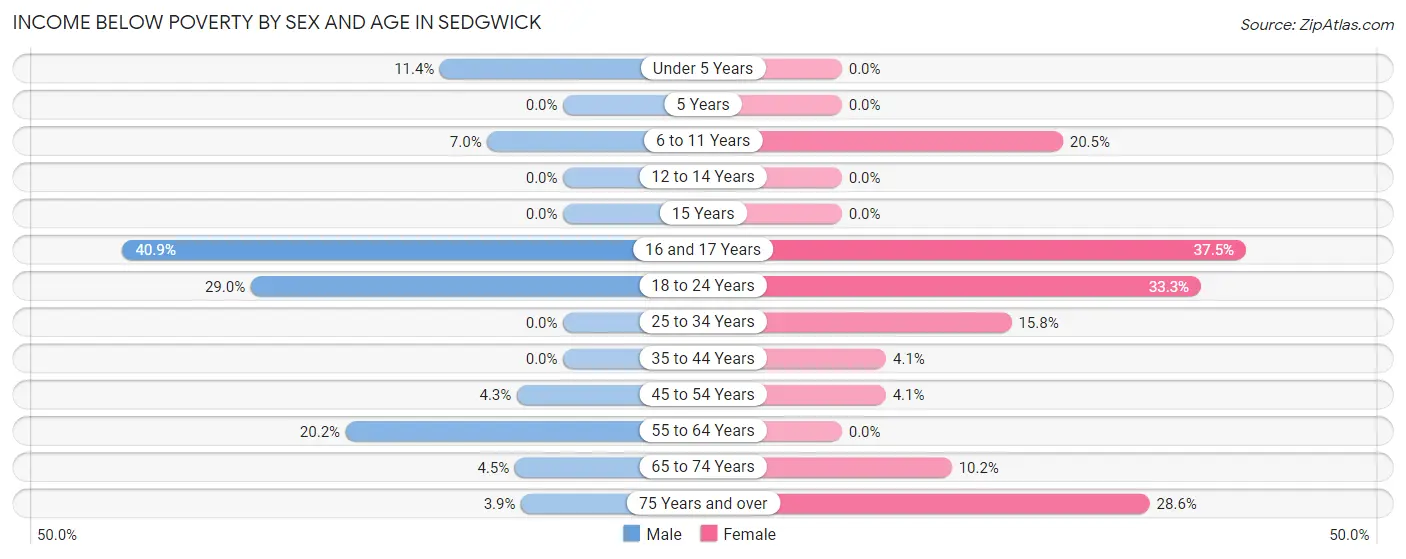
| Age Bracket | Male | Female |
| Under 5 Years | 4 (11.4%) | 0 (0.0%) |
| 5 Years | 0 (0.0%) | 0 (0.0%) |
| 6 to 11 Years | 5 (7.0%) | 16 (20.5%) |
| 12 to 14 Years | 0 (0.0%) | 0 (0.0%) |
| 15 Years | 0 (0.0%) | 0 (0.0%) |
| 16 and 17 Years | 9 (40.9%) | 9 (37.5%) |
| 18 to 24 Years | 20 (29.0%) | 3 (33.3%) |
| 25 to 34 Years | 0 (0.0%) | 20 (15.8%) |
| 35 to 44 Years | 0 (0.0%) | 3 (4.1%) |
| 45 to 54 Years | 3 (4.3%) | 4 (4.1%) |
| 55 to 64 Years | 22 (20.2%) | 0 (0.0%) |
| 65 to 74 Years | 3 (4.5%) | 5 (10.2%) |
| 75 Years and over | 3 (3.9%) | 16 (28.6%) |
| Total | 69 (9.8%) | 76 (11.2%) |
Income Above Poverty by Sex and Age in Sedgwick
According to the poverty statistics in Sedgwick, males aged 5 years and females aged under 5 years are the age groups that are most secure financially, with 100.0% of males and 100.0% of females in these age groups living above the poverty line.
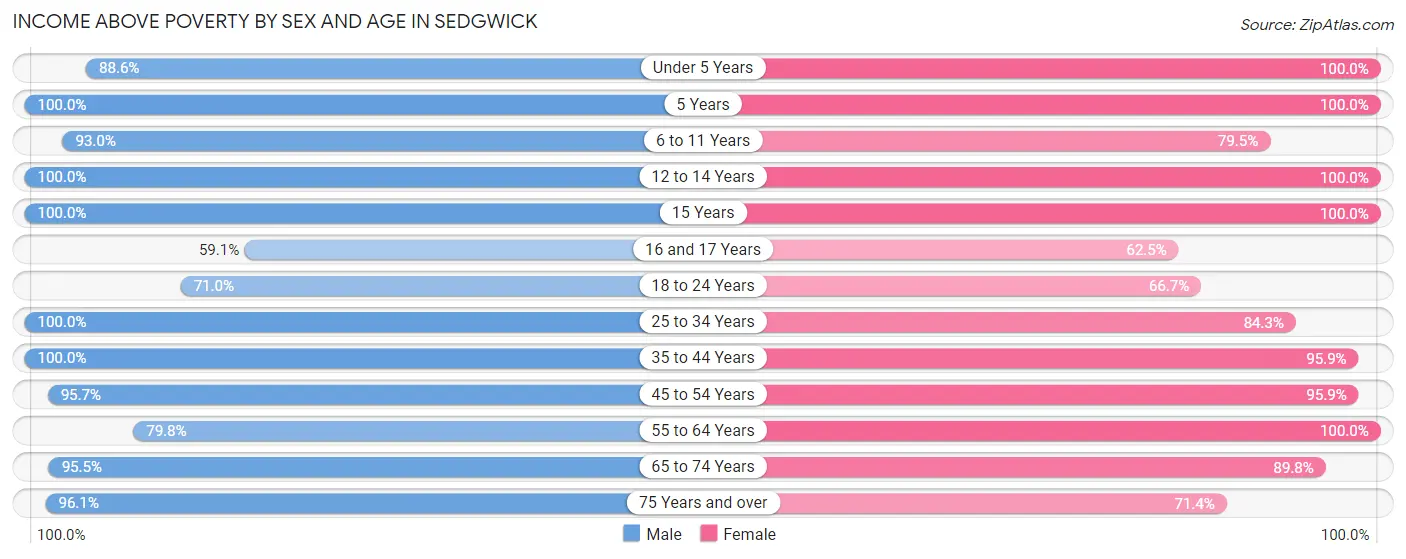
| Age Bracket | Male | Female |
| Under 5 Years | 31 (88.6%) | 28 (100.0%) |
| 5 Years | 4 (100.0%) | 9 (100.0%) |
| 6 to 11 Years | 66 (93.0%) | 62 (79.5%) |
| 12 to 14 Years | 31 (100.0%) | 53 (100.0%) |
| 15 Years | 6 (100.0%) | 8 (100.0%) |
| 16 and 17 Years | 13 (59.1%) | 15 (62.5%) |
| 18 to 24 Years | 49 (71.0%) | 6 (66.7%) |
| 25 to 34 Years | 69 (100.0%) | 107 (84.3%) |
| 35 to 44 Years | 78 (100.0%) | 70 (95.9%) |
| 45 to 54 Years | 67 (95.7%) | 94 (95.9%) |
| 55 to 64 Years | 87 (79.8%) | 64 (100.0%) |
| 65 to 74 Years | 64 (95.5%) | 44 (89.8%) |
| 75 Years and over | 74 (96.1%) | 40 (71.4%) |
| Total | 639 (90.2%) | 600 (88.8%) |
Income Below Poverty Among Married-Couple Families in Sedgwick
The poverty statistics for married-couple families in Sedgwick show that 1.0% or 3 of the total 303 families live below the poverty line. Families with no children have the highest poverty rate of 1.7%, comprising of 3 families. On the other hand, families with 1 or 2 children have the lowest poverty rate of 0.0%, which includes 0 families.
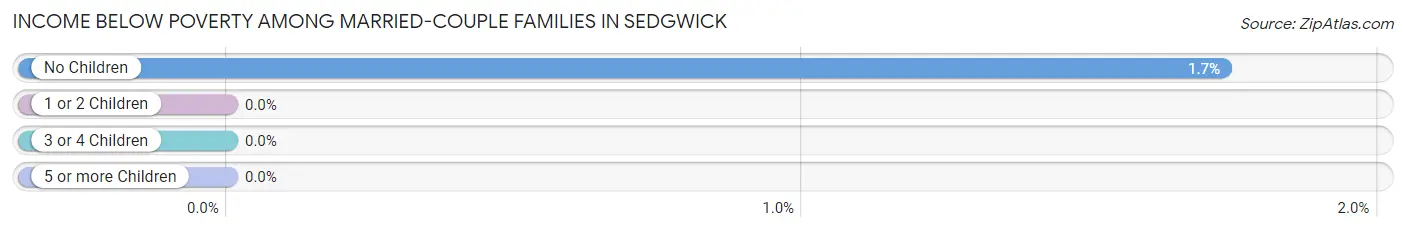
| Children | Above Poverty | Below Poverty |
| No Children | 170 (98.3%) | 3 (1.7%) |
| 1 or 2 Children | 107 (100.0%) | 0 (0.0%) |
| 3 or 4 Children | 23 (100.0%) | 0 (0.0%) |
| 5 or more Children | 0 (0.0%) | 0 (0.0%) |
| Total | 300 (99.0%) | 3 (1.0%) |
Income Below Poverty Among Single-Parent Households in Sedgwick
According to the poverty data in Sedgwick, 43.2% or 19 single-father households and 31.6% or 12 single-mother households are living below the poverty line. Among single-father households, those with no children have the highest poverty rate, with 19 households (52.8%) experiencing poverty. Likewise, among single-mother households, those with 1 or 2 children have the highest poverty rate, with 12 households (54.5%) falling below the poverty line.
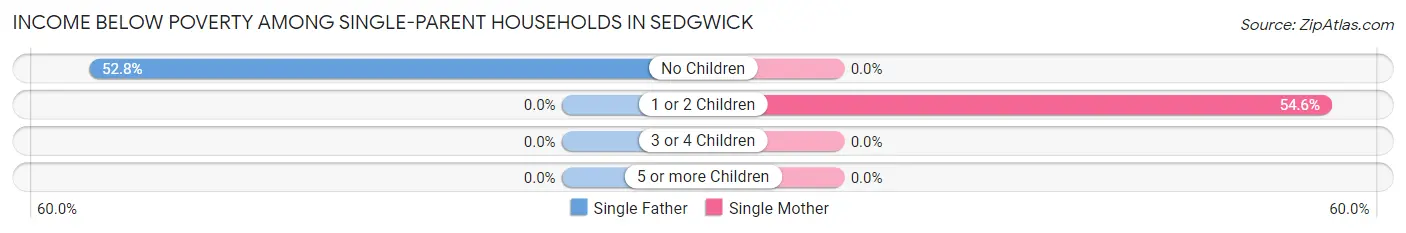
| Children | Single Father | Single Mother |
| No Children | 19 (52.8%) | 0 (0.0%) |
| 1 or 2 Children | 0 (0.0%) | 12 (54.5%) |
| 3 or 4 Children | 0 (0.0%) | 0 (0.0%) |
| 5 or more Children | 0 (0.0%) | 0 (0.0%) |
| Total | 19 (43.2%) | 12 (31.6%) |
Income Below Poverty Among Married-Couple vs Single-Parent Households in Sedgwick
The poverty data for Sedgwick shows that 3 of the married-couple family households (1.0%) and 31 of the single-parent households (37.8%) are living below the poverty level. Within the married-couple family households, those with no children have the highest poverty rate, with 3 households (1.7%) falling below the poverty line. Among the single-parent households, those with no children have the highest poverty rate, with 19 household (48.7%) living below poverty.
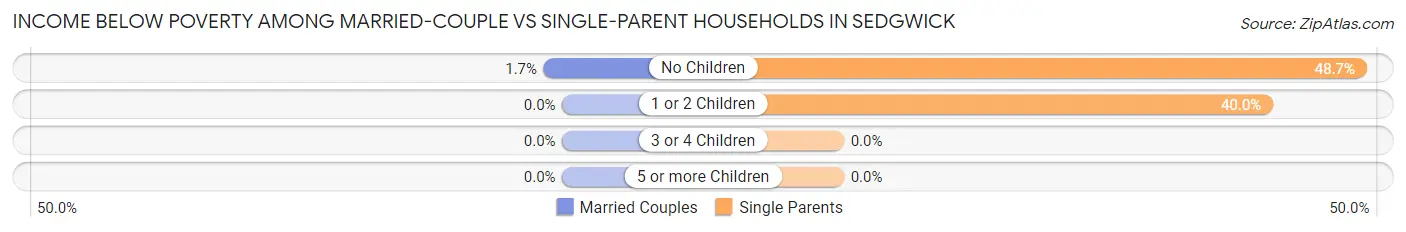
| Children | Married-Couple Families | Single-Parent Households |
| No Children | 3 (1.7%) | 19 (48.7%) |
| 1 or 2 Children | 0 (0.0%) | 12 (40.0%) |
| 3 or 4 Children | 0 (0.0%) | 0 (0.0%) |
| 5 or more Children | 0 (0.0%) | 0 (0.0%) |
| Total | 3 (1.0%) | 31 (37.8%) |
Race in Sedgwick
The most populous races in Sedgwick are White / Caucasian (1,323 | 90.3%), Two or more Races (131 | 8.9%), and Hispanic or Latino (115 | 7.9%).
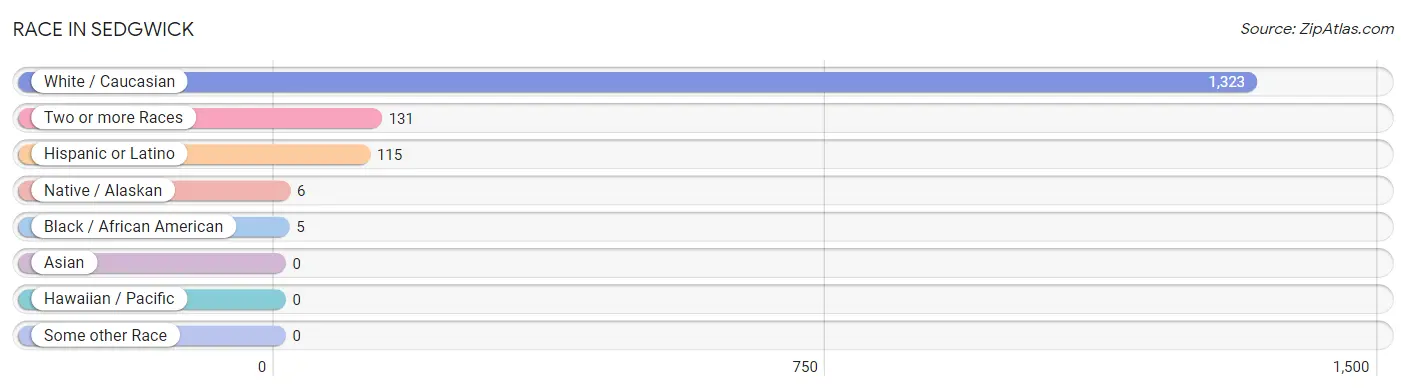
| Race | # Population | % Population |
| Asian | 0 | 0.0% |
| Black / African American | 5 | 0.3% |
| Hawaiian / Pacific | 0 | 0.0% |
| Hispanic or Latino | 115 | 7.9% |
| Native / Alaskan | 6 | 0.4% |
| White / Caucasian | 1,323 | 90.3% |
| Two or more Races | 131 | 8.9% |
| Some other Race | 0 | 0.0% |
| Total | 1,465 | 100.0% |
Ancestry in Sedgwick
The most populous ancestries reported in Sedgwick are German (387 | 26.4%), English (257 | 17.5%), Irish (137 | 9.3%), Mexican (115 | 7.9%), and American (97 | 6.6%), together accounting for 67.8% of all Sedgwick residents.
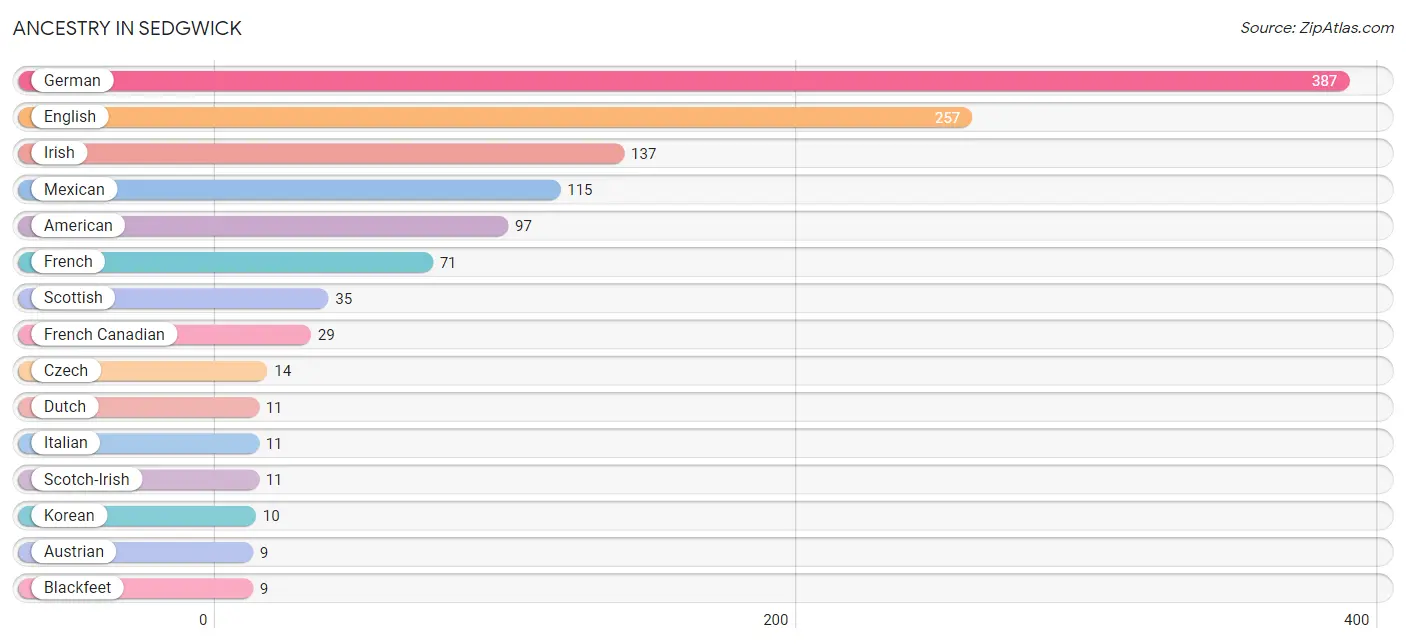
| Ancestry | # Population | % Population |
| American | 97 | 6.6% |
| Austrian | 9 | 0.6% |
| Blackfeet | 9 | 0.6% |
| Cherokee | 6 | 0.4% |
| Czech | 14 | 1.0% |
| Czechoslovakian | 7 | 0.5% |
| Dutch | 11 | 0.7% |
| English | 257 | 17.5% |
| European | 3 | 0.2% |
| French | 71 | 4.9% |
| French Canadian | 29 | 2.0% |
| German | 387 | 26.4% |
| Irish | 137 | 9.3% |
| Italian | 11 | 0.7% |
| Korean | 10 | 0.7% |
| Mexican | 115 | 7.9% |
| Northern European | 3 | 0.2% |
| Norwegian | 3 | 0.2% |
| Polish | 9 | 0.6% |
| Russian | 5 | 0.3% |
| Scandinavian | 4 | 0.3% |
| Scotch-Irish | 11 | 0.7% |
| Scottish | 35 | 2.4% |
| Swiss | 5 | 0.3% |
| Welsh | 4 | 0.3% | View All 25 Rows |
Immigrants in Sedgwick
The most numerous immigrant groups reported in Sedgwick came from Europe (32 | 2.2%), Germany (32 | 2.2%), Western Europe (32 | 2.2%), Asia (3 | 0.2%), and Indonesia (3 | 0.2%), together accounting for 6.9% of all Sedgwick residents.
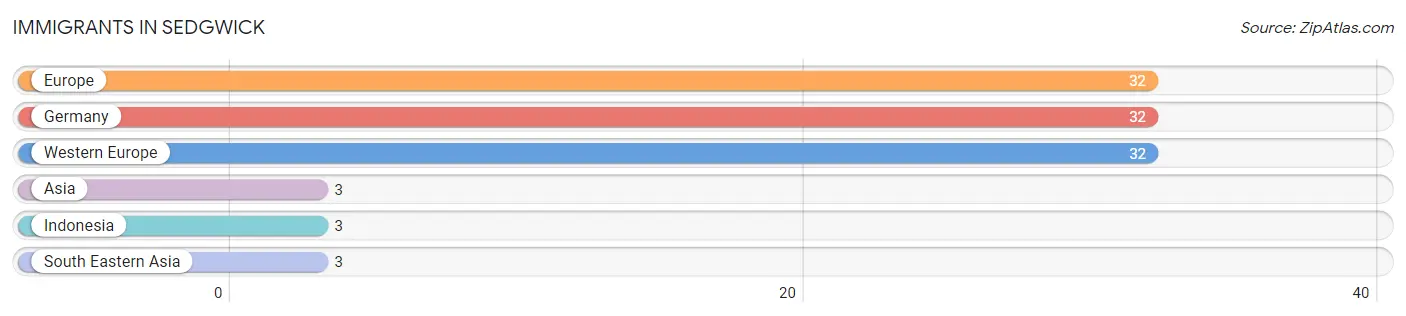
| Immigration Origin | # Population | % Population |
| Asia | 3 | 0.2% |
| Europe | 32 | 2.2% |
| Germany | 32 | 2.2% |
| Indonesia | 3 | 0.2% |
| South Eastern Asia | 3 | 0.2% |
| Western Europe | 32 | 2.2% | View All 6 Rows |
Sex and Age in Sedgwick
Sex and Age in Sedgwick
The most populous age groups in Sedgwick are 15 to 19 Years (80 | 11.0%) for men and 10 to 14 Years (94 | 12.7%) for women.
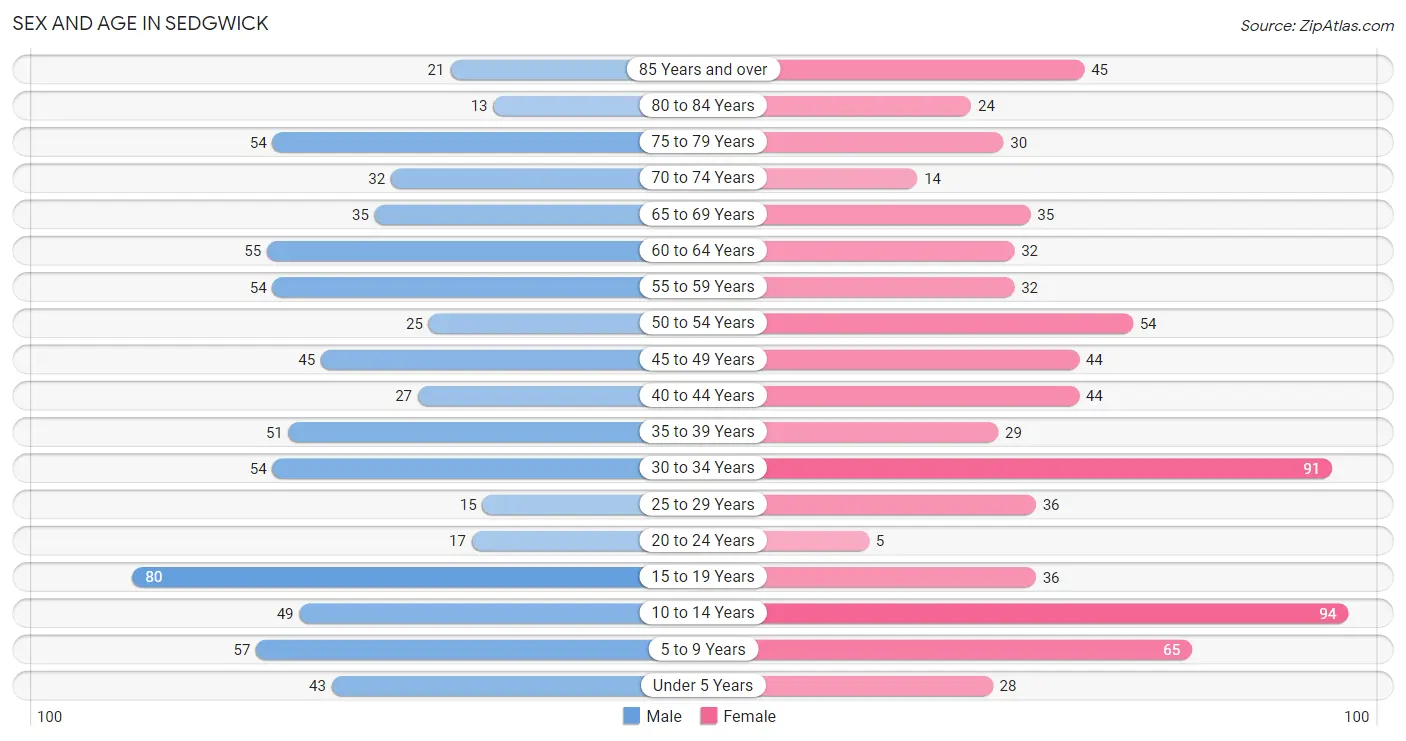
| Age Bracket | Male | Female |
| Under 5 Years | 43 (5.9%) | 28 (3.8%) |
| 5 to 9 Years | 57 (7.8%) | 65 (8.8%) |
| 10 to 14 Years | 49 (6.7%) | 94 (12.7%) |
| 15 to 19 Years | 80 (11.0%) | 36 (4.9%) |
| 20 to 24 Years | 17 (2.3%) | 5 (0.7%) |
| 25 to 29 Years | 15 (2.1%) | 36 (4.9%) |
| 30 to 34 Years | 54 (7.4%) | 91 (12.3%) |
| 35 to 39 Years | 51 (7.0%) | 29 (3.9%) |
| 40 to 44 Years | 27 (3.7%) | 44 (6.0%) |
| 45 to 49 Years | 45 (6.2%) | 44 (6.0%) |
| 50 to 54 Years | 25 (3.4%) | 54 (7.3%) |
| 55 to 59 Years | 54 (7.4%) | 32 (4.3%) |
| 60 to 64 Years | 55 (7.6%) | 32 (4.3%) |
| 65 to 69 Years | 35 (4.8%) | 35 (4.7%) |
| 70 to 74 Years | 32 (4.4%) | 14 (1.9%) |
| 75 to 79 Years | 54 (7.4%) | 30 (4.1%) |
| 80 to 84 Years | 13 (1.8%) | 24 (3.3%) |
| 85 Years and over | 21 (2.9%) | 45 (6.1%) |
| Total | 727 (100.0%) | 738 (100.0%) |
Families and Households in Sedgwick
Median Family Size in Sedgwick
The median family size in Sedgwick is 3.03 persons per family, with single female/mother families (38 | 9.9%) accounting for the largest median family size of 3.74 persons per family. On the other hand, single male/father families (44 | 11.4%) represent the smallest median family size with 2.25 persons per family.
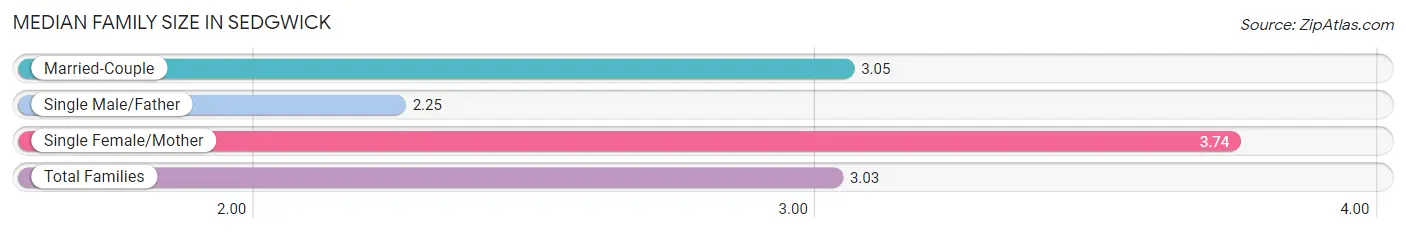
| Family Type | # Families | Family Size |
| Married-Couple | 303 (78.7%) | 3.05 |
| Single Male/Father | 44 (11.4%) | 2.25 |
| Single Female/Mother | 38 (9.9%) | 3.74 |
| Total Families | 385 (100.0%) | 3.03 |
Median Household Size in Sedgwick
The median household size in Sedgwick is 2.58 persons per household, with single female/mother households (38 | 7.0%) accounting for the largest median household size of 4.16 persons per household. non-family households (161 | 29.5%) represent the smallest median household size with 1.14 persons per household.
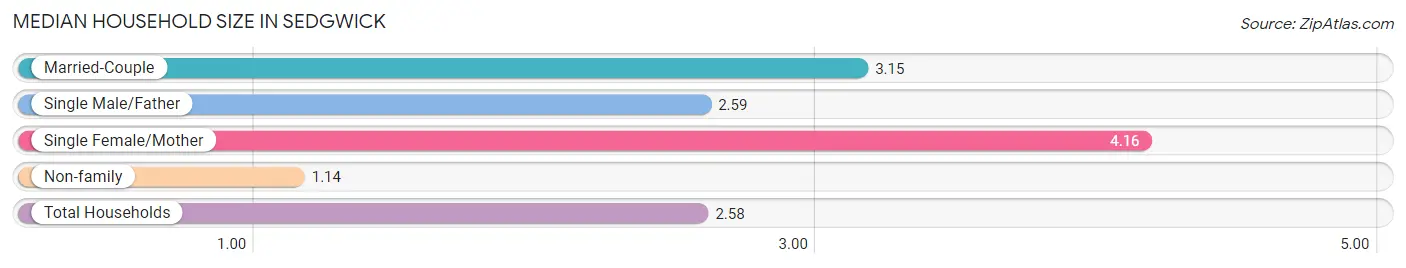
| Household Type | # Households | Household Size |
| Married-Couple | 303 (55.5%) | 3.15 |
| Single Male/Father | 44 (8.1%) | 2.59 |
| Single Female/Mother | 38 (7.0%) | 4.16 |
| Non-family | 161 (29.5%) | 1.14 |
| Total Households | 546 (100.0%) | 2.58 |
Household Size by Marriage Status in Sedgwick
Out of a total of 546 households in Sedgwick, 385 (70.5%) are family households, while 161 (29.5%) are nonfamily households. The most numerous type of family households are 2-person households, comprising 188, and the most common type of nonfamily households are 1-person households, comprising 139.
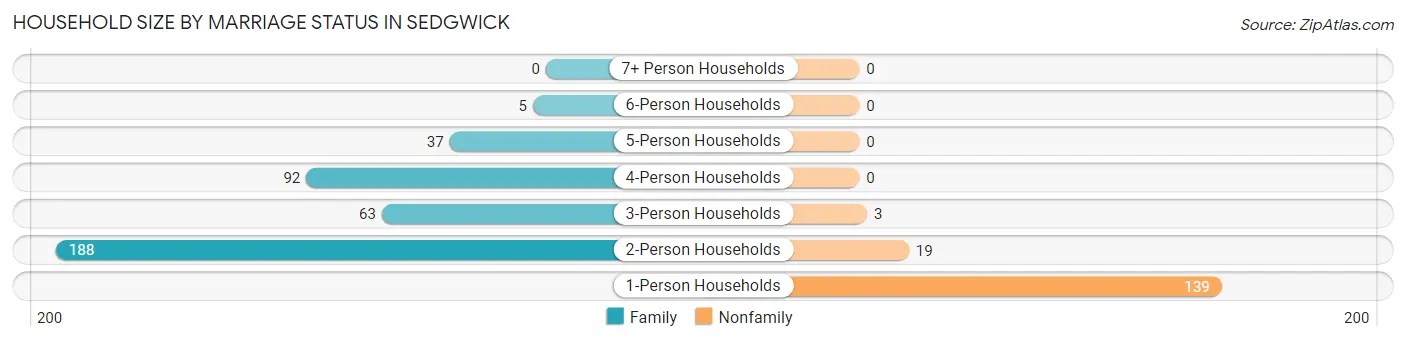
| Household Size | Family Households | Nonfamily Households |
| 1-Person Households | - | 139 (25.5%) |
| 2-Person Households | 188 (34.4%) | 19 (3.5%) |
| 3-Person Households | 63 (11.5%) | 3 (0.5%) |
| 4-Person Households | 92 (16.9%) | 0 (0.0%) |
| 5-Person Households | 37 (6.8%) | 0 (0.0%) |
| 6-Person Households | 5 (0.9%) | 0 (0.0%) |
| 7+ Person Households | 0 (0.0%) | 0 (0.0%) |
| Total | 385 (70.5%) | 161 (29.5%) |
Female Fertility in Sedgwick
Fertility by Age in Sedgwick
Average fertility rate in Sedgwick is 64.0 births per 1,000 women. Women in the age bracket of 20 to 34 years have the highest fertility rate with 144.0 births per 1,000 women. Women in the age bracket of 20 to 34 years acount for 100.0% of all women with births.
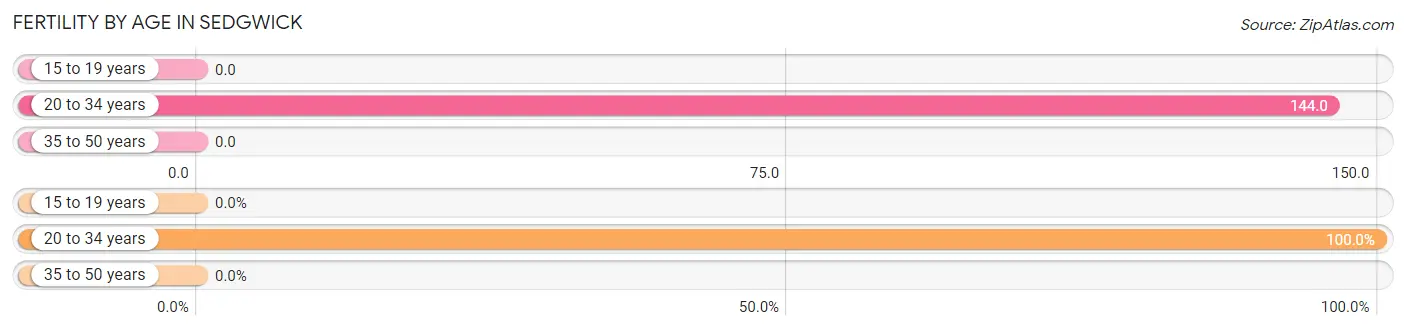
| Age Bracket | Women with Births | Births / 1,000 Women |
| 15 to 19 years | 0 (0.0%) | 0.0 |
| 20 to 34 years | 19 (100.0%) | 144.0 |
| 35 to 50 years | 0 (0.0%) | 0.0 |
| Total | 19 (100.0%) | 64.0 |
Fertility by Age by Marriage Status in Sedgwick
84.2% of women with births (19) in Sedgwick are married. The highest percentage of unmarried women with births falls into 20 to 34 years age bracket with 15.8% of them unmarried at the time of birth, while the lowest percentage of unmarried women with births belong to 20 to 34 years age bracket with 15.8% of them unmarried.
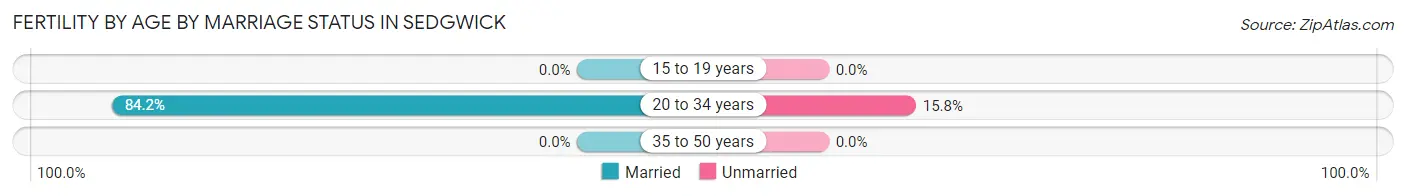
| Age Bracket | Married | Unmarried |
| 15 to 19 years | 0 (0.0%) | 0 (0.0%) |
| 20 to 34 years | 16 (84.2%) | 3 (15.8%) |
| 35 to 50 years | 0 (0.0%) | 0 (0.0%) |
| Total | 16 (84.2%) | 3 (15.8%) |
Fertility by Education in Sedgwick
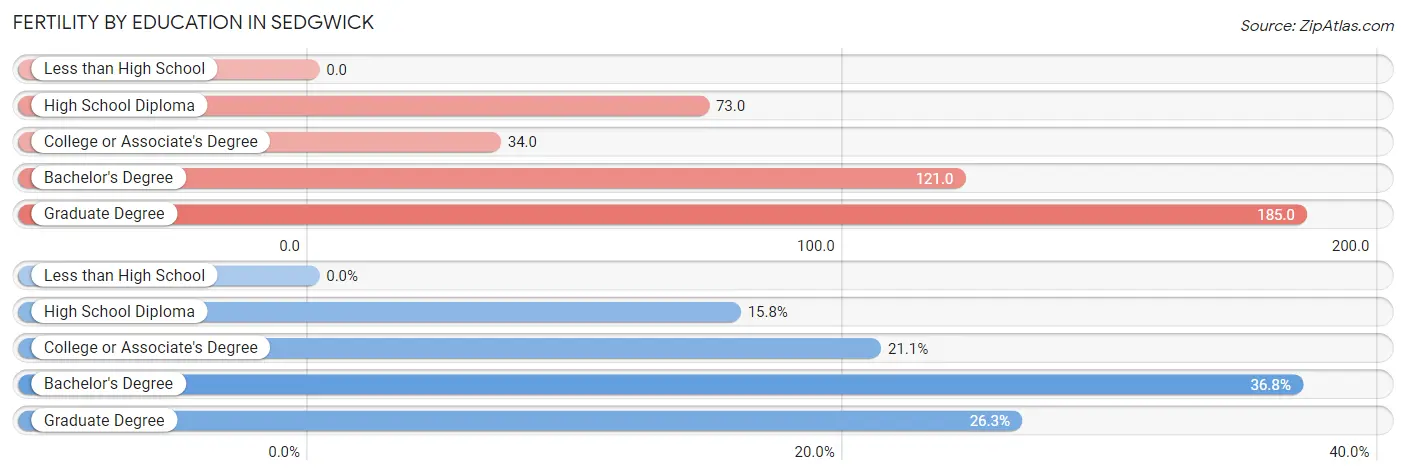
| Educational Attainment | Women with Births | Births / 1,000 Women |
| Less than High School | 0 (0.0%) | 0.0 |
| High School Diploma | 3 (15.8%) | 73.0 |
| College or Associate's Degree | 4 (21.0%) | 34.0 |
| Bachelor's Degree | 7 (36.8%) | 121.0 |
| Graduate Degree | 5 (26.3%) | 185.0 |
| Total | 19 (100.0%) | 64.0 |
Fertility by Education by Marriage Status in Sedgwick
15.8% of women with births in Sedgwick are unmarried. Women with the educational attainment of college or associate's degree are most likely to be married with 100.0% of them married at childbirth, while women with the educational attainment of high school diploma are least likely to be married with 100.0% of them unmarried at childbirth.
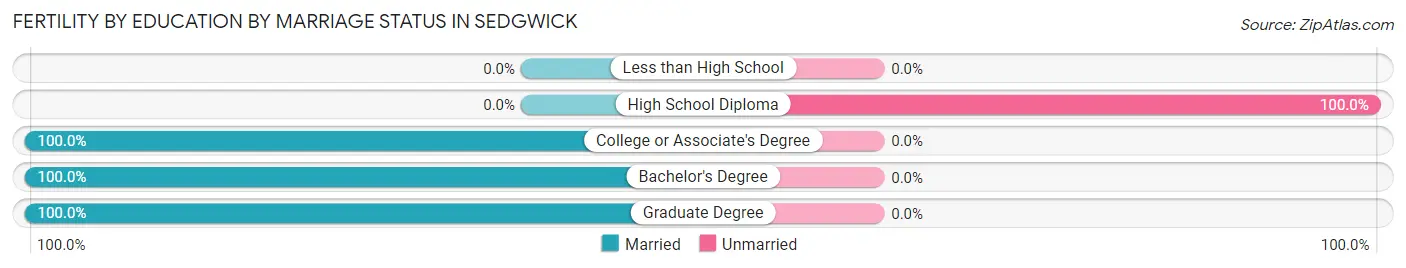
| Educational Attainment | Married | Unmarried |
| Less than High School | 0 (0.0%) | 0 (0.0%) |
| High School Diploma | 0 (0.0%) | 3 (100.0%) |
| College or Associate's Degree | 4 (100.0%) | 0 (0.0%) |
| Bachelor's Degree | 7 (100.0%) | 0 (0.0%) |
| Graduate Degree | 5 (100.0%) | 0 (0.0%) |
| Total | 16 (84.2%) | 3 (15.8%) |
Employment Characteristics in Sedgwick
Employment by Class of Employer in Sedgwick
Among the 687 employed individuals in Sedgwick, private company employees (462 | 67.2%), not-for-profit organizations (88 | 12.8%), and local government employees (81 | 11.8%) make up the most common classes of employment.
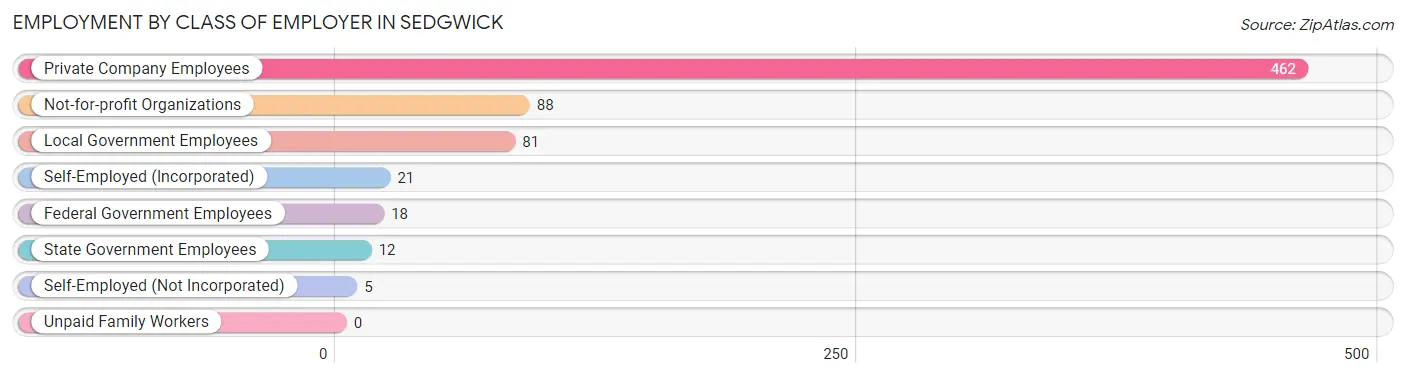
| Employer Class | # Employees | % Employees |
| Private Company Employees | 462 | 67.2% |
| Self-Employed (Incorporated) | 21 | 3.1% |
| Self-Employed (Not Incorporated) | 5 | 0.7% |
| Not-for-profit Organizations | 88 | 12.8% |
| Local Government Employees | 81 | 11.8% |
| State Government Employees | 12 | 1.8% |
| Federal Government Employees | 18 | 2.6% |
| Unpaid Family Workers | 0 | 0.0% |
| Total | 687 | 100.0% |
Employment Status by Age in Sedgwick
According to the labor force statistics for Sedgwick, out of the total population over 16 years of age (1,115), 62.2% or 694 individuals are in the labor force, with 1.0% or 7 of them unemployed. The age group with the highest labor force participation rate is 20 to 24 years, with 100.0% or 22 individuals in the labor force. Within the labor force, the 20 to 24 years age range has the highest percentage of unemployed individuals, with 18.2% or 4 of them being unemployed.
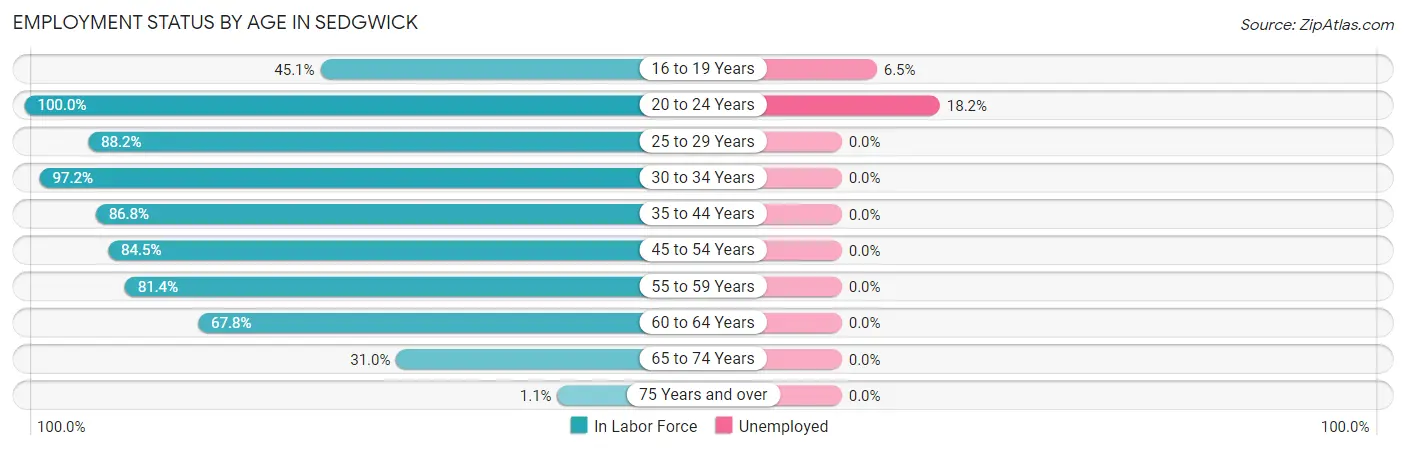
| Age Bracket | In Labor Force | Unemployed |
| 16 to 19 Years | 46 (45.1%) | 3 (6.5%) |
| 20 to 24 Years | 22 (100.0%) | 4 (18.2%) |
| 25 to 29 Years | 45 (88.2%) | 0 (0.0%) |
| 30 to 34 Years | 141 (97.2%) | 0 (0.0%) |
| 35 to 44 Years | 131 (86.8%) | 0 (0.0%) |
| 45 to 54 Years | 142 (84.5%) | 0 (0.0%) |
| 55 to 59 Years | 70 (81.4%) | 0 (0.0%) |
| 60 to 64 Years | 59 (67.8%) | 0 (0.0%) |
| 65 to 74 Years | 36 (31.0%) | 0 (0.0%) |
| 75 Years and over | 2 (1.1%) | 0 (0.0%) |
| Total | 694 (62.2%) | 7 (1.0%) |
Employment Status by Educational Attainment in Sedgwick
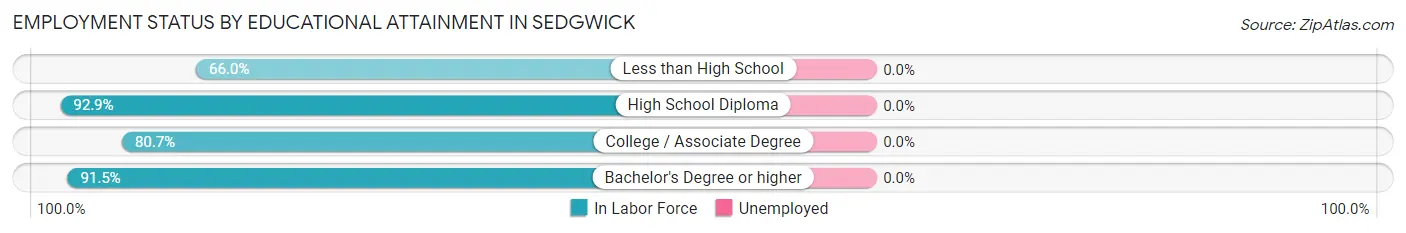
| Educational Attainment | In Labor Force | Unemployed |
| Less than High School | 31 (66.0%) | 0 (0.0%) |
| High School Diploma | 130 (92.9%) | 0 (0.0%) |
| College / Associate Degree | 234 (80.7%) | 0 (0.0%) |
| Bachelor's Degree or higher | 193 (91.5%) | 0 (0.0%) |
| Total | 588 (85.5%) | 0 (0.0%) |
Employment Occupations by Sex in Sedgwick
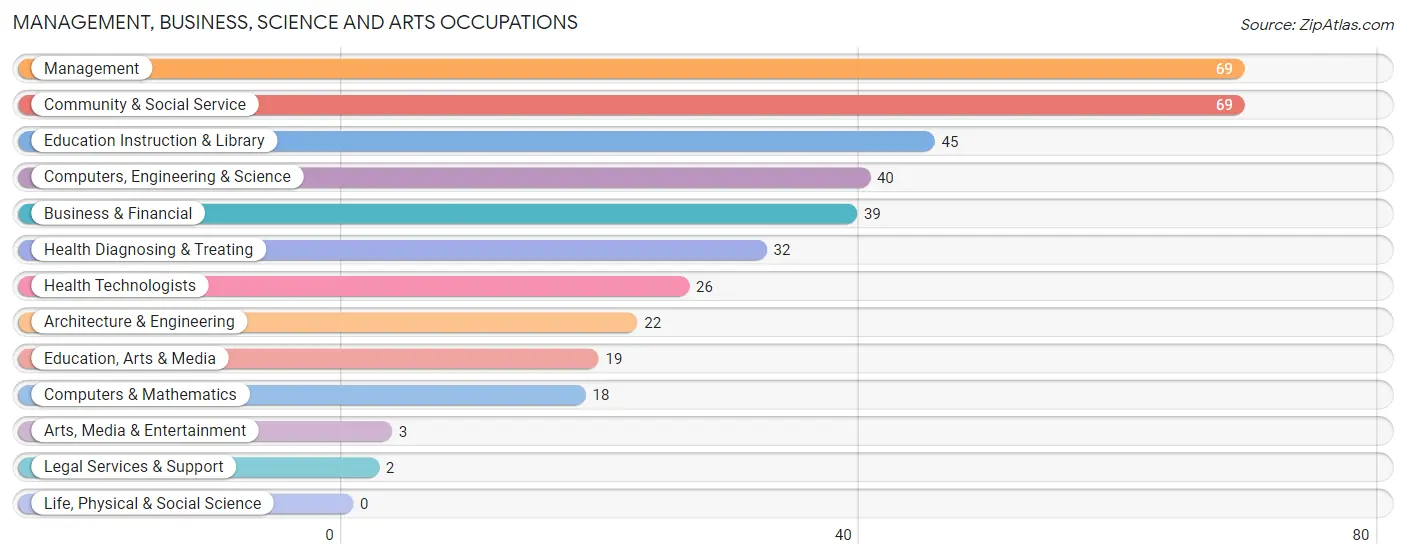
Management, Business, Science and Arts Occupations
The most common Management, Business, Science and Arts occupations in Sedgwick are Management (69 | 10.1%), Community & Social Service (69 | 10.1%), Education Instruction & Library (45 | 6.6%), Computers, Engineering & Science (40 | 5.9%), and Business & Financial (39 | 5.7%).
Management, Business, Science and Arts Occupations by Sex
Within the Management, Business, Science and Arts occupations in Sedgwick, the most male-oriented occupations are Architecture & Engineering (100.0%), Arts, Media & Entertainment (100.0%), and Computers, Engineering & Science (90.0%), while the most female-oriented occupations are Legal Services & Support (100.0%), Health Diagnosing & Treating (100.0%), and Health Technologists (100.0%).
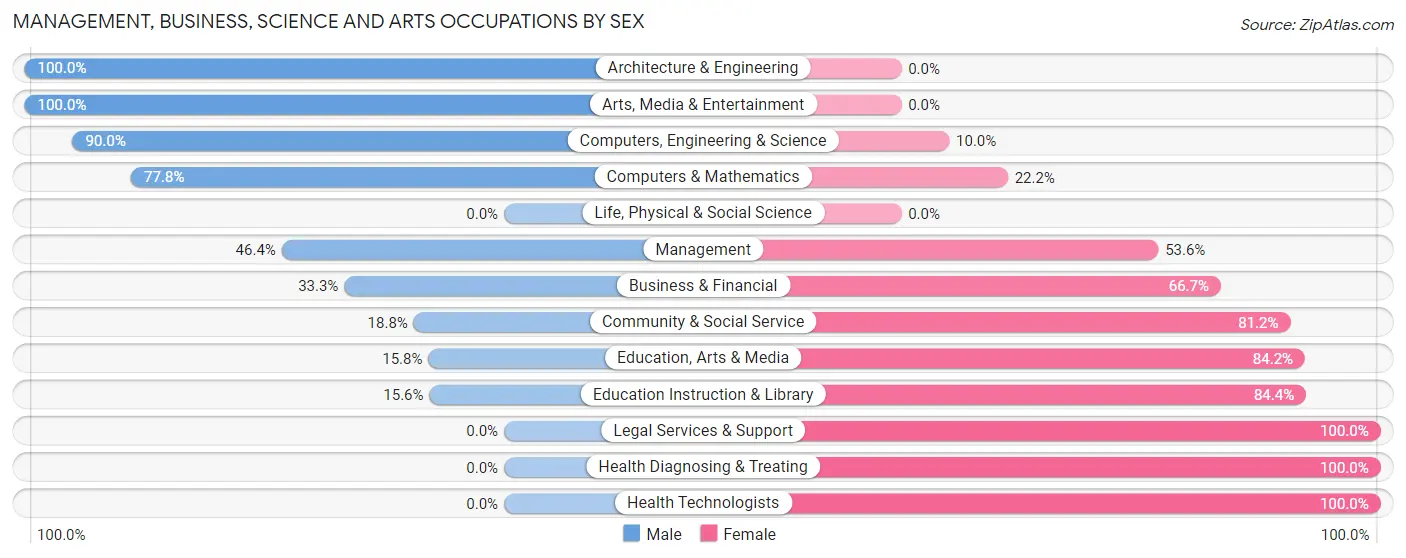
| Occupation | Male | Female |
| Management | 32 (46.4%) | 37 (53.6%) |
| Business & Financial | 13 (33.3%) | 26 (66.7%) |
| Computers, Engineering & Science | 36 (90.0%) | 4 (10.0%) |
| Computers & Mathematics | 14 (77.8%) | 4 (22.2%) |
| Architecture & Engineering | 22 (100.0%) | 0 (0.0%) |
| Life, Physical & Social Science | 0 (0.0%) | 0 (0.0%) |
| Community & Social Service | 13 (18.8%) | 56 (81.2%) |
| Education, Arts & Media | 3 (15.8%) | 16 (84.2%) |
| Legal Services & Support | 0 (0.0%) | 2 (100.0%) |
| Education Instruction & Library | 7 (15.6%) | 38 (84.4%) |
| Arts, Media & Entertainment | 3 (100.0%) | 0 (0.0%) |
| Health Diagnosing & Treating | 0 (0.0%) | 32 (100.0%) |
| Health Technologists | 0 (0.0%) | 26 (100.0%) |
| Total (Category) | 94 (37.8%) | 155 (62.3%) |
| Total (Overall) | 361 (53.0%) | 320 (47.0%) |
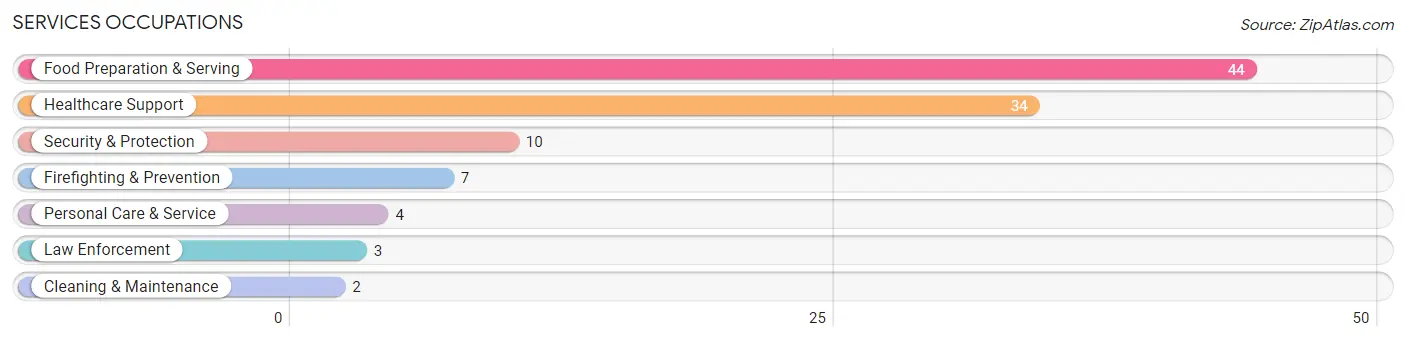
Services Occupations
The most common Services occupations in Sedgwick are Food Preparation & Serving (44 | 6.5%), Healthcare Support (34 | 5.0%), Security & Protection (10 | 1.5%), Firefighting & Prevention (7 | 1.0%), and Personal Care & Service (4 | 0.6%).
Services Occupations by Sex
Within the Services occupations in Sedgwick, the most male-oriented occupations are Security & Protection (100.0%), Firefighting & Prevention (100.0%), and Law Enforcement (100.0%), while the most female-oriented occupations are Healthcare Support (100.0%), Personal Care & Service (100.0%), and Food Preparation & Serving (38.6%).
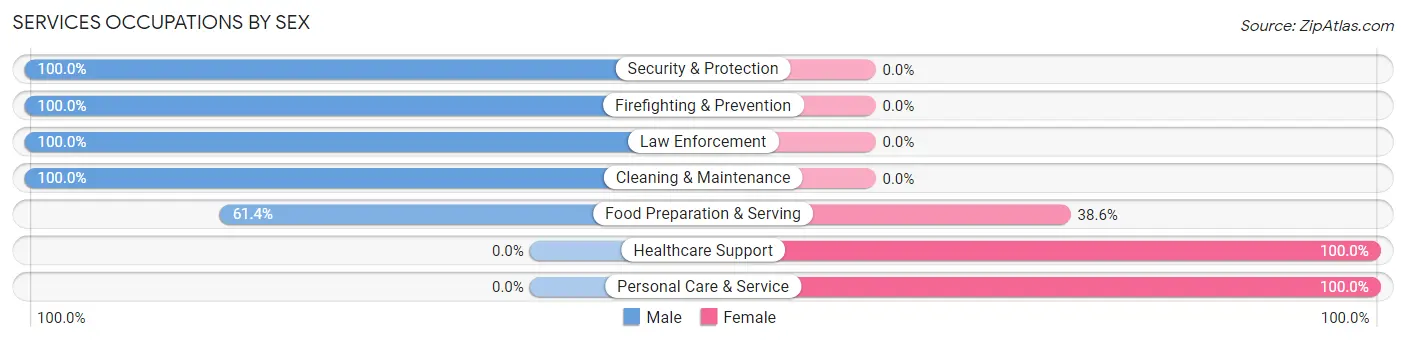
| Occupation | Male | Female |
| Healthcare Support | 0 (0.0%) | 34 (100.0%) |
| Security & Protection | 10 (100.0%) | 0 (0.0%) |
| Firefighting & Prevention | 7 (100.0%) | 0 (0.0%) |
| Law Enforcement | 3 (100.0%) | 0 (0.0%) |
| Food Preparation & Serving | 27 (61.4%) | 17 (38.6%) |
| Cleaning & Maintenance | 2 (100.0%) | 0 (0.0%) |
| Personal Care & Service | 0 (0.0%) | 4 (100.0%) |
| Total (Category) | 39 (41.5%) | 55 (58.5%) |
| Total (Overall) | 361 (53.0%) | 320 (47.0%) |
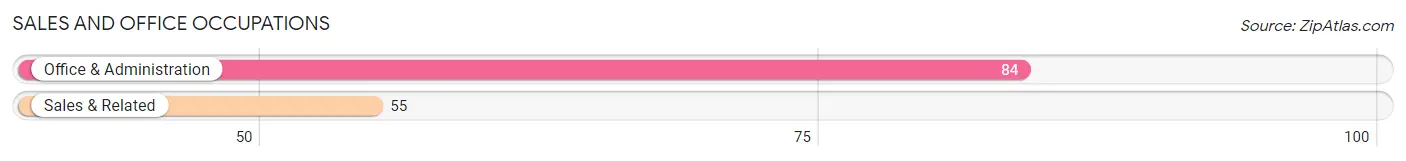
Sales and Office Occupations
The most common Sales and Office occupations in Sedgwick are Office & Administration (84 | 12.3%), and Sales & Related (55 | 8.1%).
Sales and Office Occupations by Sex
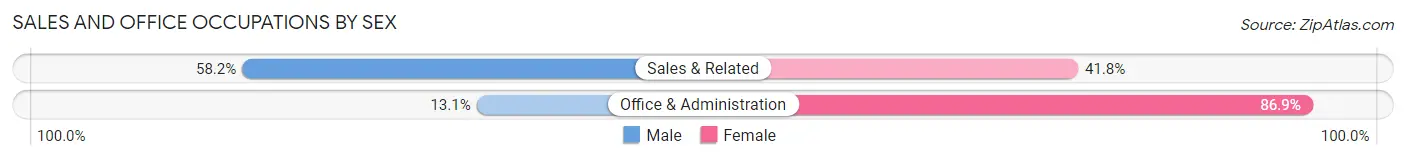
| Occupation | Male | Female |
| Sales & Related | 32 (58.2%) | 23 (41.8%) |
| Office & Administration | 11 (13.1%) | 73 (86.9%) |
| Total (Category) | 43 (30.9%) | 96 (69.1%) |
| Total (Overall) | 361 (53.0%) | 320 (47.0%) |
Natural Resources, Construction and Maintenance Occupations
The most common Natural Resources, Construction and Maintenance occupations in Sedgwick are Installation, Maintenance & Repair (33 | 4.9%), Construction & Extraction (29 | 4.3%), and Farming, Fishing & Forestry (2 | 0.3%).
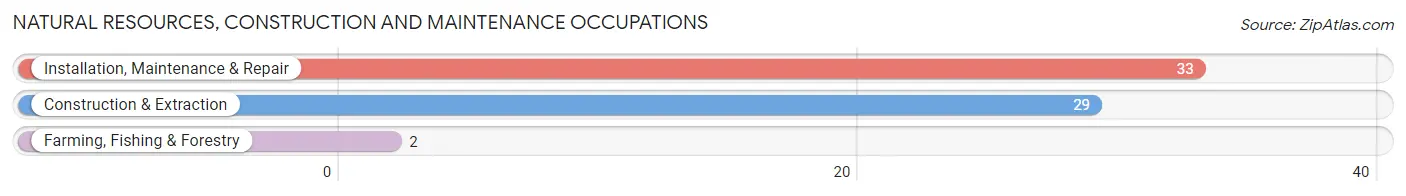
Natural Resources, Construction and Maintenance Occupations by Sex
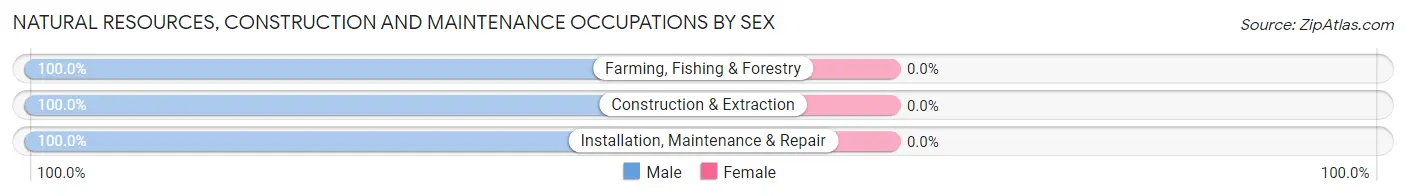
| Occupation | Male | Female |
| Farming, Fishing & Forestry | 2 (100.0%) | 0 (0.0%) |
| Construction & Extraction | 29 (100.0%) | 0 (0.0%) |
| Installation, Maintenance & Repair | 33 (100.0%) | 0 (0.0%) |
| Total (Category) | 64 (100.0%) | 0 (0.0%) |
| Total (Overall) | 361 (53.0%) | 320 (47.0%) |
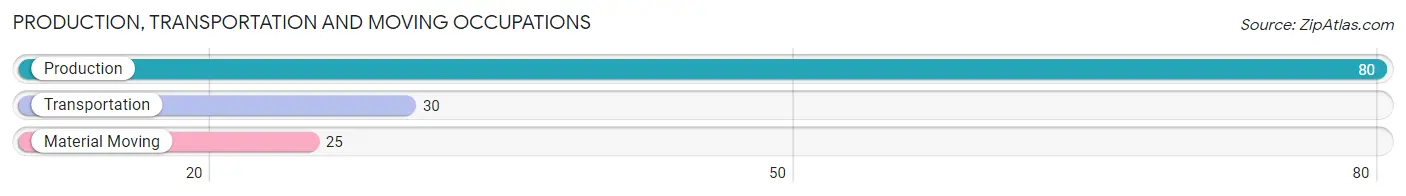
Production, Transportation and Moving Occupations
The most common Production, Transportation and Moving occupations in Sedgwick are Production (80 | 11.7%), Transportation (30 | 4.4%), and Material Moving (25 | 3.7%).
Production, Transportation and Moving Occupations by Sex
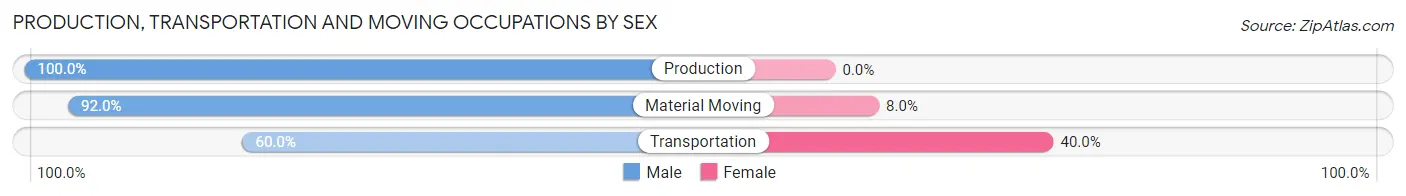
| Occupation | Male | Female |
| Production | 80 (100.0%) | 0 (0.0%) |
| Transportation | 18 (60.0%) | 12 (40.0%) |
| Material Moving | 23 (92.0%) | 2 (8.0%) |
| Total (Category) | 121 (89.6%) | 14 (10.4%) |
| Total (Overall) | 361 (53.0%) | 320 (47.0%) |
Employment Industries by Sex in Sedgwick
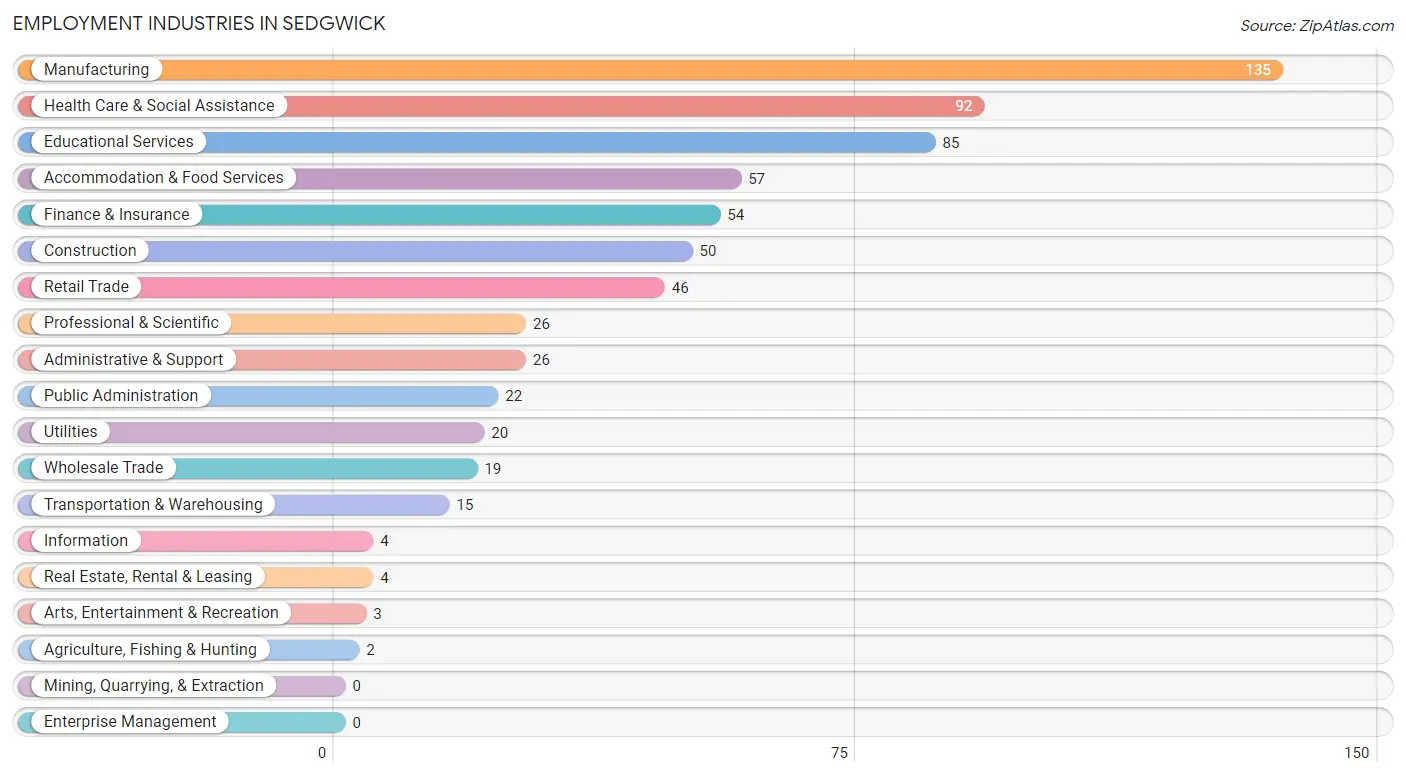
Employment Industries in Sedgwick
The major employment industries in Sedgwick include Manufacturing (135 | 19.8%), Health Care & Social Assistance (92 | 13.5%), Educational Services (85 | 12.5%), Accommodation & Food Services (57 | 8.4%), and Finance & Insurance (54 | 7.9%).
Employment Industries by Sex in Sedgwick
The Sedgwick industries that see more men than women are Agriculture, Fishing & Hunting (100.0%), Utilities (100.0%), and Arts, Entertainment & Recreation (100.0%), whereas the industries that tend to have a higher number of women are Information (100.0%), Real Estate, Rental & Leasing (100.0%), and Health Care & Social Assistance (92.4%).
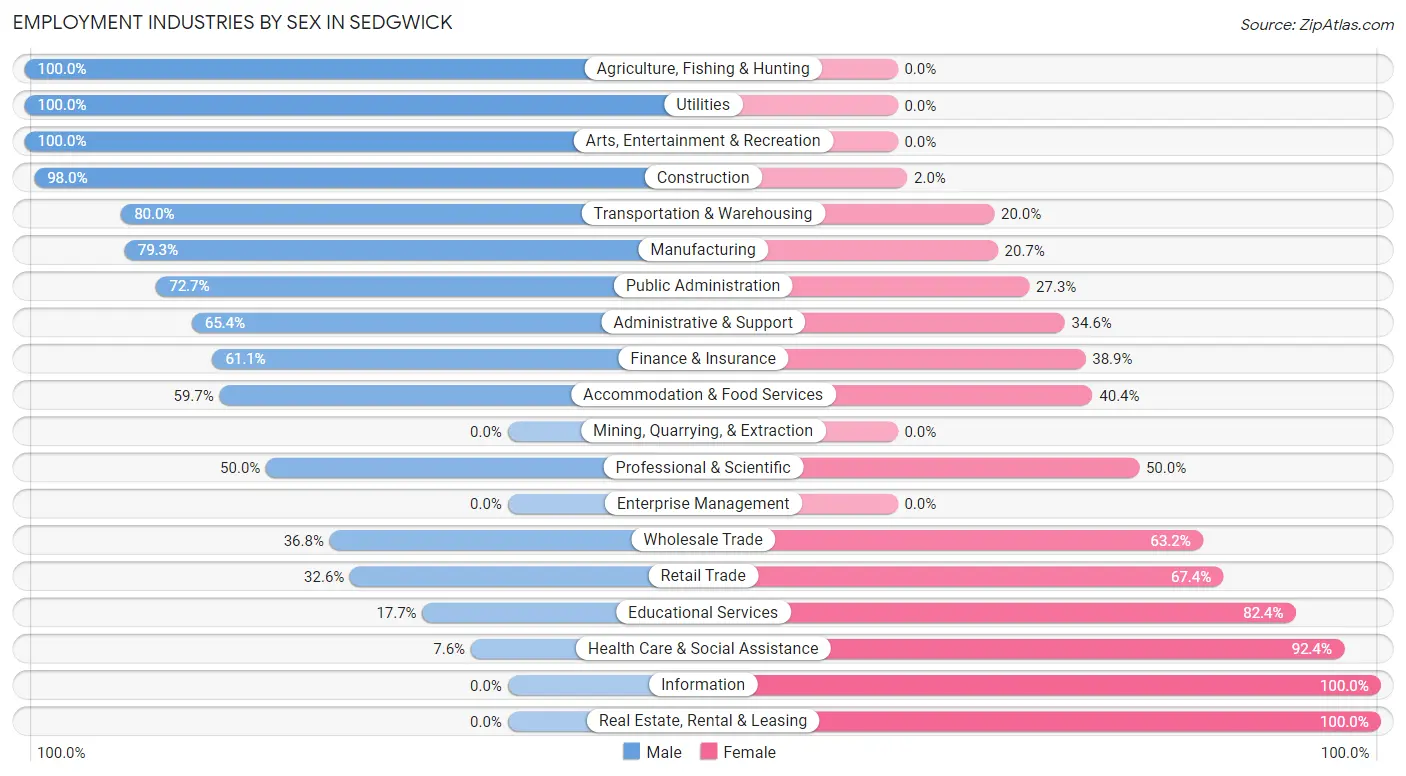
| Industry | Male | Female |
| Agriculture, Fishing & Hunting | 2 (100.0%) | 0 (0.0%) |
| Mining, Quarrying, & Extraction | 0 (0.0%) | 0 (0.0%) |
| Construction | 49 (98.0%) | 1 (2.0%) |
| Manufacturing | 107 (79.3%) | 28 (20.7%) |
| Wholesale Trade | 7 (36.8%) | 12 (63.2%) |
| Retail Trade | 15 (32.6%) | 31 (67.4%) |
| Transportation & Warehousing | 12 (80.0%) | 3 (20.0%) |
| Utilities | 20 (100.0%) | 0 (0.0%) |
| Information | 0 (0.0%) | 4 (100.0%) |
| Finance & Insurance | 33 (61.1%) | 21 (38.9%) |
| Real Estate, Rental & Leasing | 0 (0.0%) | 4 (100.0%) |
| Professional & Scientific | 13 (50.0%) | 13 (50.0%) |
| Enterprise Management | 0 (0.0%) | 0 (0.0%) |
| Administrative & Support | 17 (65.4%) | 9 (34.6%) |
| Educational Services | 15 (17.6%) | 70 (82.4%) |
| Health Care & Social Assistance | 7 (7.6%) | 85 (92.4%) |
| Arts, Entertainment & Recreation | 3 (100.0%) | 0 (0.0%) |
| Accommodation & Food Services | 34 (59.7%) | 23 (40.4%) |
| Public Administration | 16 (72.7%) | 6 (27.3%) |
| Total | 361 (53.0%) | 320 (47.0%) |
Education in Sedgwick
School Enrollment in Sedgwick
The most common levels of schooling among the 415 students in Sedgwick are middle school (121 | 29.2%), elementary school (116 | 28.0%), and high school (101 | 24.3%).
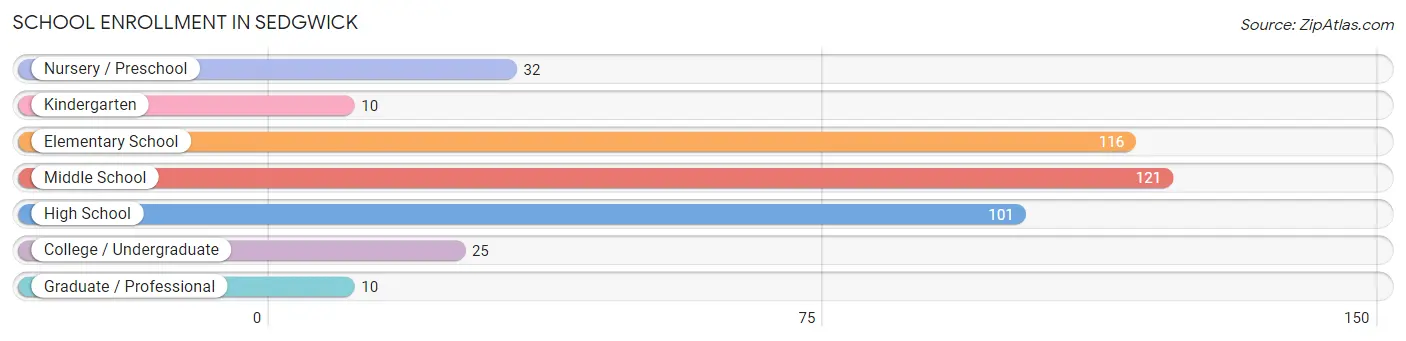
| School Level | # Students | % Students |
| Nursery / Preschool | 32 | 7.7% |
| Kindergarten | 10 | 2.4% |
| Elementary School | 116 | 28.0% |
| Middle School | 121 | 29.2% |
| High School | 101 | 24.3% |
| College / Undergraduate | 25 | 6.0% |
| Graduate / Professional | 10 | 2.4% |
| Total | 415 | 100.0% |
School Enrollment by Age by Funding Source in Sedgwick
Out of a total of 415 students who are enrolled in schools in Sedgwick, 12 (2.9%) attend a private institution, while the remaining 403 (97.1%) are enrolled in public schools. The age group of 25 to 34 year olds has the highest likelihood of being enrolled in private schools, with 3 (12.0% in the age bracket) enrolled. Conversely, the age group of 10 to 14 year olds has the lowest likelihood of being enrolled in a private school, with 143 (100.0% in the age bracket) attending a public institution.
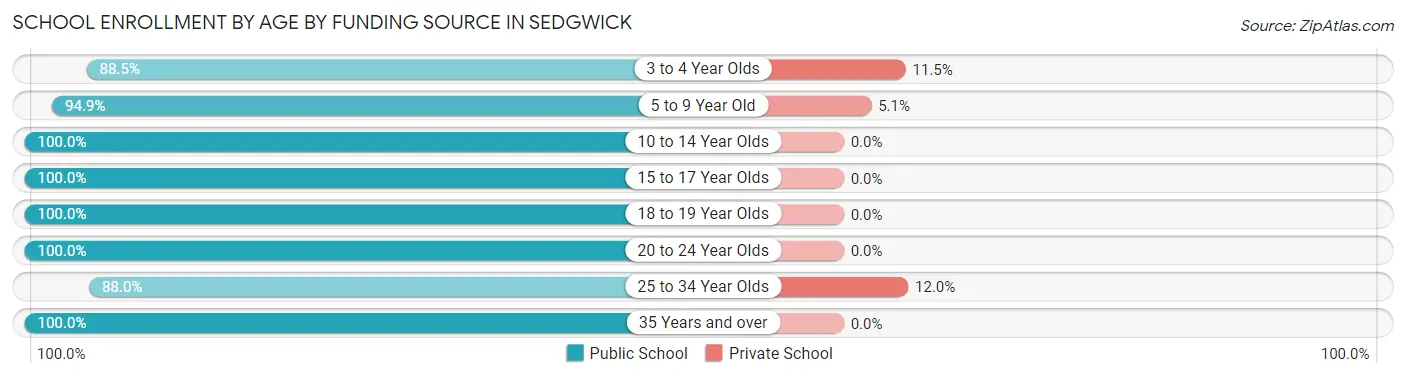
| Age Bracket | Public School | Private School |
| 3 to 4 Year Olds | 23 (88.5%) | 3 (11.5%) |
| 5 to 9 Year Old | 111 (94.9%) | 6 (5.1%) |
| 10 to 14 Year Olds | 143 (100.0%) | 0 (0.0%) |
| 15 to 17 Year Olds | 60 (100.0%) | 0 (0.0%) |
| 18 to 19 Year Olds | 34 (100.0%) | 0 (0.0%) |
| 20 to 24 Year Olds | 2 (100.0%) | 0 (0.0%) |
| 25 to 34 Year Olds | 22 (88.0%) | 3 (12.0%) |
| 35 Years and over | 8 (100.0%) | 0 (0.0%) |
| Total | 403 (97.1%) | 12 (2.9%) |
Educational Attainment by Field of Study in Sedgwick
Education (70 | 25.1%), business (36 | 12.9%), science & technology (34 | 12.2%), physical & health sciences (22 | 7.9%), and bio, nature & agricultural (21 | 7.5%) are the most common fields of study among 279 individuals in Sedgwick who have obtained a bachelor's degree or higher.
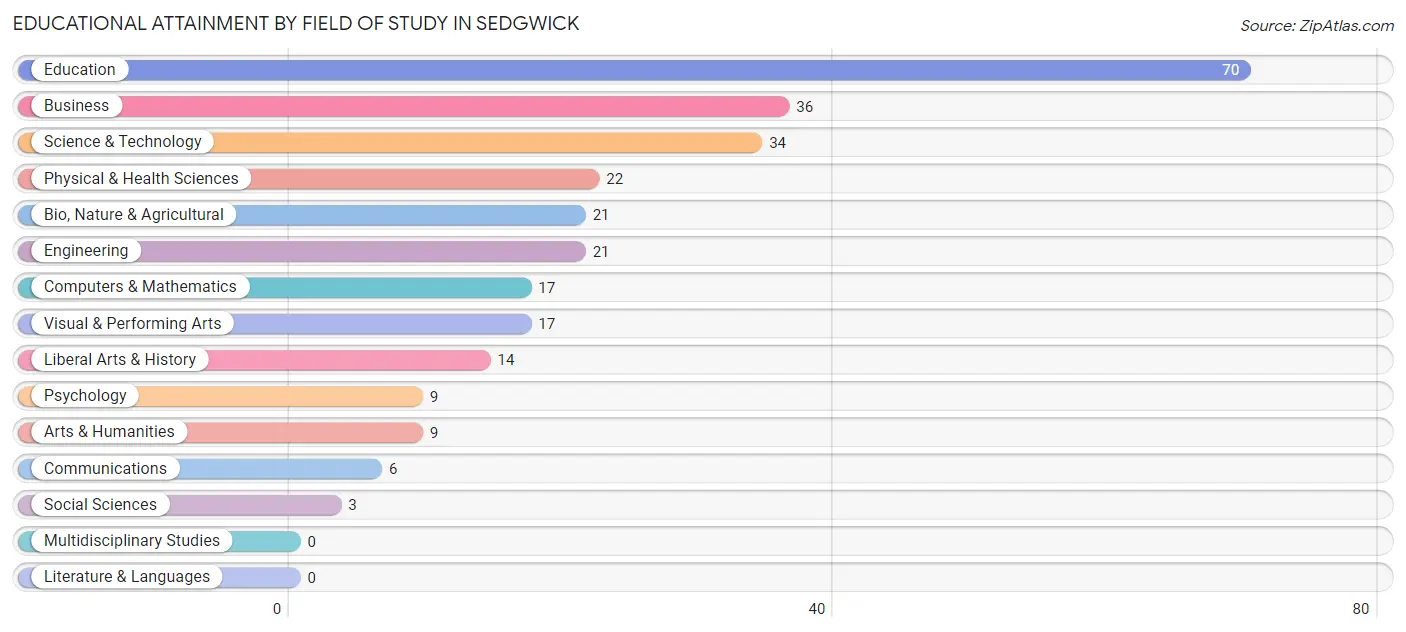
| Field of Study | # Graduates | % Graduates |
| Computers & Mathematics | 17 | 6.1% |
| Bio, Nature & Agricultural | 21 | 7.5% |
| Physical & Health Sciences | 22 | 7.9% |
| Psychology | 9 | 3.2% |
| Social Sciences | 3 | 1.1% |
| Engineering | 21 | 7.5% |
| Multidisciplinary Studies | 0 | 0.0% |
| Science & Technology | 34 | 12.2% |
| Business | 36 | 12.9% |
| Education | 70 | 25.1% |
| Literature & Languages | 0 | 0.0% |
| Liberal Arts & History | 14 | 5.0% |
| Visual & Performing Arts | 17 | 6.1% |
| Communications | 6 | 2.1% |
| Arts & Humanities | 9 | 3.2% |
| Total | 279 | 100.0% |
Transportation & Commute in Sedgwick
Vehicle Availability by Sex in Sedgwick
The most prevalent vehicle ownership categories in Sedgwick are males with 3 vehicles (144, accounting for 39.2%) and females with 3 vehicles (120, making up 45.0%).
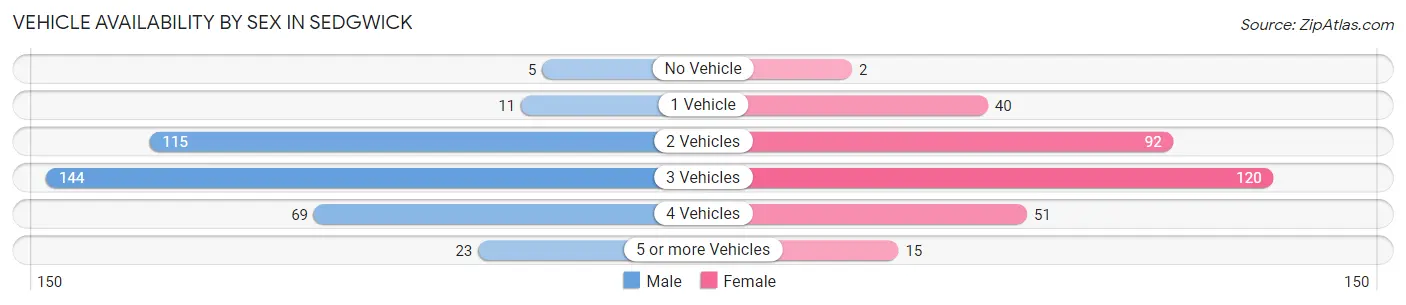
| Vehicles Available | Male | Female |
| No Vehicle | 5 (1.4%) | 2 (0.6%) |
| 1 Vehicle | 11 (3.0%) | 40 (12.5%) |
| 2 Vehicles | 115 (31.3%) | 92 (28.7%) |
| 3 Vehicles | 144 (39.2%) | 120 (37.5%) |
| 4 Vehicles | 69 (18.8%) | 51 (15.9%) |
| 5 or more Vehicles | 23 (6.3%) | 15 (4.7%) |
| Total | 367 (100.0%) | 320 (100.0%) |
Commute Time in Sedgwick
The most frequently occuring commute durations in Sedgwick are 30 to 34 minutes (150 commuters, 22.9%), 20 to 24 minutes (126 commuters, 19.3%), and 5 to 9 minutes (92 commuters, 14.1%).
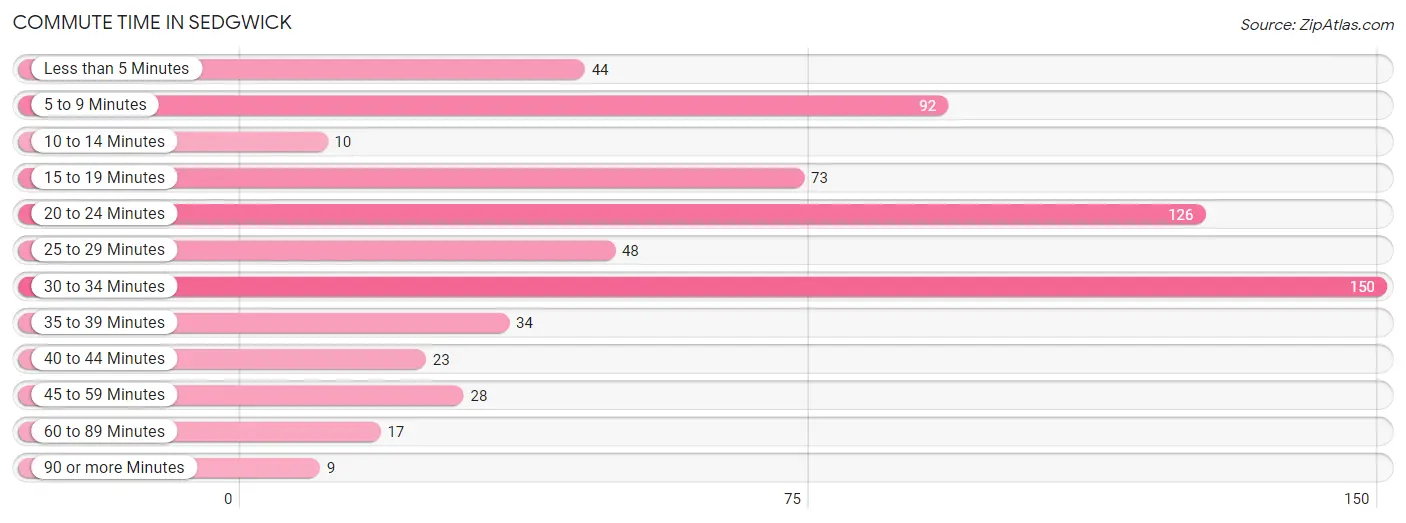
| Commute Time | # Commuters | % Commuters |
| Less than 5 Minutes | 44 | 6.7% |
| 5 to 9 Minutes | 92 | 14.1% |
| 10 to 14 Minutes | 10 | 1.5% |
| 15 to 19 Minutes | 73 | 11.2% |
| 20 to 24 Minutes | 126 | 19.3% |
| 25 to 29 Minutes | 48 | 7.3% |
| 30 to 34 Minutes | 150 | 22.9% |
| 35 to 39 Minutes | 34 | 5.2% |
| 40 to 44 Minutes | 23 | 3.5% |
| 45 to 59 Minutes | 28 | 4.3% |
| 60 to 89 Minutes | 17 | 2.6% |
| 90 or more Minutes | 9 | 1.4% |
Commute Time by Sex in Sedgwick
The most common commute times in Sedgwick are 30 to 34 minutes (99 commuters, 27.4%) for males and 20 to 24 minutes (69 commuters, 23.5%) for females.
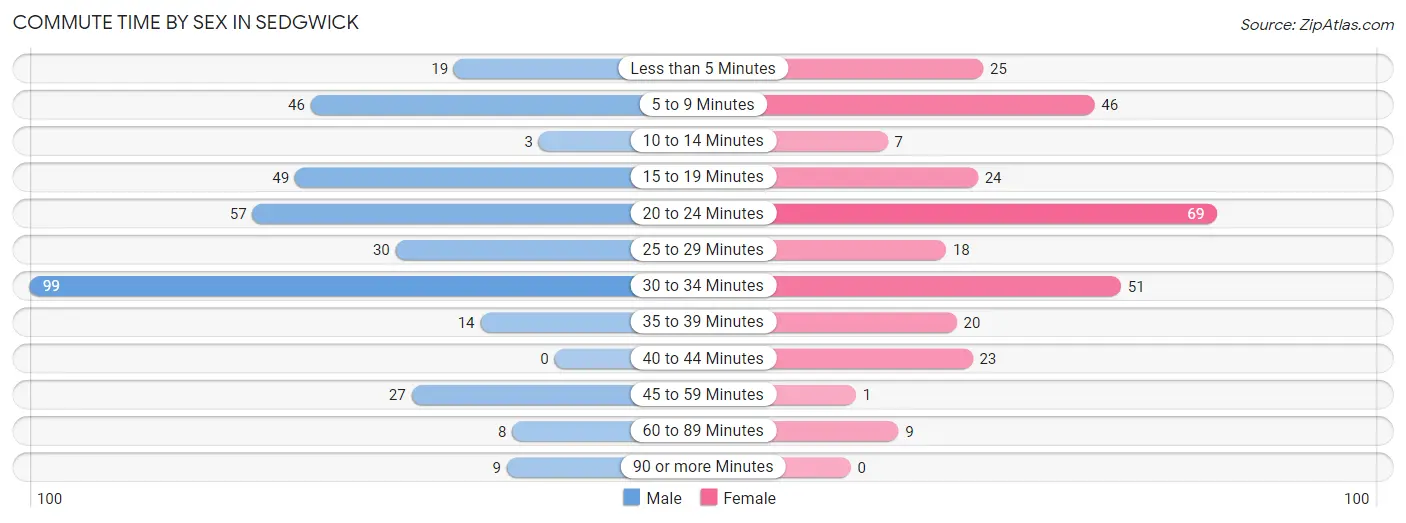
| Commute Time | Male | Female |
| Less than 5 Minutes | 19 (5.3%) | 25 (8.5%) |
| 5 to 9 Minutes | 46 (12.7%) | 46 (15.7%) |
| 10 to 14 Minutes | 3 (0.8%) | 7 (2.4%) |
| 15 to 19 Minutes | 49 (13.6%) | 24 (8.2%) |
| 20 to 24 Minutes | 57 (15.8%) | 69 (23.5%) |
| 25 to 29 Minutes | 30 (8.3%) | 18 (6.1%) |
| 30 to 34 Minutes | 99 (27.4%) | 51 (17.4%) |
| 35 to 39 Minutes | 14 (3.9%) | 20 (6.8%) |
| 40 to 44 Minutes | 0 (0.0%) | 23 (7.9%) |
| 45 to 59 Minutes | 27 (7.5%) | 1 (0.3%) |
| 60 to 89 Minutes | 8 (2.2%) | 9 (3.1%) |
| 90 or more Minutes | 9 (2.5%) | 0 (0.0%) |
Time of Departure to Work by Sex in Sedgwick
The most frequent times of departure to work in Sedgwick are 7:30 AM to 7:59 AM (68, 18.8%) for males and 7:30 AM to 7:59 AM (94, 32.1%) for females.
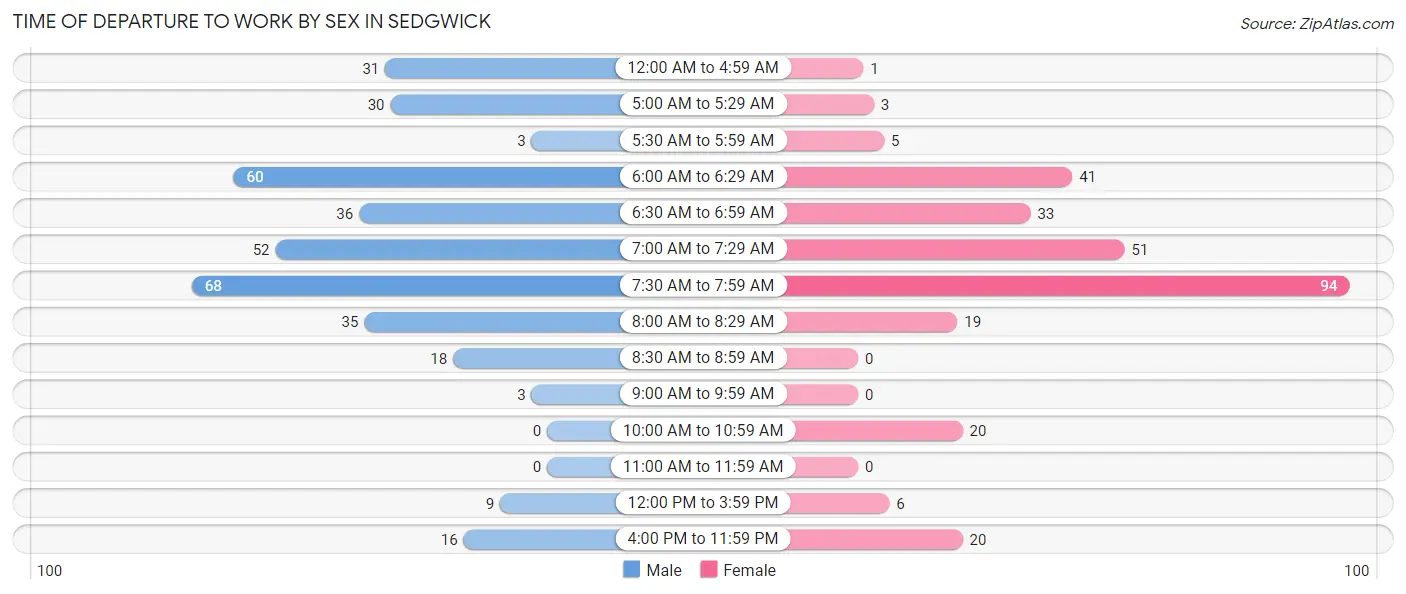
| Time of Departure | Male | Female |
| 12:00 AM to 4:59 AM | 31 (8.6%) | 1 (0.3%) |
| 5:00 AM to 5:29 AM | 30 (8.3%) | 3 (1.0%) |
| 5:30 AM to 5:59 AM | 3 (0.8%) | 5 (1.7%) |
| 6:00 AM to 6:29 AM | 60 (16.6%) | 41 (14.0%) |
| 6:30 AM to 6:59 AM | 36 (10.0%) | 33 (11.3%) |
| 7:00 AM to 7:29 AM | 52 (14.4%) | 51 (17.4%) |
| 7:30 AM to 7:59 AM | 68 (18.8%) | 94 (32.1%) |
| 8:00 AM to 8:29 AM | 35 (9.7%) | 19 (6.5%) |
| 8:30 AM to 8:59 AM | 18 (5.0%) | 0 (0.0%) |
| 9:00 AM to 9:59 AM | 3 (0.8%) | 0 (0.0%) |
| 10:00 AM to 10:59 AM | 0 (0.0%) | 20 (6.8%) |
| 11:00 AM to 11:59 AM | 0 (0.0%) | 0 (0.0%) |
| 12:00 PM to 3:59 PM | 9 (2.5%) | 6 (2.1%) |
| 4:00 PM to 11:59 PM | 16 (4.4%) | 20 (6.8%) |
| Total | 361 (100.0%) | 293 (100.0%) |
Housing Occupancy in Sedgwick
Occupancy by Ownership in Sedgwick
Of the total 546 dwellings in Sedgwick, owner-occupied units account for 398 (72.9%), while renter-occupied units make up 148 (27.1%).
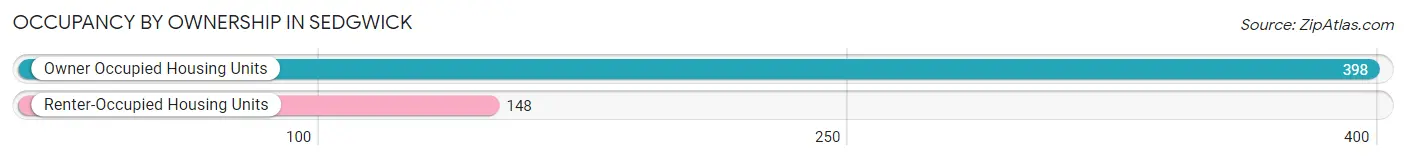
| Occupancy | # Housing Units | % Housing Units |
| Owner Occupied Housing Units | 398 | 72.9% |
| Renter-Occupied Housing Units | 148 | 27.1% |
| Total Occupied Housing Units | 546 | 100.0% |
Occupancy by Household Size in Sedgwick
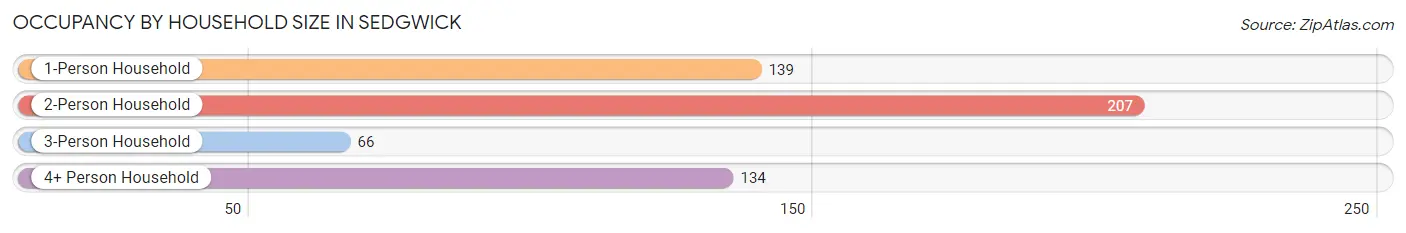
| Household Size | # Housing Units | % Housing Units |
| 1-Person Household | 139 | 25.5% |
| 2-Person Household | 207 | 37.9% |
| 3-Person Household | 66 | 12.1% |
| 4+ Person Household | 134 | 24.5% |
| Total Housing Units | 546 | 100.0% |
Occupancy by Ownership by Household Size in Sedgwick
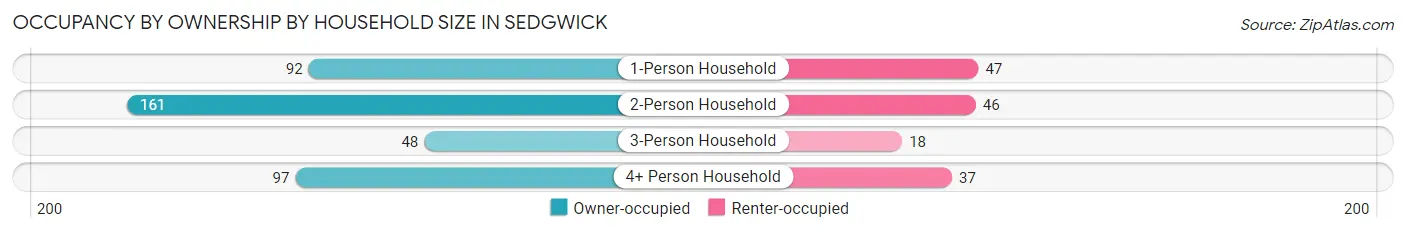
| Household Size | Owner-occupied | Renter-occupied |
| 1-Person Household | 92 (66.2%) | 47 (33.8%) |
| 2-Person Household | 161 (77.8%) | 46 (22.2%) |
| 3-Person Household | 48 (72.7%) | 18 (27.3%) |
| 4+ Person Household | 97 (72.4%) | 37 (27.6%) |
| Total Housing Units | 398 (72.9%) | 148 (27.1%) |
Occupancy by Educational Attainment in Sedgwick
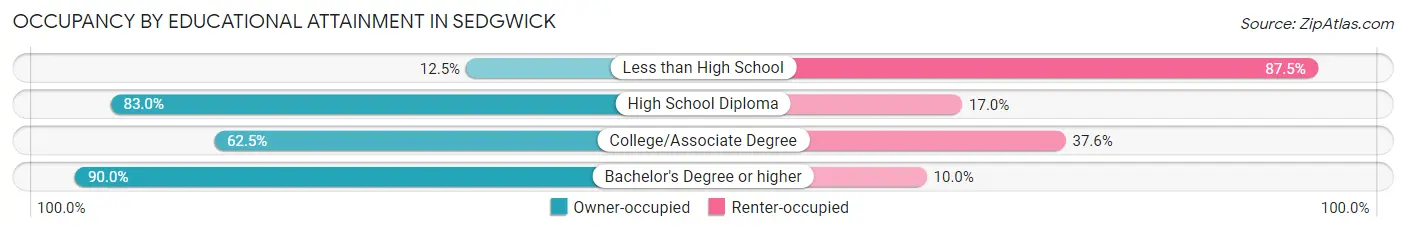
| Household Size | Owner-occupied | Renter-occupied |
| Less than High School | 3 (12.5%) | 21 (87.5%) |
| High School Diploma | 112 (83.0%) | 23 (17.0%) |
| College/Associate Degree | 148 (62.5%) | 89 (37.6%) |
| Bachelor's Degree or higher | 135 (90.0%) | 15 (10.0%) |
Occupancy by Age of Householder in Sedgwick
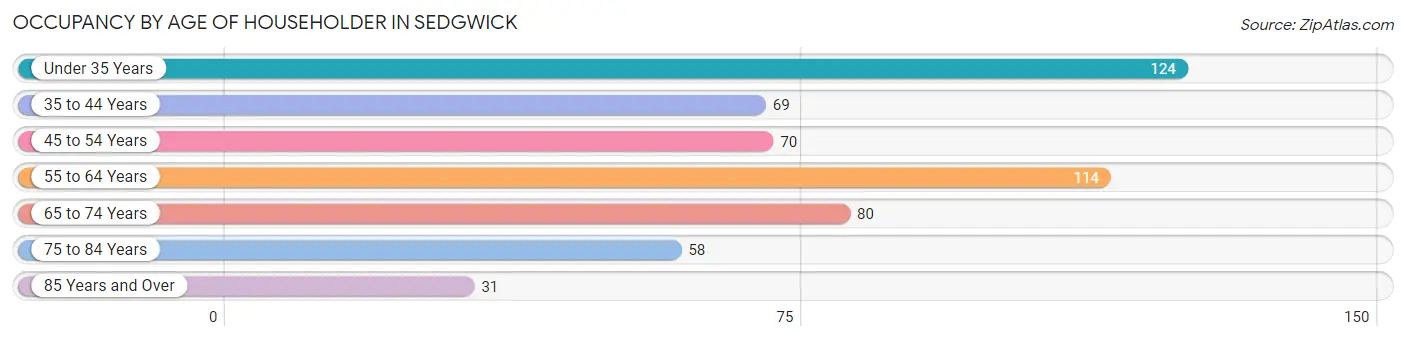
| Age Bracket | # Households | % Households |
| Under 35 Years | 124 | 22.7% |
| 35 to 44 Years | 69 | 12.6% |
| 45 to 54 Years | 70 | 12.8% |
| 55 to 64 Years | 114 | 20.9% |
| 65 to 74 Years | 80 | 14.6% |
| 75 to 84 Years | 58 | 10.6% |
| 85 Years and Over | 31 | 5.7% |
| Total | 546 | 100.0% |
Housing Finances in Sedgwick
Median Income by Occupancy in Sedgwick
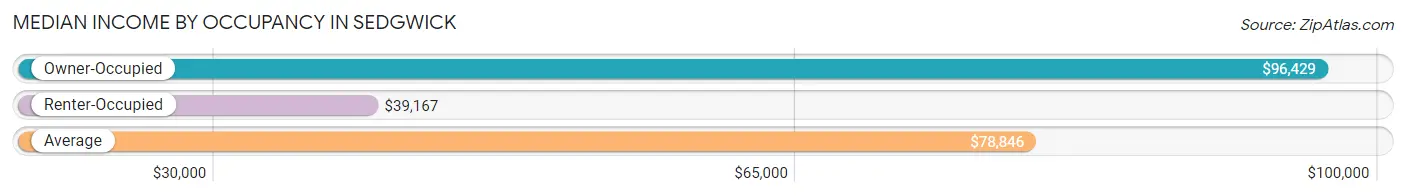
| Occupancy Type | # Households | Median Income |
| Owner-Occupied | 398 (72.9%) | $96,429 |
| Renter-Occupied | 148 (27.1%) | $39,167 |
| Average | 546 (100.0%) | $78,846 |
Occupancy by Householder Income Bracket in Sedgwick
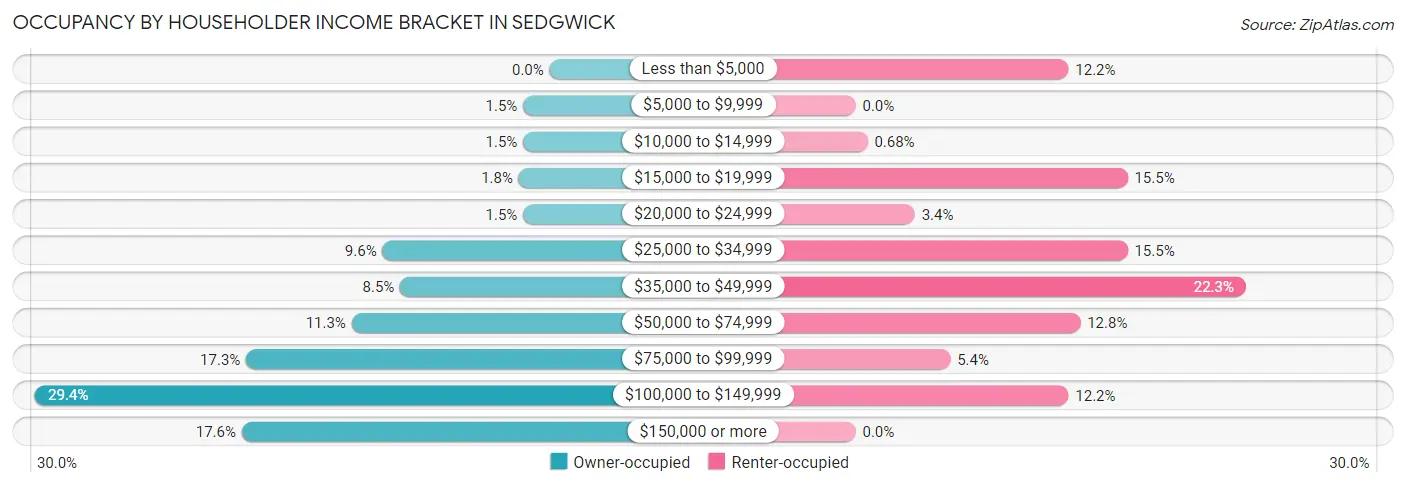
| Income Bracket | Owner-occupied | Renter-occupied |
| Less than $5,000 | 0 (0.0%) | 18 (12.2%) |
| $5,000 to $9,999 | 6 (1.5%) | 0 (0.0%) |
| $10,000 to $14,999 | 6 (1.5%) | 1 (0.7%) |
| $15,000 to $19,999 | 7 (1.8%) | 23 (15.5%) |
| $20,000 to $24,999 | 6 (1.5%) | 5 (3.4%) |
| $25,000 to $34,999 | 38 (9.6%) | 23 (15.5%) |
| $35,000 to $49,999 | 34 (8.5%) | 33 (22.3%) |
| $50,000 to $74,999 | 45 (11.3%) | 19 (12.8%) |
| $75,000 to $99,999 | 69 (17.3%) | 8 (5.4%) |
| $100,000 to $149,999 | 117 (29.4%) | 18 (12.2%) |
| $150,000 or more | 70 (17.6%) | 0 (0.0%) |
| Total | 398 (100.0%) | 148 (100.0%) |
Monthly Housing Cost Tiers in Sedgwick
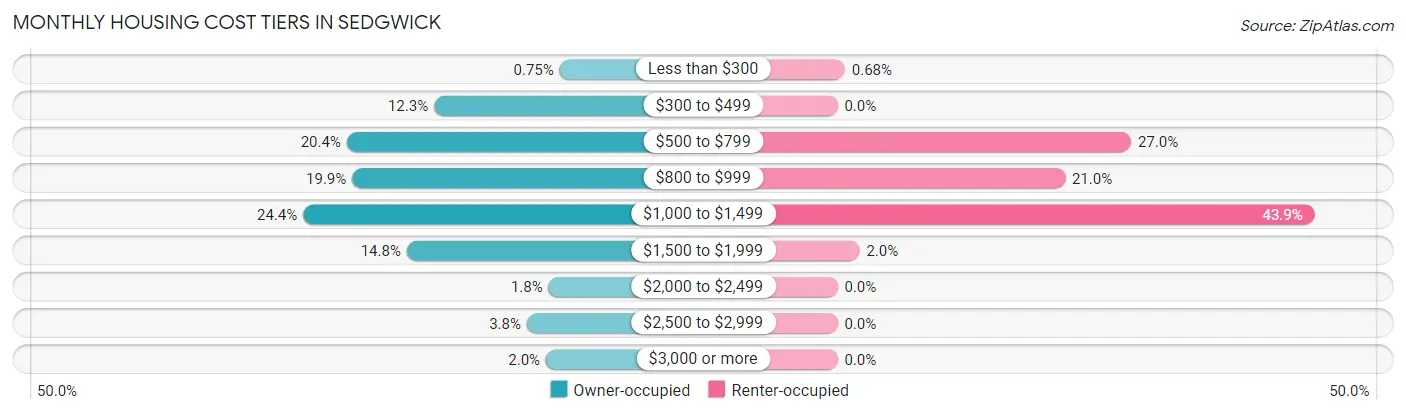
| Monthly Cost | Owner-occupied | Renter-occupied |
| Less than $300 | 3 (0.7%) | 1 (0.7%) |
| $300 to $499 | 49 (12.3%) | 0 (0.0%) |
| $500 to $799 | 81 (20.3%) | 40 (27.0%) |
| $800 to $999 | 79 (19.9%) | 31 (20.9%) |
| $1,000 to $1,499 | 97 (24.4%) | 65 (43.9%) |
| $1,500 to $1,999 | 59 (14.8%) | 3 (2.0%) |
| $2,000 to $2,499 | 7 (1.8%) | 0 (0.0%) |
| $2,500 to $2,999 | 15 (3.8%) | 0 (0.0%) |
| $3,000 or more | 8 (2.0%) | 0 (0.0%) |
| Total | 398 (100.0%) | 148 (100.0%) |
Physical Housing Characteristics in Sedgwick
Housing Structures in Sedgwick
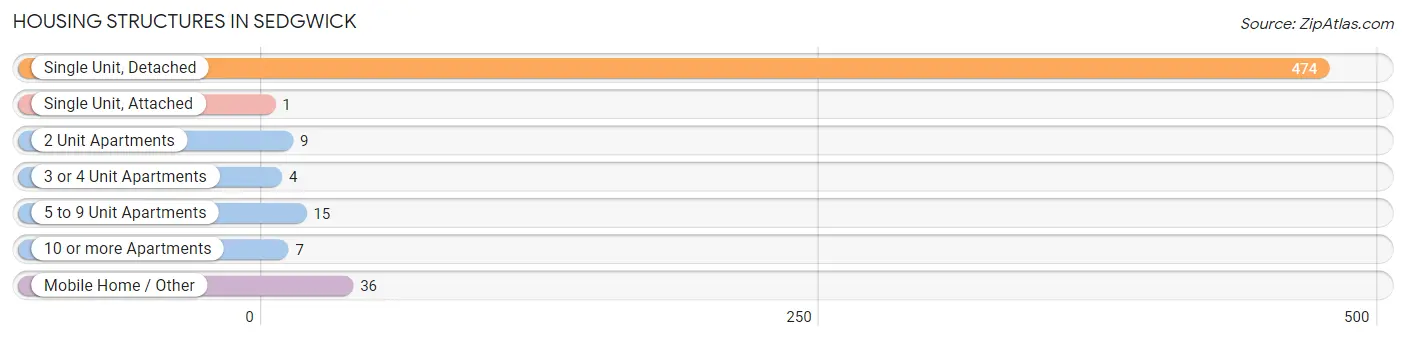
| Structure Type | # Housing Units | % Housing Units |
| Single Unit, Detached | 474 | 86.8% |
| Single Unit, Attached | 1 | 0.2% |
| 2 Unit Apartments | 9 | 1.7% |
| 3 or 4 Unit Apartments | 4 | 0.7% |
| 5 to 9 Unit Apartments | 15 | 2.8% |
| 10 or more Apartments | 7 | 1.3% |
| Mobile Home / Other | 36 | 6.6% |
| Total | 546 | 100.0% |
Housing Structures by Occupancy in Sedgwick
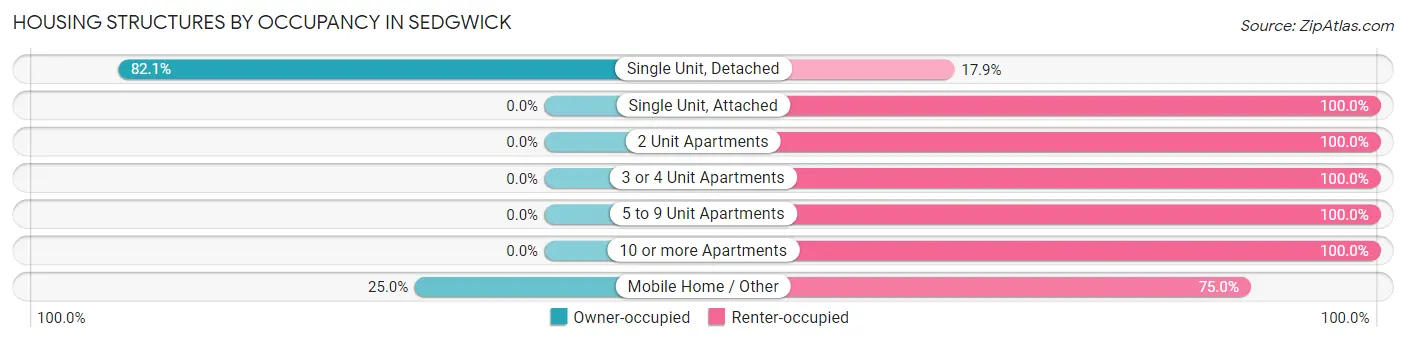
| Structure Type | Owner-occupied | Renter-occupied |
| Single Unit, Detached | 389 (82.1%) | 85 (17.9%) |
| Single Unit, Attached | 0 (0.0%) | 1 (100.0%) |
| 2 Unit Apartments | 0 (0.0%) | 9 (100.0%) |
| 3 or 4 Unit Apartments | 0 (0.0%) | 4 (100.0%) |
| 5 to 9 Unit Apartments | 0 (0.0%) | 15 (100.0%) |
| 10 or more Apartments | 0 (0.0%) | 7 (100.0%) |
| Mobile Home / Other | 9 (25.0%) | 27 (75.0%) |
| Total | 398 (72.9%) | 148 (27.1%) |
Housing Structures by Number of Rooms in Sedgwick
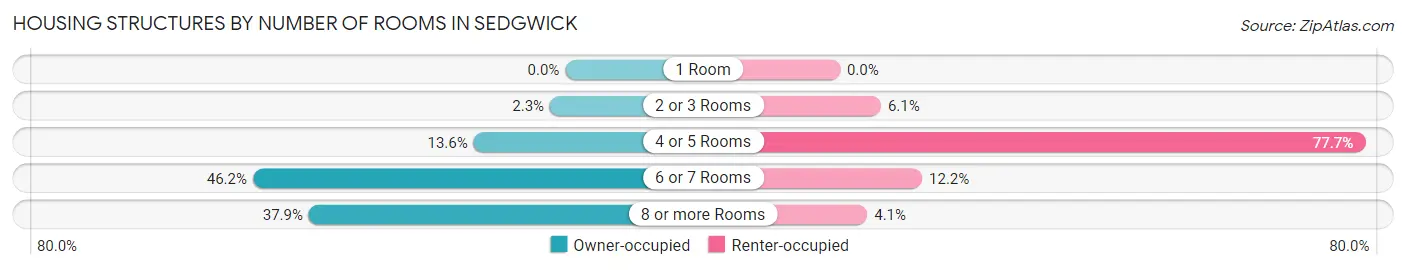
| Number of Rooms | Owner-occupied | Renter-occupied |
| 1 Room | 0 (0.0%) | 0 (0.0%) |
| 2 or 3 Rooms | 9 (2.3%) | 9 (6.1%) |
| 4 or 5 Rooms | 54 (13.6%) | 115 (77.7%) |
| 6 or 7 Rooms | 184 (46.2%) | 18 (12.2%) |
| 8 or more Rooms | 151 (37.9%) | 6 (4.1%) |
| Total | 398 (100.0%) | 148 (100.0%) |
Housing Structure by Heating Type in Sedgwick
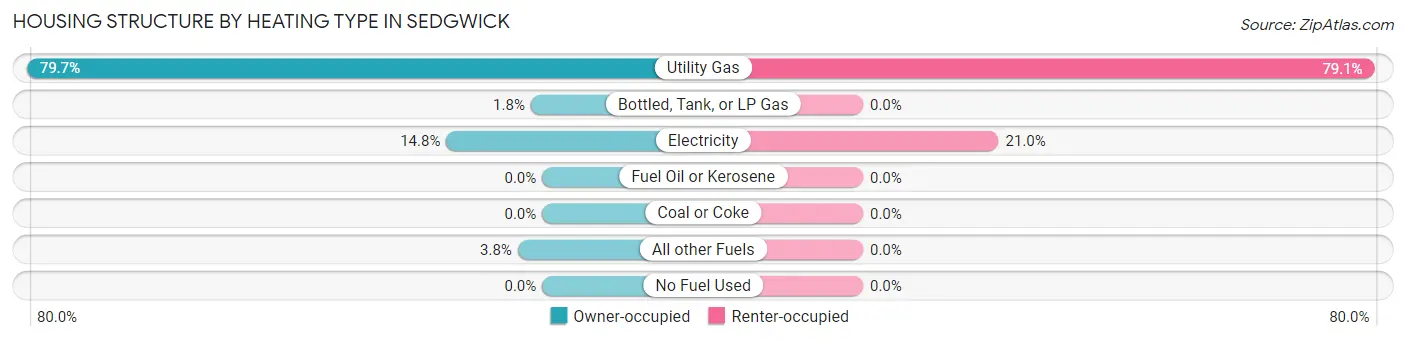
| Heating Type | Owner-occupied | Renter-occupied |
| Utility Gas | 317 (79.6%) | 117 (79.0%) |
| Bottled, Tank, or LP Gas | 7 (1.8%) | 0 (0.0%) |
| Electricity | 59 (14.8%) | 31 (20.9%) |
| Fuel Oil or Kerosene | 0 (0.0%) | 0 (0.0%) |
| Coal or Coke | 0 (0.0%) | 0 (0.0%) |
| All other Fuels | 15 (3.8%) | 0 (0.0%) |
| No Fuel Used | 0 (0.0%) | 0 (0.0%) |
| Total | 398 (100.0%) | 148 (100.0%) |
Household Vehicle Usage in Sedgwick
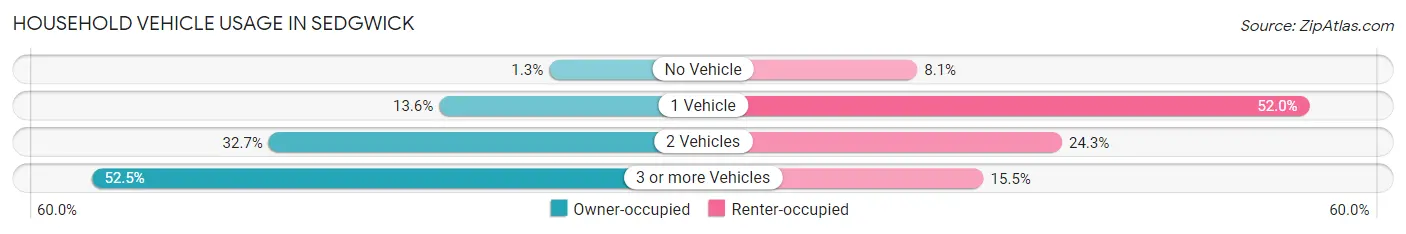
| Vehicles per Household | Owner-occupied | Renter-occupied |
| No Vehicle | 5 (1.3%) | 12 (8.1%) |
| 1 Vehicle | 54 (13.6%) | 77 (52.0%) |
| 2 Vehicles | 130 (32.7%) | 36 (24.3%) |
| 3 or more Vehicles | 209 (52.5%) | 23 (15.5%) |
| Total | 398 (100.0%) | 148 (100.0%) |
Real Estate & Mortgages in Sedgwick
Real Estate and Mortgage Overview in Sedgwick
| Characteristic | Without Mortgage | With Mortgage |
| Housing Units | 173 | 225 |
| Median Property Value | $145,300 | $155,600 |
| Median Household Income | $58,125 | $37 |
| Monthly Housing Costs | $591 | $8 |
| Real Estate Taxes | $1,974 | $21 |
Property Value by Mortgage Status in Sedgwick
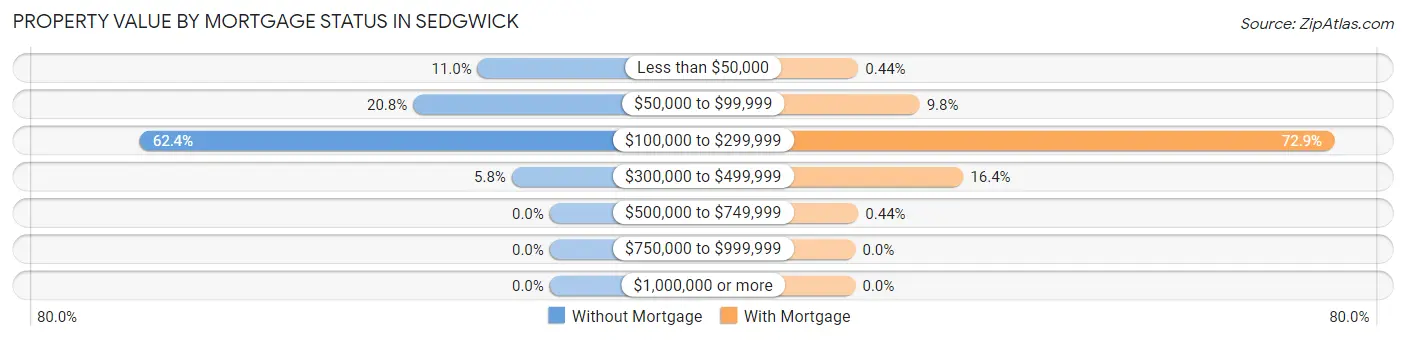
| Property Value | Without Mortgage | With Mortgage |
| Less than $50,000 | 19 (11.0%) | 1 (0.4%) |
| $50,000 to $99,999 | 36 (20.8%) | 22 (9.8%) |
| $100,000 to $299,999 | 108 (62.4%) | 164 (72.9%) |
| $300,000 to $499,999 | 10 (5.8%) | 37 (16.4%) |
| $500,000 to $749,999 | 0 (0.0%) | 1 (0.4%) |
| $750,000 to $999,999 | 0 (0.0%) | 0 (0.0%) |
| $1,000,000 or more | 0 (0.0%) | 0 (0.0%) |
| Total | 173 (100.0%) | 225 (100.0%) |
Household Income by Mortgage Status in Sedgwick
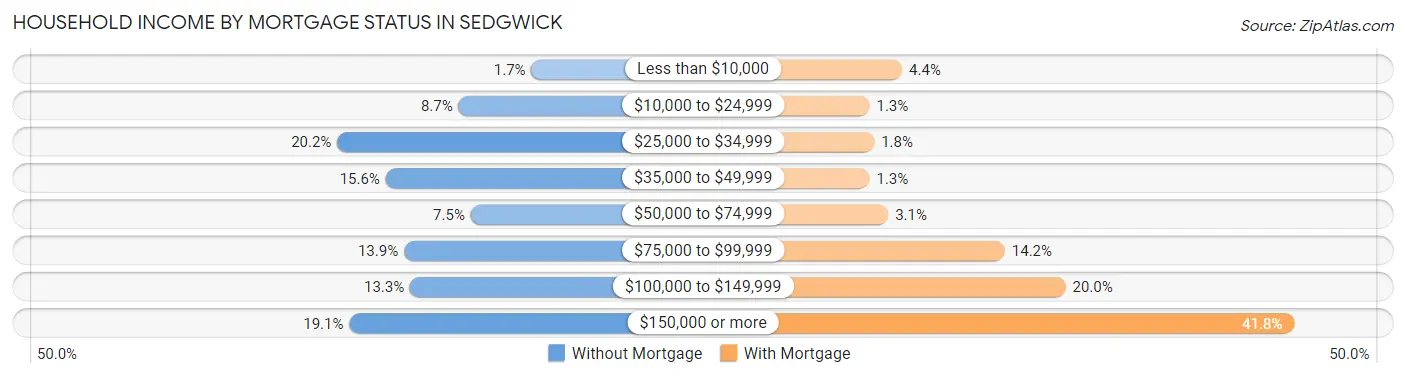
| Household Income | Without Mortgage | With Mortgage |
| Less than $10,000 | 3 (1.7%) | 10 (4.4%) |
| $10,000 to $24,999 | 15 (8.7%) | 3 (1.3%) |
| $25,000 to $34,999 | 35 (20.2%) | 4 (1.8%) |
| $35,000 to $49,999 | 27 (15.6%) | 3 (1.3%) |
| $50,000 to $74,999 | 13 (7.5%) | 7 (3.1%) |
| $75,000 to $99,999 | 24 (13.9%) | 32 (14.2%) |
| $100,000 to $149,999 | 23 (13.3%) | 45 (20.0%) |
| $150,000 or more | 33 (19.1%) | 94 (41.8%) |
| Total | 173 (100.0%) | 225 (100.0%) |
Property Value to Household Income Ratio in Sedgwick
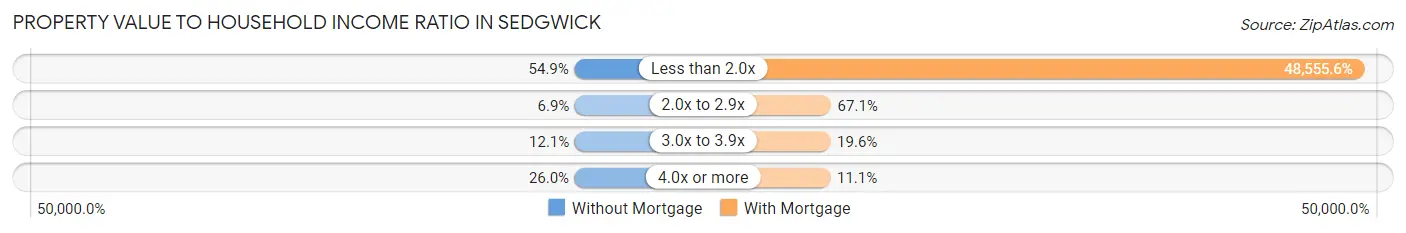
| Value-to-Income Ratio | Without Mortgage | With Mortgage |
| Less than 2.0x | 95 (54.9%) | 109,250 (48,555.6%) |
| 2.0x to 2.9x | 12 (6.9%) | 151 (67.1%) |
| 3.0x to 3.9x | 21 (12.1%) | 44 (19.6%) |
| 4.0x or more | 45 (26.0%) | 25 (11.1%) |
| Total | 173 (100.0%) | 225 (100.0%) |
Real Estate Taxes by Mortgage Status in Sedgwick
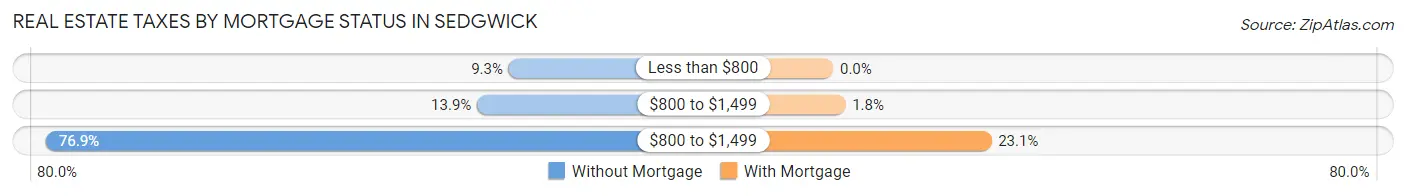
| Property Taxes | Without Mortgage | With Mortgage |
| Less than $800 | 16 (9.2%) | 0 (0.0%) |
| $800 to $1,499 | 24 (13.9%) | 4 (1.8%) |
| $800 to $1,499 | 133 (76.9%) | 52 (23.1%) |
| Total | 173 (100.0%) | 225 (100.0%) |
Health & Disability in Sedgwick
Health Insurance Coverage by Age in Sedgwick
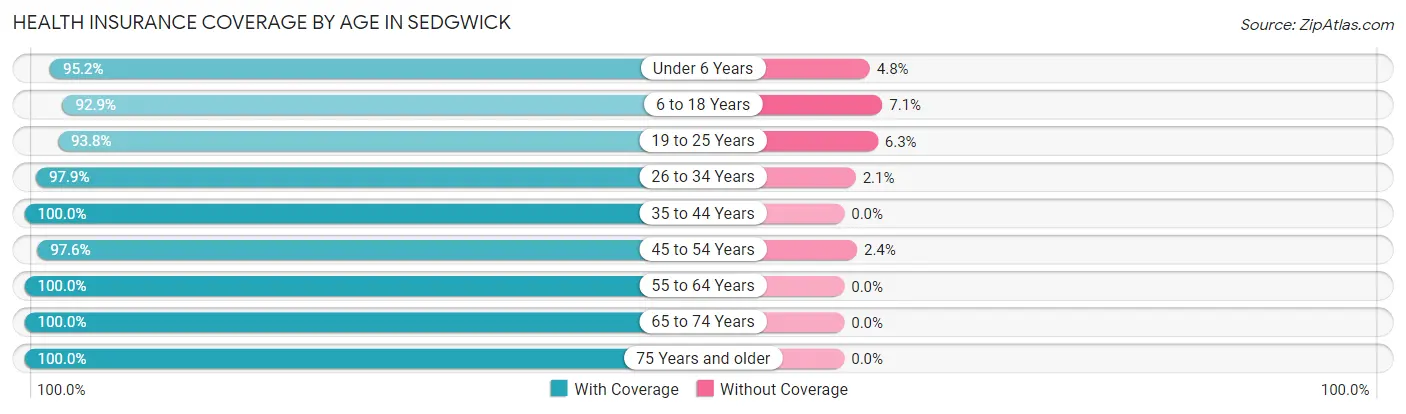
| Age Bracket | With Coverage | Without Coverage |
| Under 6 Years | 80 (95.2%) | 4 (4.8%) |
| 6 to 18 Years | 340 (92.9%) | 26 (7.1%) |
| 19 to 25 Years | 30 (93.8%) | 2 (6.2%) |
| 26 to 34 Years | 184 (97.9%) | 4 (2.1%) |
| 35 to 44 Years | 145 (100.0%) | 0 (0.0%) |
| 45 to 54 Years | 164 (97.6%) | 4 (2.4%) |
| 55 to 64 Years | 173 (100.0%) | 0 (0.0%) |
| 65 to 74 Years | 116 (100.0%) | 0 (0.0%) |
| 75 Years and older | 133 (100.0%) | 0 (0.0%) |
| Total | 1,365 (97.2%) | 40 (2.9%) |
Health Insurance Coverage by Citizenship Status in Sedgwick
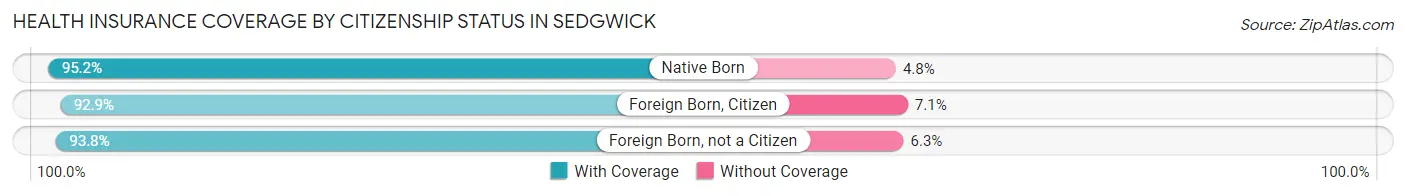
| Citizenship Status | With Coverage | Without Coverage |
| Native Born | 80 (95.2%) | 4 (4.8%) |
| Foreign Born, Citizen | 340 (92.9%) | 26 (7.1%) |
| Foreign Born, not a Citizen | 30 (93.8%) | 2 (6.2%) |
Health Insurance Coverage by Household Income in Sedgwick
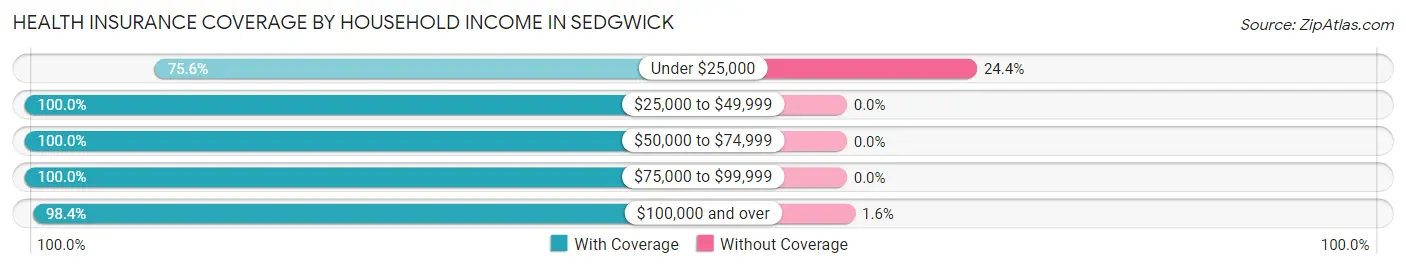
| Household Income | With Coverage | Without Coverage |
| Under $25,000 | 93 (75.6%) | 30 (24.4%) |
| $25,000 to $49,999 | 237 (100.0%) | 0 (0.0%) |
| $50,000 to $74,999 | 154 (100.0%) | 0 (0.0%) |
| $75,000 to $99,999 | 250 (100.0%) | 0 (0.0%) |
| $100,000 and over | 631 (98.4%) | 10 (1.6%) |
Public vs Private Health Insurance Coverage by Age in Sedgwick
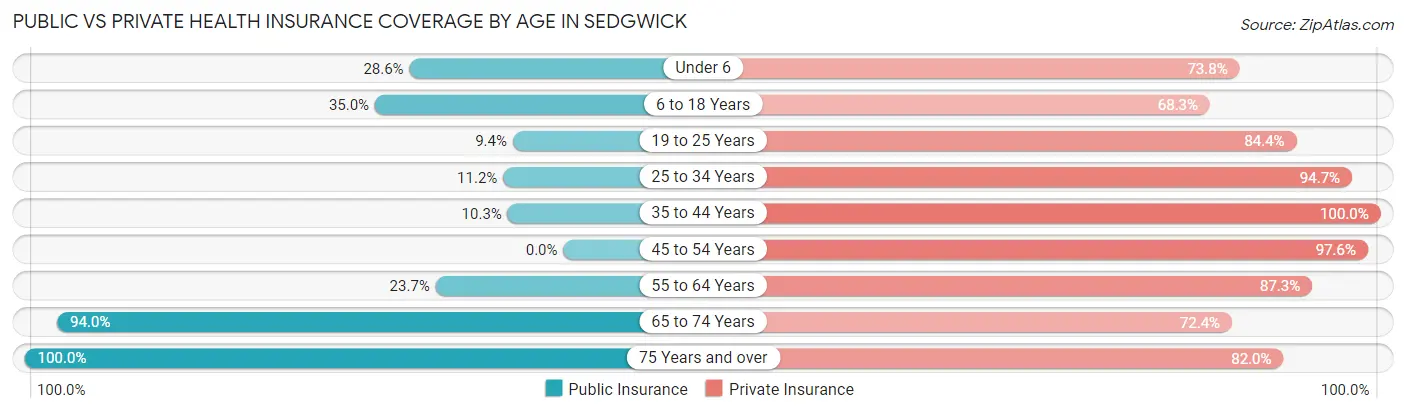
| Age Bracket | Public Insurance | Private Insurance |
| Under 6 | 24 (28.6%) | 62 (73.8%) |
| 6 to 18 Years | 128 (35.0%) | 250 (68.3%) |
| 19 to 25 Years | 3 (9.4%) | 27 (84.4%) |
| 25 to 34 Years | 21 (11.2%) | 178 (94.7%) |
| 35 to 44 Years | 15 (10.3%) | 145 (100.0%) |
| 45 to 54 Years | 0 (0.0%) | 164 (97.6%) |
| 55 to 64 Years | 41 (23.7%) | 151 (87.3%) |
| 65 to 74 Years | 109 (94.0%) | 84 (72.4%) |
| 75 Years and over | 133 (100.0%) | 109 (82.0%) |
| Total | 474 (33.7%) | 1,170 (83.3%) |
Disability Status by Sex by Age in Sedgwick
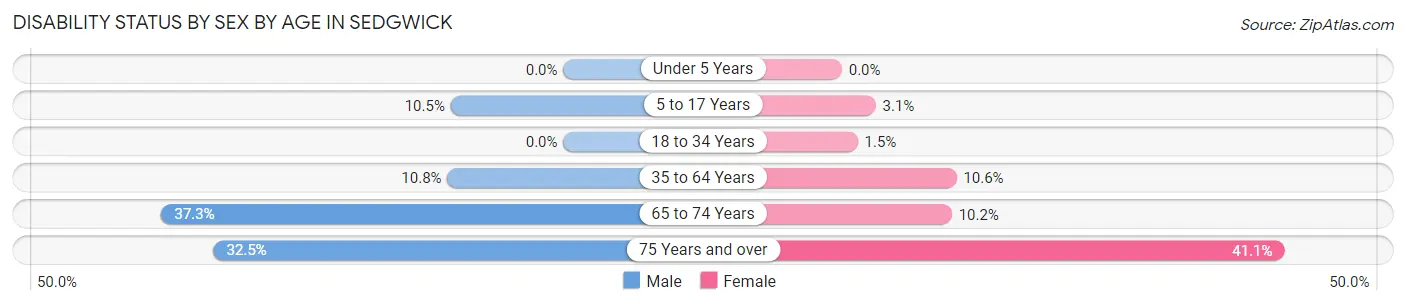
| Age Bracket | Male | Female |
| Under 5 Years | 0 (0.0%) | 0 (0.0%) |
| 5 to 17 Years | 14 (10.4%) | 6 (3.1%) |
| 18 to 34 Years | 0 (0.0%) | 2 (1.5%) |
| 35 to 64 Years | 27 (10.8%) | 25 (10.6%) |
| 65 to 74 Years | 25 (37.3%) | 5 (10.2%) |
| 75 Years and over | 25 (32.5%) | 23 (41.1%) |
Disability Class by Sex by Age in Sedgwick
Disability Class: Hearing Difficulty
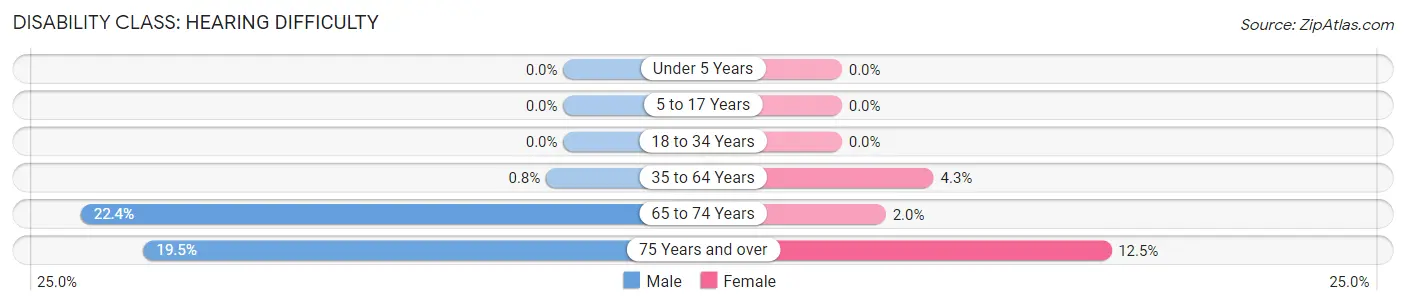
| Age Bracket | Male | Female |
| Under 5 Years | 0 (0.0%) | 0 (0.0%) |
| 5 to 17 Years | 0 (0.0%) | 0 (0.0%) |
| 18 to 34 Years | 0 (0.0%) | 0 (0.0%) |
| 35 to 64 Years | 2 (0.8%) | 10 (4.3%) |
| 65 to 74 Years | 15 (22.4%) | 1 (2.0%) |
| 75 Years and over | 15 (19.5%) | 7 (12.5%) |
Disability Class: Vision Difficulty
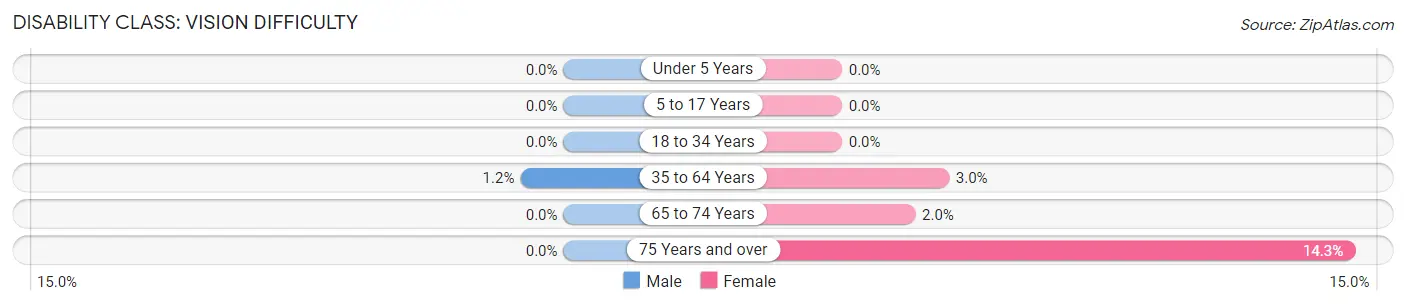
| Age Bracket | Male | Female |
| Under 5 Years | 0 (0.0%) | 0 (0.0%) |
| 5 to 17 Years | 0 (0.0%) | 0 (0.0%) |
| 18 to 34 Years | 0 (0.0%) | 0 (0.0%) |
| 35 to 64 Years | 3 (1.2%) | 7 (3.0%) |
| 65 to 74 Years | 0 (0.0%) | 1 (2.0%) |
| 75 Years and over | 0 (0.0%) | 8 (14.3%) |
Disability Class: Cognitive Difficulty
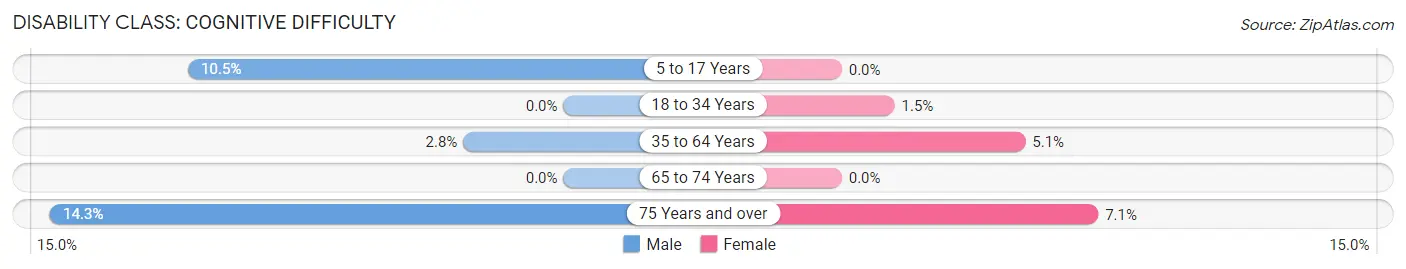
| Age Bracket | Male | Female |
| 5 to 17 Years | 14 (10.4%) | 0 (0.0%) |
| 18 to 34 Years | 0 (0.0%) | 2 (1.5%) |
| 35 to 64 Years | 7 (2.8%) | 12 (5.1%) |
| 65 to 74 Years | 0 (0.0%) | 0 (0.0%) |
| 75 Years and over | 11 (14.3%) | 4 (7.1%) |
Disability Class: Ambulatory Difficulty
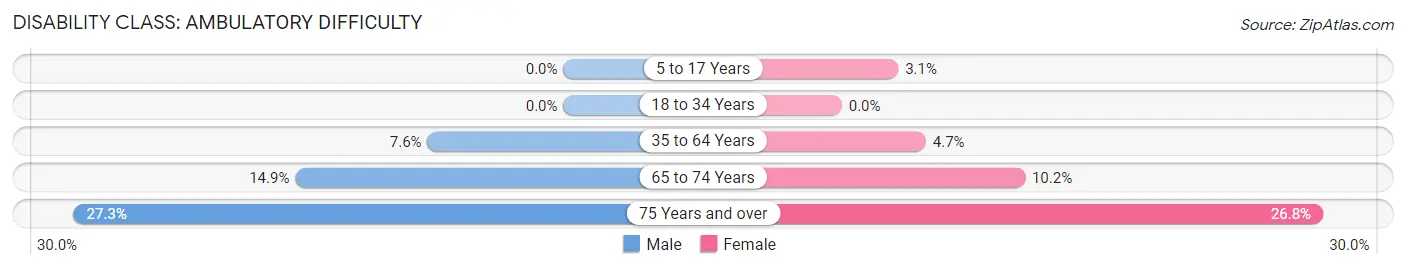
| Age Bracket | Male | Female |
| 5 to 17 Years | 0 (0.0%) | 6 (3.1%) |
| 18 to 34 Years | 0 (0.0%) | 0 (0.0%) |
| 35 to 64 Years | 19 (7.6%) | 11 (4.7%) |
| 65 to 74 Years | 10 (14.9%) | 5 (10.2%) |
| 75 Years and over | 21 (27.3%) | 15 (26.8%) |
Disability Class: Self-Care Difficulty
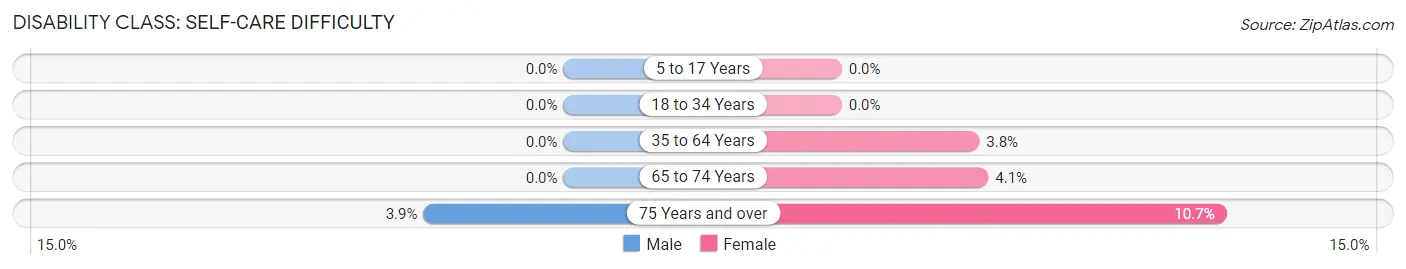
| Age Bracket | Male | Female |
| 5 to 17 Years | 0 (0.0%) | 0 (0.0%) |
| 18 to 34 Years | 0 (0.0%) | 0 (0.0%) |
| 35 to 64 Years | 0 (0.0%) | 9 (3.8%) |
| 65 to 74 Years | 0 (0.0%) | 2 (4.1%) |
| 75 Years and over | 3 (3.9%) | 6 (10.7%) |
Technology Access in Sedgwick
Computing Device Access in Sedgwick
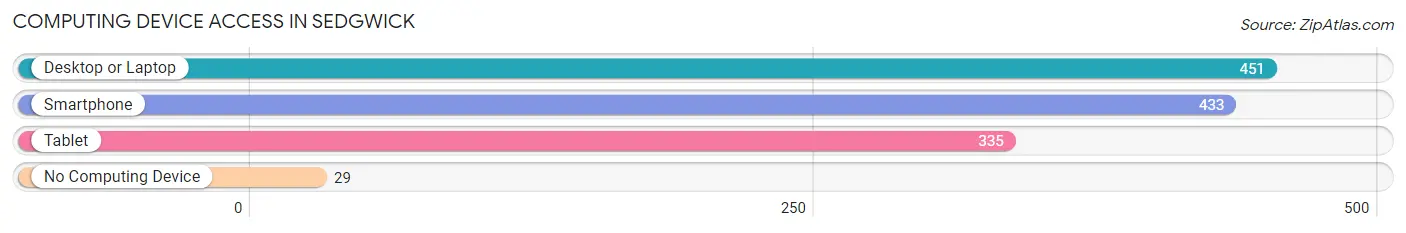
| Device Type | # Households | % Households |
| Desktop or Laptop | 451 | 82.6% |
| Smartphone | 433 | 79.3% |
| Tablet | 335 | 61.4% |
| No Computing Device | 29 | 5.3% |
| Total | 546 | 100.0% |
Internet Access in Sedgwick
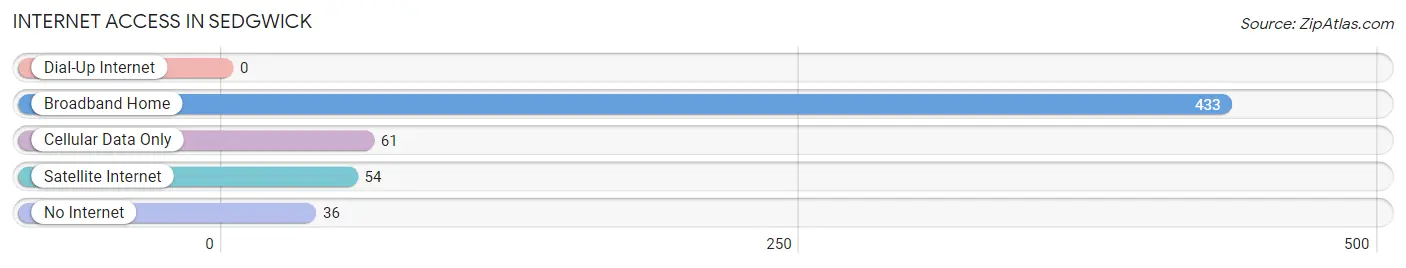
| Internet Type | # Households | % Households |
| Dial-Up Internet | 0 | 0.0% |
| Broadband Home | 433 | 79.3% |
| Cellular Data Only | 61 | 11.2% |
| Satellite Internet | 54 | 9.9% |
| No Internet | 36 | 6.6% |
| Total | 546 | 100.0% |
Sedgwick Summary
Sedgwick, Kansas is a small city located in Harvey County, in the south-central part of the state. It is situated on the banks of the Arkansas River, about 25 miles north of Wichita. The city has a population of approximately 2,500 people, and is part of the Wichita metropolitan area.
History
Sedgwick was founded in 1871 by a group of settlers from Ohio. The city was named after John Sedgwick, a Union Army general who fought in the Civil War. The city was incorporated in 1887, and the first post office was established in 1891.
In the early 1900s, Sedgwick was a thriving agricultural community, with a variety of crops being grown in the area. The city was also home to several businesses, including a flour mill, a creamery, and a brickyard.
In the 1950s, Sedgwick began to experience a population boom, as people moved to the city from other parts of the state. This growth continued into the 1960s and 1970s, and the city’s population reached its peak in 1980, with a population of 3,400.
Geography
Sedgwick is located in south-central Kansas, about 25 miles north of Wichita. The city is situated on the banks of the Arkansas River, and is surrounded by rolling hills and farmland. The city has a total area of 2.2 square miles, all of which is land.
The climate in Sedgwick is typical of the Great Plains, with hot summers and cold winters. The average annual temperature is 54 degrees Fahrenheit, and the average annual precipitation is about 30 inches.
Economy
Sedgwick’s economy is largely based on agriculture. The city is home to several farms, which produce a variety of crops, including wheat, corn, soybeans, and sorghum. The city is also home to several businesses, including a lumber yard, a feed store, and a hardware store.
The city is also home to several manufacturing companies, including a plastics manufacturer and a metal fabrication company. The city is also home to several retail stores, including a grocery store, a drug store, and a variety of other shops.
Demographics
As of the 2010 census, the population of Sedgwick was 2,521. The racial makeup of the city was 95.3% White, 0.7% African American, 0.3% Native American, 0.4% Asian, 0.1% Pacific Islander, 1.2% from other races, and 2.0% from two or more races. Hispanic or Latino of any race were 3.2% of the population.
The median household income in Sedgwick was $41,250, and the median family income was $48,750. The per capita income was $19,945. About 11.2% of families and 14.2% of the population were below the poverty line, including 19.2% of those under age 18 and 8.2% of those age 65 or over.
Sedgwick is a small city with a rich history and a diverse economy. The city is home to a variety of businesses, and the population is diverse and growing. The city is a great place to live, work, and raise a family.
Common Questions
What is Per Capita Income in Sedgwick?
Per Capita income in Sedgwick is $35,744.
What is the Median Family Income in Sedgwick?
Median Family Income in Sedgwick is $98,250.
What is the Median Household income in Sedgwick?
Median Household Income in Sedgwick is $78,846.
What is Income or Wage Gap in Sedgwick?
Income or Wage Gap in Sedgwick is 42.8%.
Women in Sedgwick earn 57.2 cents for every dollar earned by a man.
What is Inequality or Gini Index in Sedgwick?
Inequality or Gini Index in Sedgwick is 0.38.
What is the Total Population of Sedgwick?
Total Population of Sedgwick is 1,465.
What is the Total Male Population of Sedgwick?
Total Male Population of Sedgwick is 727.
What is the Total Female Population of Sedgwick?
Total Female Population of Sedgwick is 738.
What is the Ratio of Males per 100 Females in Sedgwick?
There are 98.51 Males per 100 Females in Sedgwick.
What is the Ratio of Females per 100 Males in Sedgwick?
There are 101.51 Females per 100 Males in Sedgwick.
What is the Median Population Age in Sedgwick?
Median Population Age in Sedgwick is 38.4 Years.
What is the Average Family Size in Sedgwick
Average Family Size in Sedgwick is 3.0 People.
What is the Average Household Size in Sedgwick
Average Household Size in Sedgwick is 2.6 People.
How Large is the Labor Force in Sedgwick?
There are 694 People in the Labor Forcein in Sedgwick.
What is the Percentage of People in the Labor Force in Sedgwick?
62.2% of People are in the Labor Force in Sedgwick.
What is the Unemployment Rate in Sedgwick?
Unemployment Rate in Sedgwick is 1.0%.