Spivey, KS Map & Demographics
Spivey Map
Spivey Overview
$14,563
PER CAPITA INCOME
$120,556
AVG FAMILY INCOME
0.37
INEQUALITY / GINI INDEX
132
TOTAL POPULATION
51
MALE POPULATION
81
FEMALE POPULATION
62.96
MALES / 100 FEMALES
158.82
FEMALES / 100 MALES
28.8
MEDIAN AGE
6.2
AVG FAMILY SIZE
4.5
AVG HOUSEHOLD SIZE
26
LABOR FORCE [ PEOPLE ]
33.3%
PERCENT IN LABOR FORCE
Spivey Zip Codes
Spivey Area Codes
Income in Spivey
Income Overview in Spivey
| Characteristic | Number | Measure |
| Per Capita Income | 132 | $14,563 |
| Median Family Income | 20 | $120,556 |
| Mean Family Income | 20 | $91,215 |
| Median Household Income | 29 | $0 |
| Mean Household Income | 29 | $69,328 |
| Income Deficit | 20 | $0 |
| Wage / Income Gap (%) | 132 | 0.00% |
| Wage / Income Gap ($) | 132 | 100.00¢ per $1 |
| Gini / Inequality Index | 132 | 0.37 |
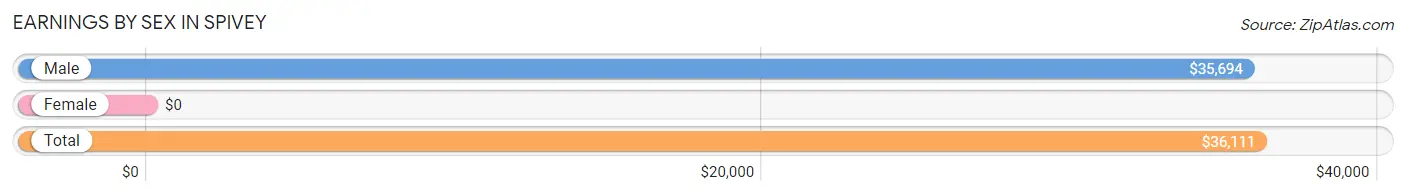
Earnings by Sex in Spivey
| Sex | Number | Average Earnings |
| Male | 21 (80.8%) | $35,694 |
| Female | 5 (19.2%) | $0 |
| Total | 26 (100.0%) | $36,111 |
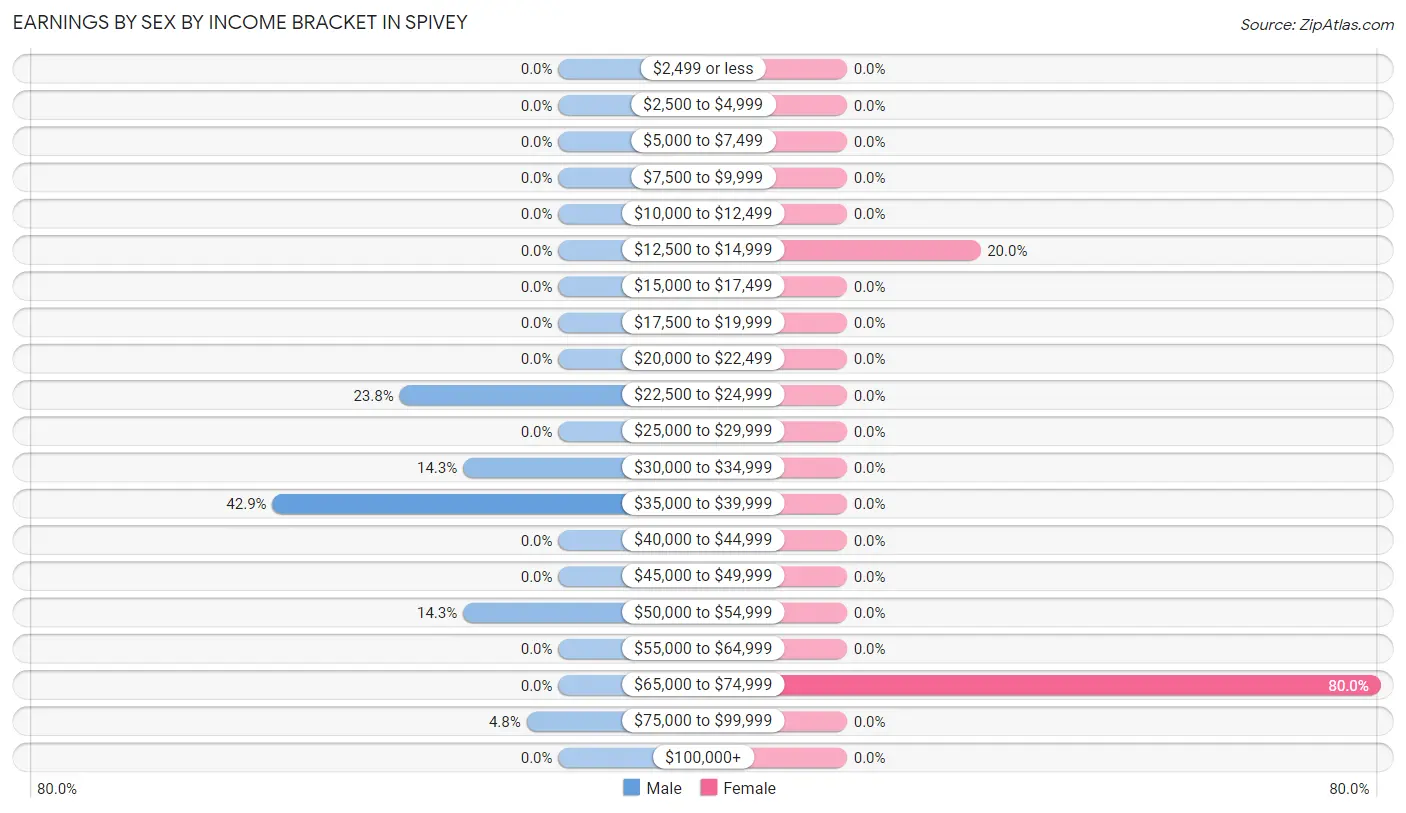
Earnings by Sex by Income Bracket in Spivey
The most common earnings brackets in Spivey are $35,000 to $39,999 for men (9 | 42.9%) and $65,000 to $74,999 for women (4 | 80.0%).
| Income | Male | Female |
| $2,499 or less | 0 (0.0%) | 0 (0.0%) |
| $2,500 to $4,999 | 0 (0.0%) | 0 (0.0%) |
| $5,000 to $7,499 | 0 (0.0%) | 0 (0.0%) |
| $7,500 to $9,999 | 0 (0.0%) | 0 (0.0%) |
| $10,000 to $12,499 | 0 (0.0%) | 0 (0.0%) |
| $12,500 to $14,999 | 0 (0.0%) | 1 (20.0%) |
| $15,000 to $17,499 | 0 (0.0%) | 0 (0.0%) |
| $17,500 to $19,999 | 0 (0.0%) | 0 (0.0%) |
| $20,000 to $22,499 | 0 (0.0%) | 0 (0.0%) |
| $22,500 to $24,999 | 5 (23.8%) | 0 (0.0%) |
| $25,000 to $29,999 | 0 (0.0%) | 0 (0.0%) |
| $30,000 to $34,999 | 3 (14.3%) | 0 (0.0%) |
| $35,000 to $39,999 | 9 (42.9%) | 0 (0.0%) |
| $40,000 to $44,999 | 0 (0.0%) | 0 (0.0%) |
| $45,000 to $49,999 | 0 (0.0%) | 0 (0.0%) |
| $50,000 to $54,999 | 3 (14.3%) | 0 (0.0%) |
| $55,000 to $64,999 | 0 (0.0%) | 0 (0.0%) |
| $65,000 to $74,999 | 0 (0.0%) | 4 (80.0%) |
| $75,000 to $99,999 | 1 (4.8%) | 0 (0.0%) |
| $100,000+ | 0 (0.0%) | 0 (0.0%) |
| Total | 21 (100.0%) | 5 (100.0%) |
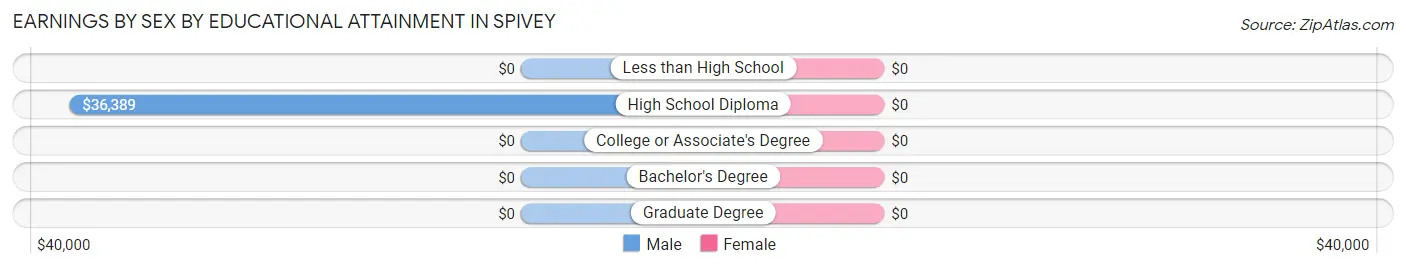
Earnings by Sex by Educational Attainment in Spivey
| Educational Attainment | Male Income | Female Income |
| Less than High School | - | - |
| High School Diploma | $36,389 | $0 |
| College or Associate's Degree | - | - |
| Bachelor's Degree | - | - |
| Graduate Degree | - | - |
| Total | $35,694 | $0 |
Family Income in Spivey
Family Income Brackets in Spivey
According to the Spivey family income data, there are 12 families falling into the $100,000 to $149,999 income range, which is the most common income bracket and makes up 60.0% of all families.
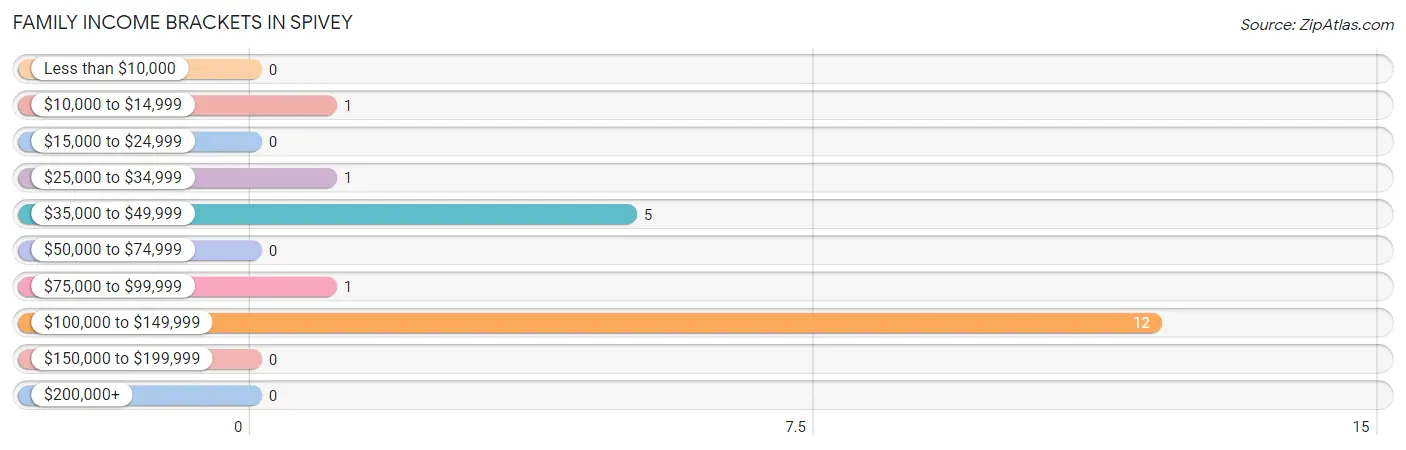
| Income Bracket | # Families | % Families |
| Less than $10,000 | 0 | 0.0% |
| $10,000 to $14,999 | 1 | 5.0% |
| $15,000 to $24,999 | 0 | 0.0% |
| $25,000 to $34,999 | 1 | 5.0% |
| $35,000 to $49,999 | 5 | 25.0% |
| $50,000 to $74,999 | 0 | 0.0% |
| $75,000 to $99,999 | 1 | 5.0% |
| $100,000 to $149,999 | 12 | 60.0% |
| $150,000 to $199,999 | 0 | 0.0% |
| $200,000+ | 0 | 0.0% |
Family Income by Famaliy Size in Spivey
2-person families (8 | 40.0%) account for the highest median family income in Spivey with $39,167 per family, while 2-person families (8 | 40.0%) have the highest median income of $19,584 per family member.
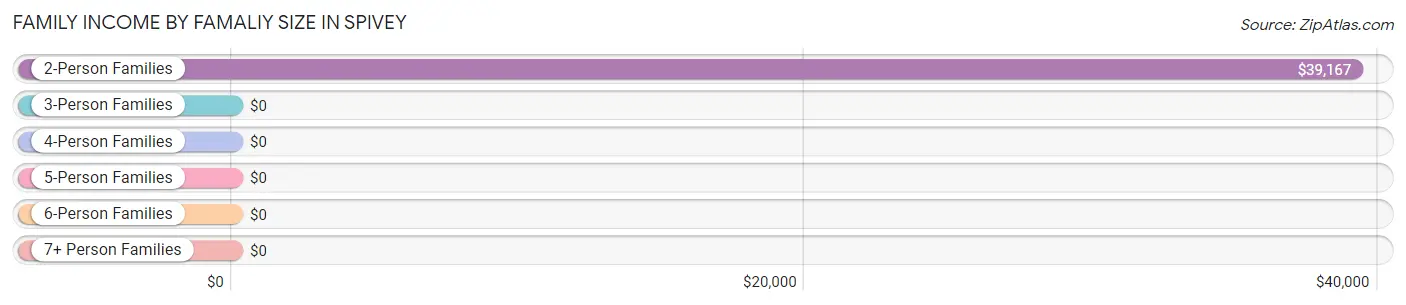
| Income Bracket | # Families | Median Income |
| 2-Person Families | 8 (40.0%) | $39,167 |
| 3-Person Families | 0 (0.0%) | $0 |
| 4-Person Families | 0 (0.0%) | $0 |
| 5-Person Families | 0 (0.0%) | $0 |
| 6-Person Families | 3 (15.0%) | $0 |
| 7+ Person Families | 9 (45.0%) | $0 |
| Total | 20 (100.0%) | $120,556 |
Family Income by Number of Earners in Spivey
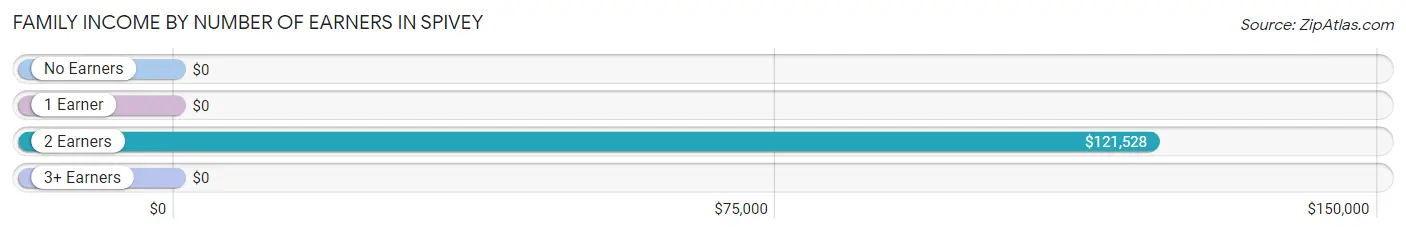
| Number of Earners | # Families | Median Income |
| No Earners | 4 (20.0%) | $0 |
| 1 Earner | 3 (15.0%) | $0 |
| 2 Earners | 13 (65.0%) | $121,528 |
| 3+ Earners | 0 (0.0%) | $0 |
| Total | 20 (100.0%) | $120,556 |
Household Income in Spivey
Household Income Brackets in Spivey
With 12 households falling in the category, the $100,000 to $149,999 income range is the most frequent in Spivey, accounting for 41.4% of all households.
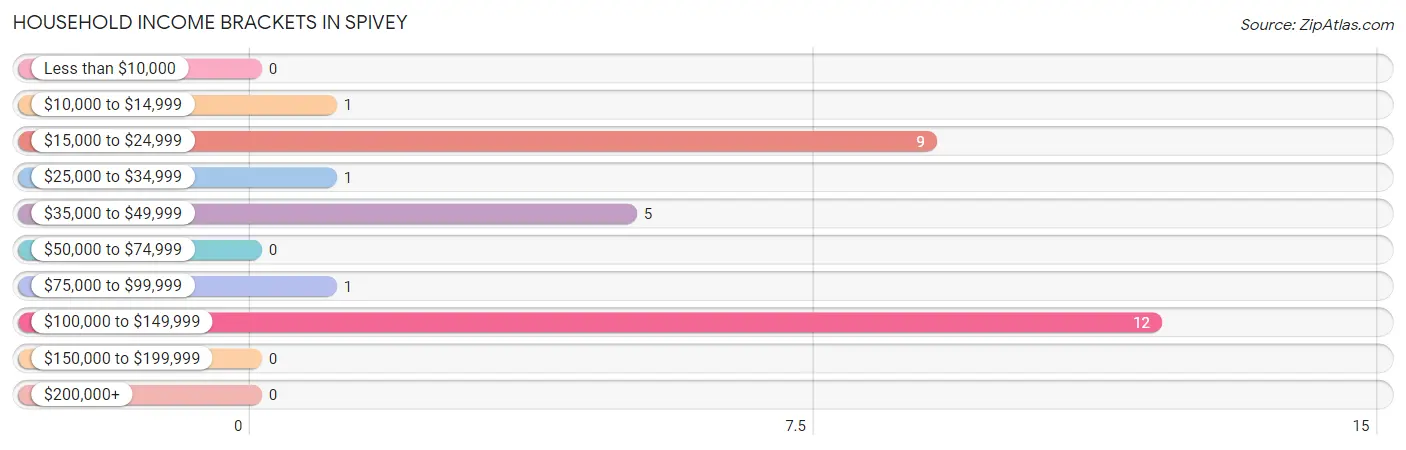
| Income Bracket | # Households | % Households |
| Less than $10,000 | 0 | 0.0% |
| $10,000 to $14,999 | 1 | 3.4% |
| $15,000 to $24,999 | 9 | 31.0% |
| $25,000 to $34,999 | 1 | 3.4% |
| $35,000 to $49,999 | 5 | 17.2% |
| $50,000 to $74,999 | 0 | 0.0% |
| $75,000 to $99,999 | 1 | 3.4% |
| $100,000 to $149,999 | 12 | 41.4% |
| $150,000 to $199,999 | 0 | 0.0% |
| $200,000+ | 0 | 0.0% |
Household Income by Householder Age in Spivey
The median household income in Spivey is $0, with the highest median household income of $21,806 found in the 65+ years age bracket for the primary householder. A total of 13 households (44.8%) fall into this category.
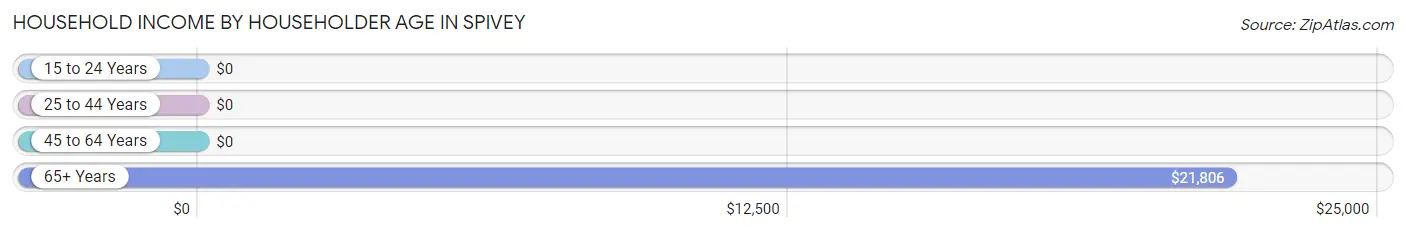
| Income Bracket | # Households | Median Income |
| 15 to 24 Years | 0 (0.0%) | $0 |
| 25 to 44 Years | 12 (41.4%) | $0 |
| 45 to 64 Years | 4 (13.8%) | $0 |
| 65+ Years | 13 (44.8%) | $21,806 |
| Total | 29 (100.0%) | $0 |
Poverty in Spivey
Income Below Poverty by Sex and Age in Spivey
With 2.0% poverty level for males and 7.4% for females among the residents of Spivey, 55 to 64 year old males and 35 to 44 year old females are the most vulnerable to poverty, with 1 males (25.0%) and 6 females (100.0%) in their respective age groups living below the poverty level.
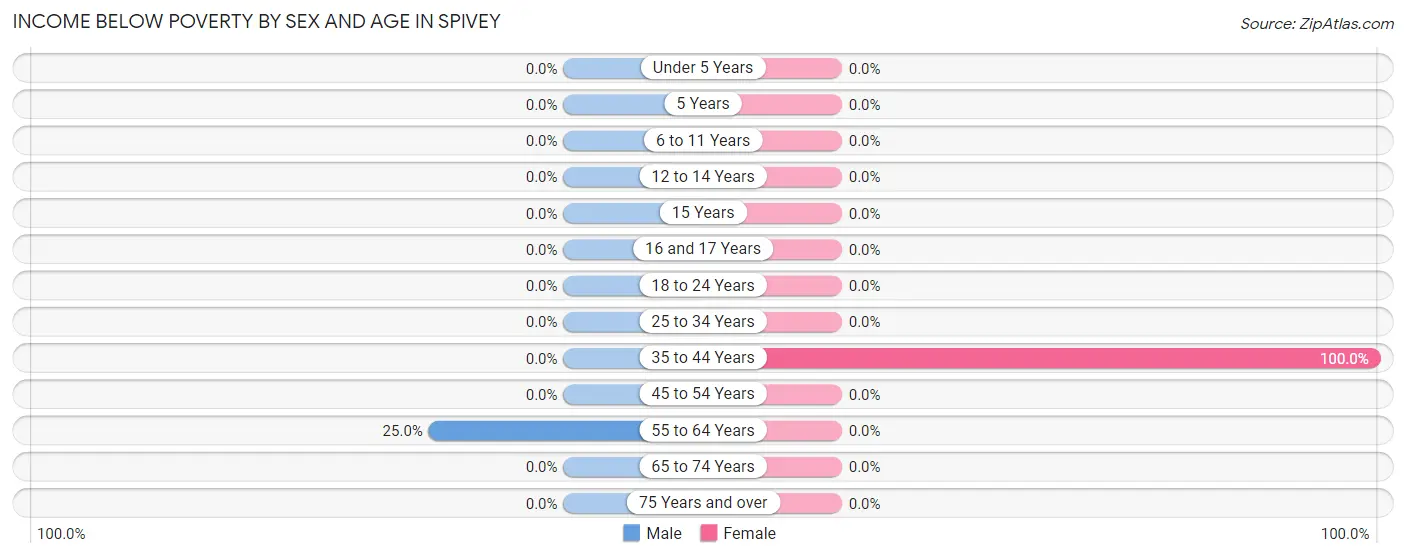
| Age Bracket | Male | Female |
| Under 5 Years | 0 (0.0%) | 0 (0.0%) |
| 5 Years | 0 (0.0%) | 0 (0.0%) |
| 6 to 11 Years | 0 (0.0%) | 0 (0.0%) |
| 12 to 14 Years | 0 (0.0%) | 0 (0.0%) |
| 15 Years | 0 (0.0%) | 0 (0.0%) |
| 16 and 17 Years | 0 (0.0%) | 0 (0.0%) |
| 18 to 24 Years | 0 (0.0%) | 0 (0.0%) |
| 25 to 34 Years | 0 (0.0%) | 0 (0.0%) |
| 35 to 44 Years | 0 (0.0%) | 6 (100.0%) |
| 45 to 54 Years | 0 (0.0%) | 0 (0.0%) |
| 55 to 64 Years | 1 (25.0%) | 0 (0.0%) |
| 65 to 74 Years | 0 (0.0%) | 0 (0.0%) |
| 75 Years and over | 0 (0.0%) | 0 (0.0%) |
| Total | 1 (2.0%) | 6 (7.4%) |
Income Above Poverty by Sex and Age in Spivey
According to the poverty statistics in Spivey, males aged under 5 years and females aged under 5 years are the age groups that are most secure financially, with 100.0% of males and 100.0% of females in these age groups living above the poverty line.
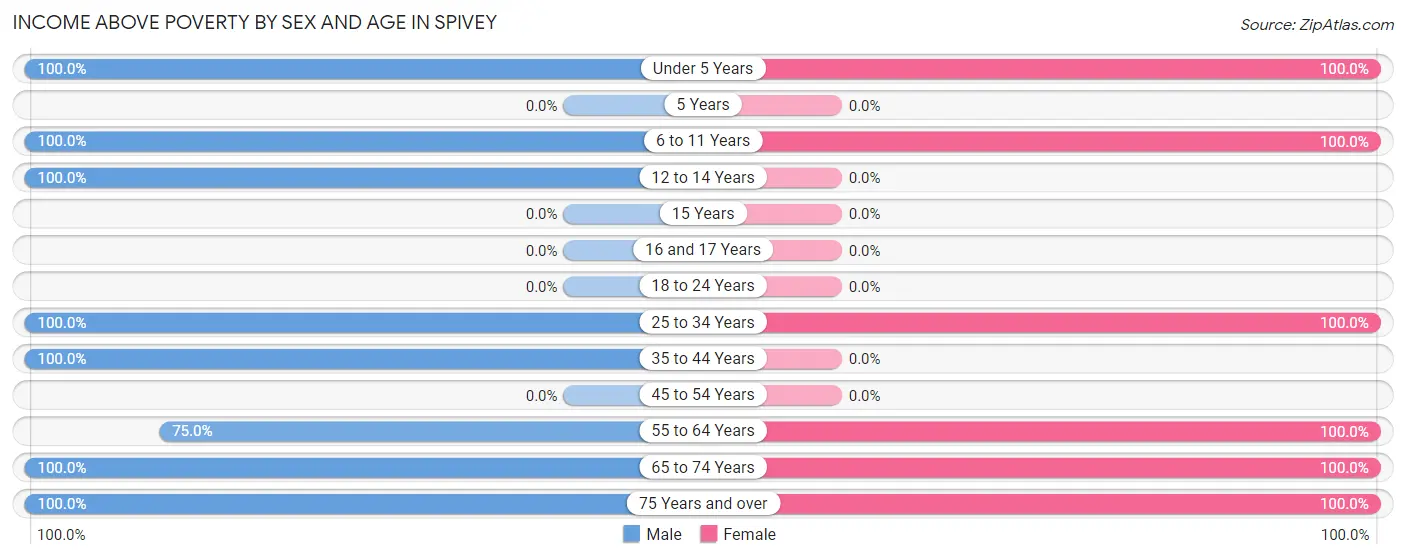
| Age Bracket | Male | Female |
| Under 5 Years | 4 (100.0%) | 22 (100.0%) |
| 5 Years | 0 (0.0%) | 0 (0.0%) |
| 6 to 11 Years | 17 (100.0%) | 7 (100.0%) |
| 12 to 14 Years | 4 (100.0%) | 0 (0.0%) |
| 15 Years | 0 (0.0%) | 0 (0.0%) |
| 16 and 17 Years | 0 (0.0%) | 0 (0.0%) |
| 18 to 24 Years | 0 (0.0%) | 0 (0.0%) |
| 25 to 34 Years | 5 (100.0%) | 19 (100.0%) |
| 35 to 44 Years | 12 (100.0%) | 0 (0.0%) |
| 45 to 54 Years | 0 (0.0%) | 0 (0.0%) |
| 55 to 64 Years | 3 (75.0%) | 16 (100.0%) |
| 65 to 74 Years | 2 (100.0%) | 2 (100.0%) |
| 75 Years and over | 3 (100.0%) | 9 (100.0%) |
| Total | 50 (98.0%) | 75 (92.6%) |
Income Below Poverty Among Married-Couple Families in Spivey
The poverty statistics for married-couple families in Spivey show that 11.1% or 1 of the total 9 families live below the poverty line. Families with no children have the highest poverty rate of 16.7%, comprising of 1 families. On the other hand, families with 3 or 4 children have the lowest poverty rate of 0.0%, which includes 0 families.
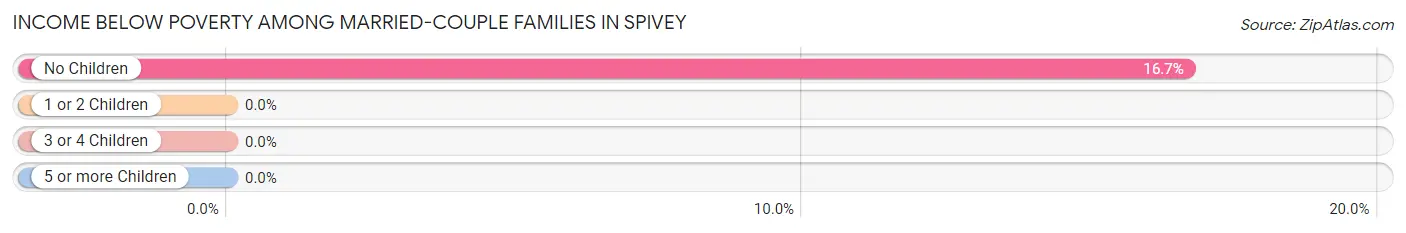
| Children | Above Poverty | Below Poverty |
| No Children | 5 (83.3%) | 1 (16.7%) |
| 1 or 2 Children | 0 (0.0%) | 0 (0.0%) |
| 3 or 4 Children | 3 (100.0%) | 0 (0.0%) |
| 5 or more Children | 0 (0.0%) | 0 (0.0%) |
| Total | 8 (88.9%) | 1 (11.1%) |
Income Below Poverty Among Single-Parent Households in Spivey
| Children | Single Father | Single Mother |
| No Children | 0 (0.0%) | 0 (0.0%) |
| 1 or 2 Children | 0 (0.0%) | 0 (0.0%) |
| 3 or 4 Children | 0 (0.0%) | 0 (0.0%) |
| 5 or more Children | 0 (0.0%) | 0 (0.0%) |
| Total | 0 (0.0%) | 0 (0.0%) |
Income Below Poverty Among Married-Couple vs Single-Parent Households in Spivey
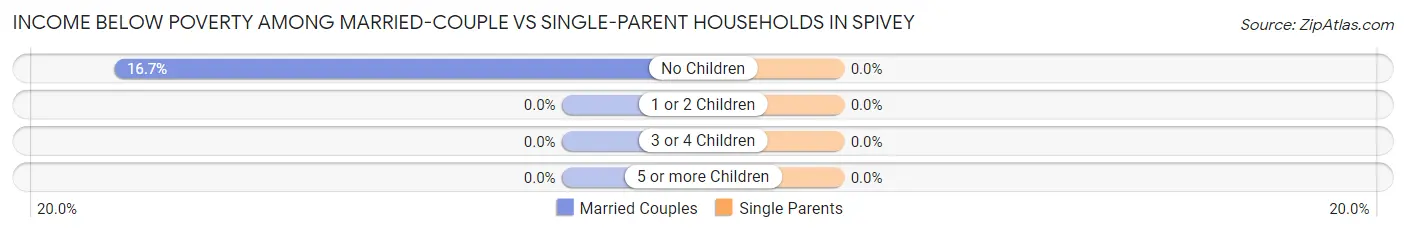
| Children | Married-Couple Families | Single-Parent Households |
| No Children | 1 (16.7%) | 0 (0.0%) |
| 1 or 2 Children | 0 (0.0%) | 0 (0.0%) |
| 3 or 4 Children | 0 (0.0%) | 0 (0.0%) |
| 5 or more Children | 0 (0.0%) | 0 (0.0%) |
| Total | 1 (11.1%) | 0 (0.0%) |
Race in Spivey
The most populous races in Spivey are White / Caucasian (127 | 96.2%), Hispanic or Latino (15 | 11.4%), and Two or more Races (4 | 3.0%).
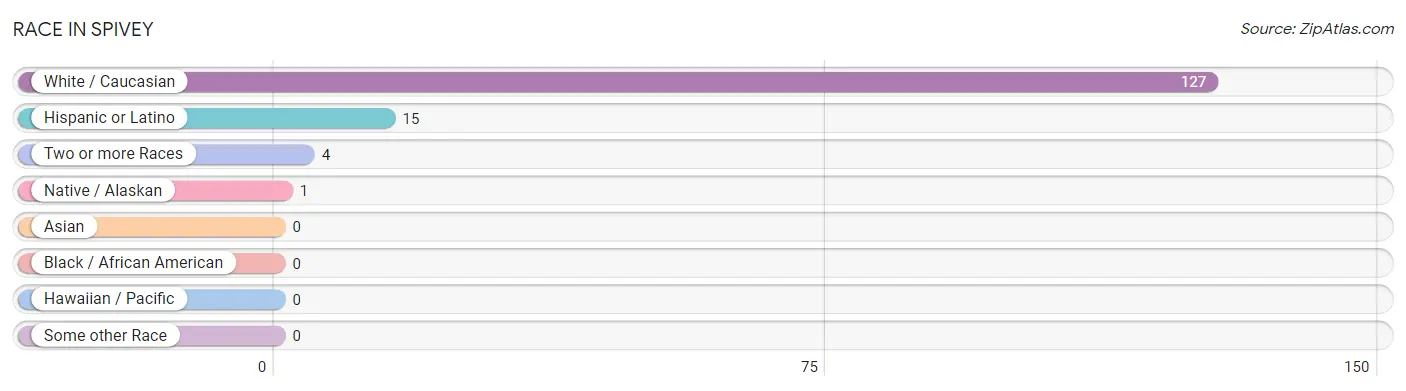
| Race | # Population | % Population |
| Asian | 0 | 0.0% |
| Black / African American | 0 | 0.0% |
| Hawaiian / Pacific | 0 | 0.0% |
| Hispanic or Latino | 15 | 11.4% |
| Native / Alaskan | 1 | 0.8% |
| White / Caucasian | 127 | 96.2% |
| Two or more Races | 4 | 3.0% |
| Some other Race | 0 | 0.0% |
| Total | 132 | 100.0% |
Ancestry in Spivey
The most populous ancestries reported in Spivey are Puerto Rican (9 | 6.8%), Mexican (6 | 4.5%), Irish (2 | 1.5%), English (1 | 0.8%), and German (1 | 0.8%), together accounting for 14.4% of all Spivey residents.
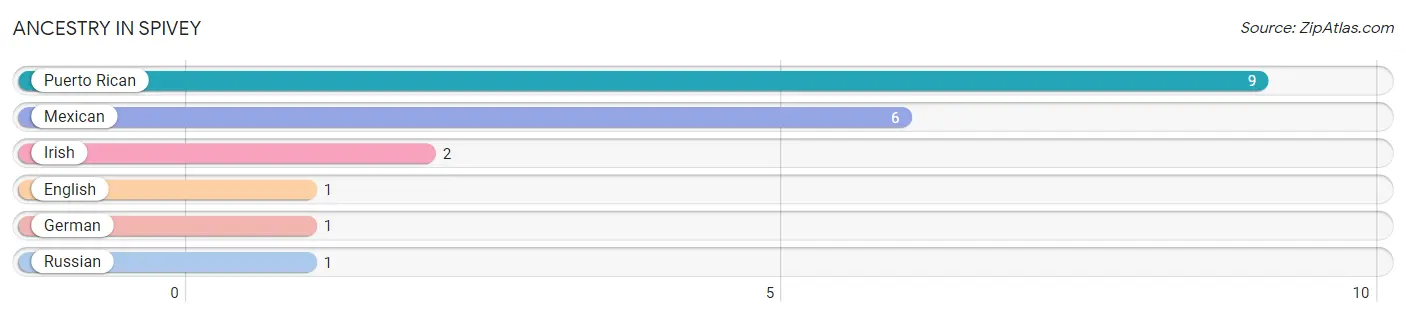
| Ancestry | # Population | % Population |
| English | 1 | 0.8% |
| German | 1 | 0.8% |
| Irish | 2 | 1.5% |
| Mexican | 6 | 4.5% |
| Puerto Rican | 9 | 6.8% |
| Russian | 1 | 0.8% | View All 6 Rows |
Immigrants in Spivey

| Immigration Origin | # Population | % Population | View All 0 Rows |
Sex and Age in Spivey
Sex and Age in Spivey
The most populous age groups in Spivey are 5 to 9 Years (17 | 33.3%) for men and Under 5 Years (22 | 27.2%) for women.
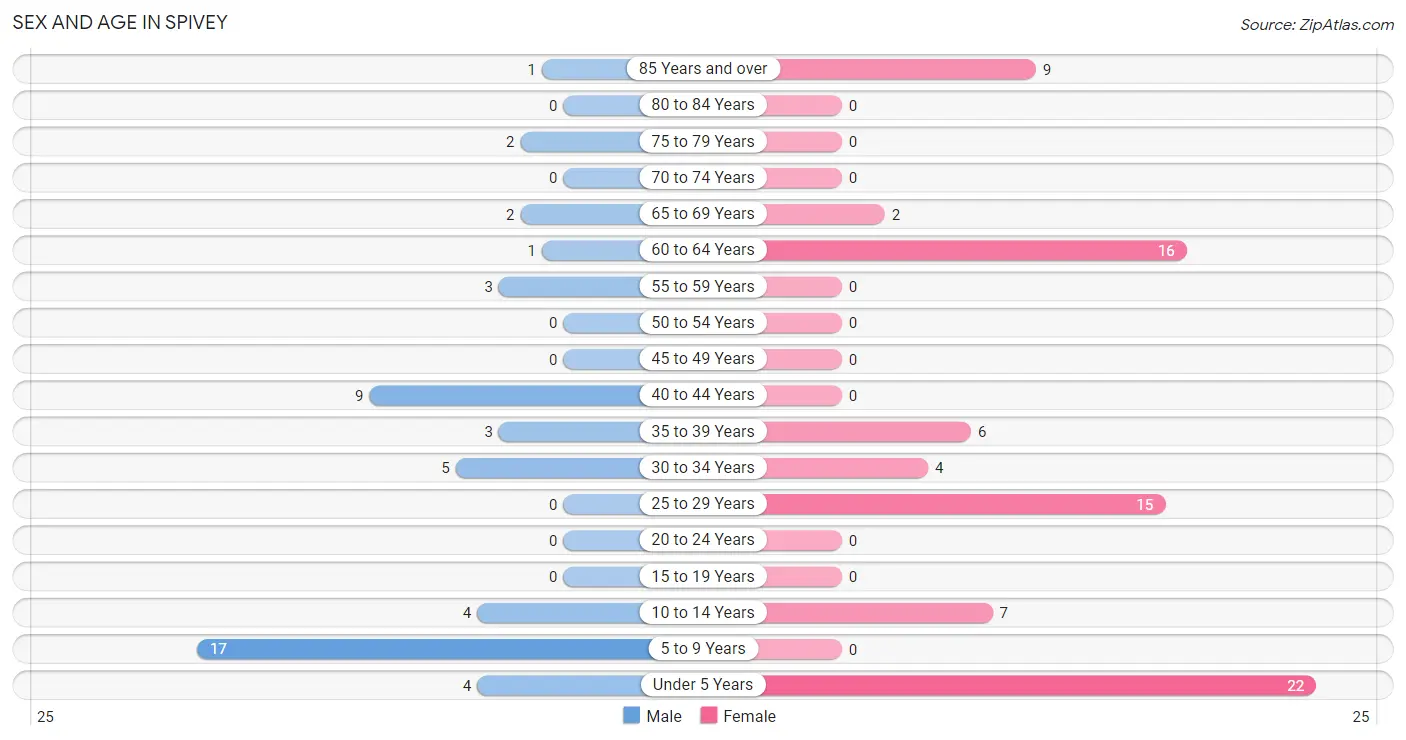
| Age Bracket | Male | Female |
| Under 5 Years | 4 (7.8%) | 22 (27.2%) |
| 5 to 9 Years | 17 (33.3%) | 0 (0.0%) |
| 10 to 14 Years | 4 (7.8%) | 7 (8.6%) |
| 15 to 19 Years | 0 (0.0%) | 0 (0.0%) |
| 20 to 24 Years | 0 (0.0%) | 0 (0.0%) |
| 25 to 29 Years | 0 (0.0%) | 15 (18.5%) |
| 30 to 34 Years | 5 (9.8%) | 4 (4.9%) |
| 35 to 39 Years | 3 (5.9%) | 6 (7.4%) |
| 40 to 44 Years | 9 (17.6%) | 0 (0.0%) |
| 45 to 49 Years | 0 (0.0%) | 0 (0.0%) |
| 50 to 54 Years | 0 (0.0%) | 0 (0.0%) |
| 55 to 59 Years | 3 (5.9%) | 0 (0.0%) |
| 60 to 64 Years | 1 (2.0%) | 16 (19.8%) |
| 65 to 69 Years | 2 (3.9%) | 2 (2.5%) |
| 70 to 74 Years | 0 (0.0%) | 0 (0.0%) |
| 75 to 79 Years | 2 (3.9%) | 0 (0.0%) |
| 80 to 84 Years | 0 (0.0%) | 0 (0.0%) |
| 85 Years and over | 1 (2.0%) | 9 (11.1%) |
| Total | 51 (100.0%) | 81 (100.0%) |
Families and Households in Spivey
Median Family Size in Spivey
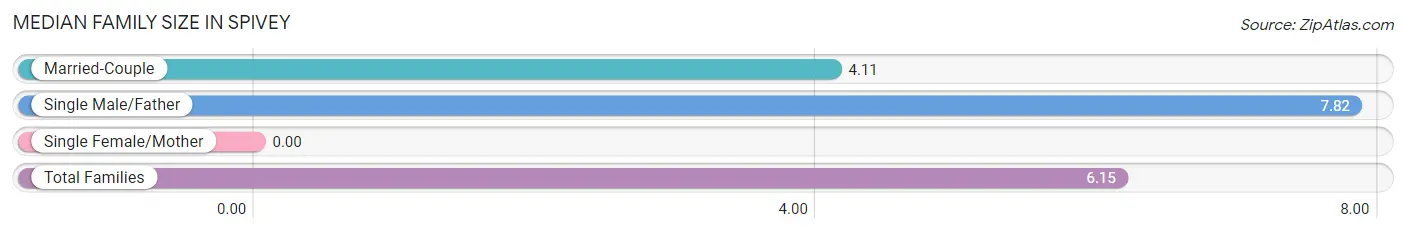
| Family Type | # Families | Family Size |
| Married-Couple | 9 (45.0%) | 4.11 |
| Single Male/Father | 11 (55.0%) | 7.82 |
| Single Female/Mother | 0 (0.0%) | - |
| Total Families | 20 (100.0%) | 6.15 |
Median Household Size in Spivey
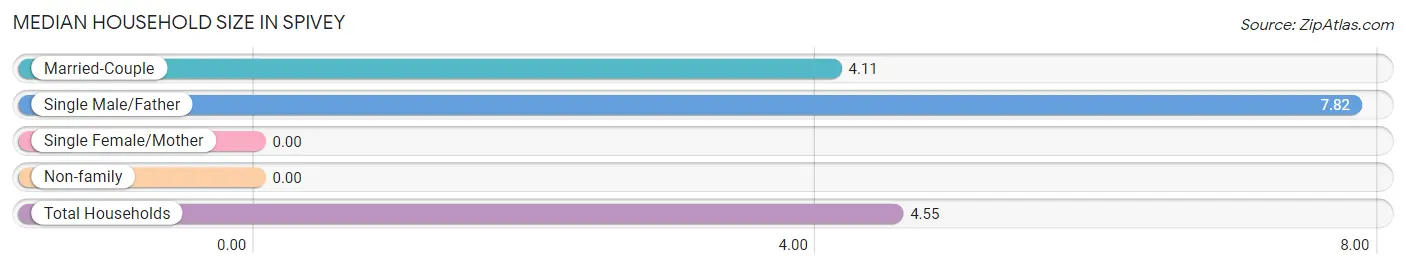
| Household Type | # Households | Household Size |
| Married-Couple | 9 (31.0%) | 4.11 |
| Single Male/Father | 11 (37.9%) | 7.82 |
| Single Female/Mother | 0 (0.0%) | - |
| Non-family | 9 (31.0%) | - |
| Total Households | 29 (100.0%) | 4.55 |
Household Size by Marriage Status in Spivey
Out of a total of 29 households in Spivey, 20 (69.0%) are family households, while 9 (31.0%) are nonfamily households. The most numerous type of family households are 7+ person households, comprising 9, and the most common type of nonfamily households are 1-person households, comprising 9.
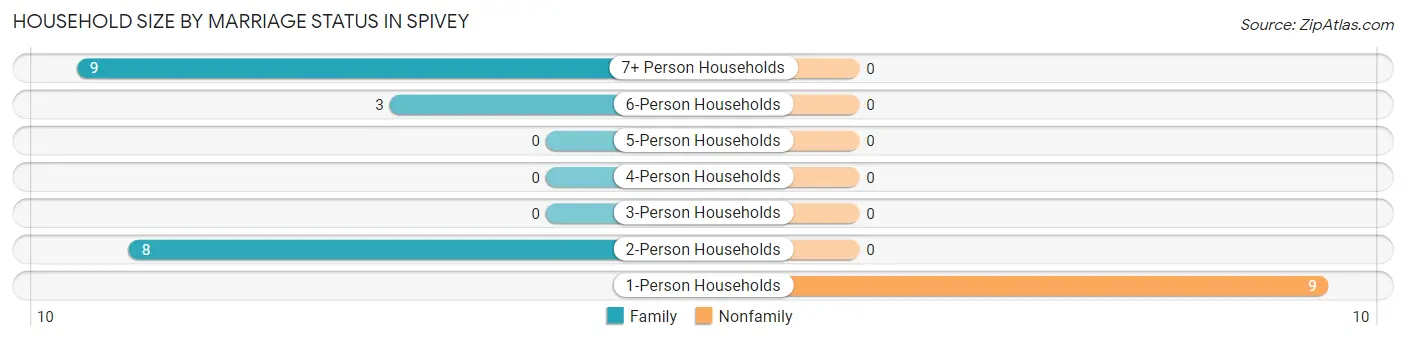
| Household Size | Family Households | Nonfamily Households |
| 1-Person Households | - | 9 (31.0%) |
| 2-Person Households | 8 (27.6%) | 0 (0.0%) |
| 3-Person Households | 0 (0.0%) | 0 (0.0%) |
| 4-Person Households | 0 (0.0%) | 0 (0.0%) |
| 5-Person Households | 0 (0.0%) | 0 (0.0%) |
| 6-Person Households | 3 (10.3%) | 0 (0.0%) |
| 7+ Person Households | 9 (31.0%) | 0 (0.0%) |
| Total | 20 (69.0%) | 9 (31.0%) |
Female Fertility in Spivey
Fertility by Age in Spivey
| Age Bracket | Women with Births | Births / 1,000 Women |
| 15 to 19 years | 0 (0.0%) | 0.0 |
| 20 to 34 years | 0 (0.0%) | 0.0 |
| 35 to 50 years | 0 (0.0%) | 0.0 |
| Total | 0 (0.0%) | 0.0 |
Fertility by Age by Marriage Status in Spivey
| Age Bracket | Married | Unmarried |
| 15 to 19 years | 0 (0.0%) | 0 (0.0%) |
| 20 to 34 years | 0 (0.0%) | 0 (0.0%) |
| 35 to 50 years | 0 (0.0%) | 0 (0.0%) |
| Total | 0 (0.0%) | 0 (0.0%) |
Fertility by Education in Spivey
| Educational Attainment | Women with Births | Births / 1,000 Women |
| Less than High School | 0 (0.0%) | 0.0 |
| High School Diploma | 0 (0.0%) | 0.0 |
| College or Associate's Degree | 0 (0.0%) | 0.0 |
| Bachelor's Degree | 0 (0.0%) | 0.0 |
| Graduate Degree | 0 (0.0%) | 0.0 |
| Total | 0 (0.0%) | 0.0 |
Fertility by Education by Marriage Status in Spivey
| Educational Attainment | Married | Unmarried |
| Less than High School | 0 (0.0%) | 0 (0.0%) |
| High School Diploma | 0 (0.0%) | 0 (0.0%) |
| College or Associate's Degree | 0 (0.0%) | 0 (0.0%) |
| Bachelor's Degree | 0 (0.0%) | 0 (0.0%) |
| Graduate Degree | 0 (0.0%) | 0 (0.0%) |
| Total | 0 (0.0%) | 0 (0.0%) |
Employment Characteristics in Spivey
Employment by Class of Employer in Spivey
Among the 26 employed individuals in Spivey, private company employees (22 | 84.6%), and not-for-profit organizations (4 | 15.4%) make up the most common classes of employment.
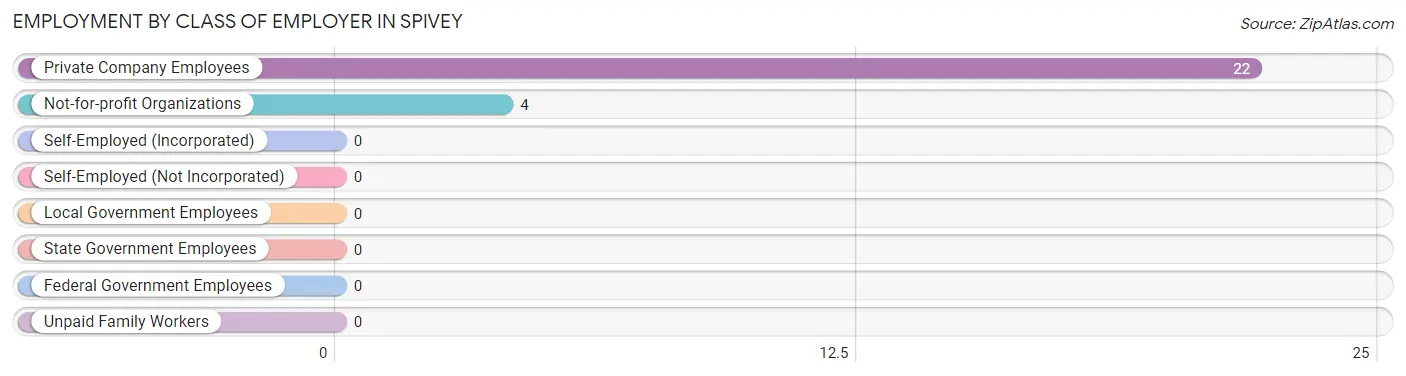
| Employer Class | # Employees | % Employees |
| Private Company Employees | 22 | 84.6% |
| Self-Employed (Incorporated) | 0 | 0.0% |
| Self-Employed (Not Incorporated) | 0 | 0.0% |
| Not-for-profit Organizations | 4 | 15.4% |
| Local Government Employees | 0 | 0.0% |
| State Government Employees | 0 | 0.0% |
| Federal Government Employees | 0 | 0.0% |
| Unpaid Family Workers | 0 | 0.0% |
| Total | 26 | 100.0% |
Employment Status by Age in Spivey
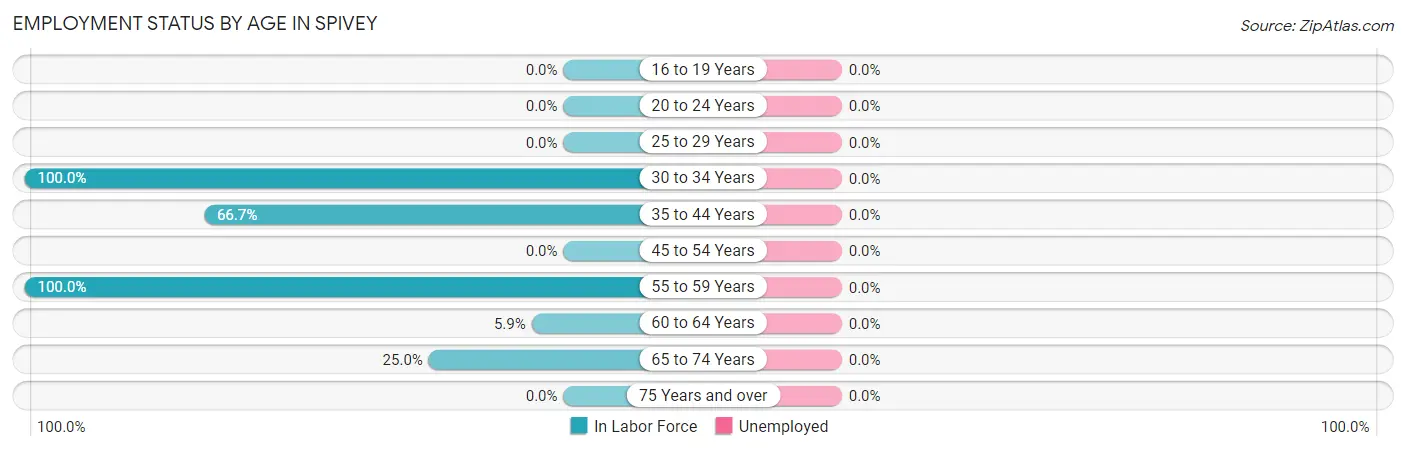
| Age Bracket | In Labor Force | Unemployed |
| 16 to 19 Years | 0 (0.0%) | 0 (0.0%) |
| 20 to 24 Years | 0 (0.0%) | 0 (0.0%) |
| 25 to 29 Years | 0 (0.0%) | 0 (0.0%) |
| 30 to 34 Years | 9 (100.0%) | 0 (0.0%) |
| 35 to 44 Years | 12 (66.7%) | 0 (0.0%) |
| 45 to 54 Years | 0 (0.0%) | 0 (0.0%) |
| 55 to 59 Years | 3 (100.0%) | 0 (0.0%) |
| 60 to 64 Years | 1 (5.9%) | 0 (0.0%) |
| 65 to 74 Years | 1 (25.0%) | 0 (0.0%) |
| 75 Years and over | 0 (0.0%) | 0 (0.0%) |
| Total | 26 (33.3%) | 0 (0.0%) |
Employment Status by Educational Attainment in Spivey
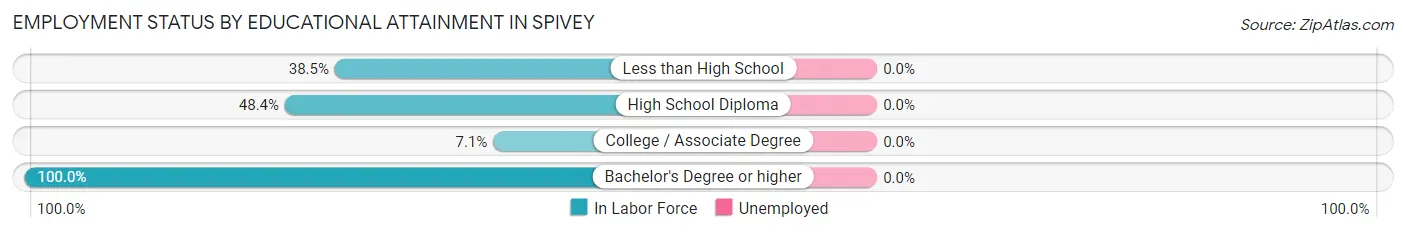
| Educational Attainment | In Labor Force | Unemployed |
| Less than High School | 5 (38.5%) | 0 (0.0%) |
| High School Diploma | 15 (48.4%) | 0 (0.0%) |
| College / Associate Degree | 1 (7.1%) | 0 (0.0%) |
| Bachelor's Degree or higher | 4 (100.0%) | 0 (0.0%) |
| Total | 25 (40.3%) | 0 (0.0%) |
Employment Occupations by Sex in Spivey
Management, Business, Science and Arts Occupations
The most common Management, Business, Science and Arts occupations in Spivey are , and Health Diagnosing & Treating (4 | 15.4%).
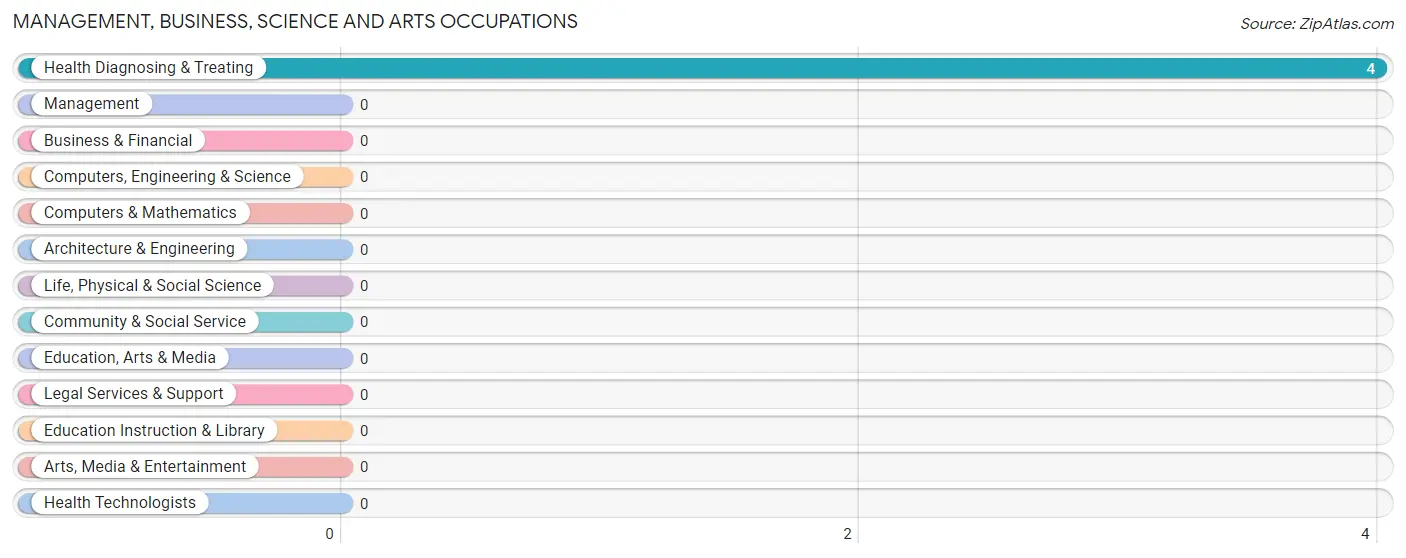
Management, Business, Science and Arts Occupations by Sex
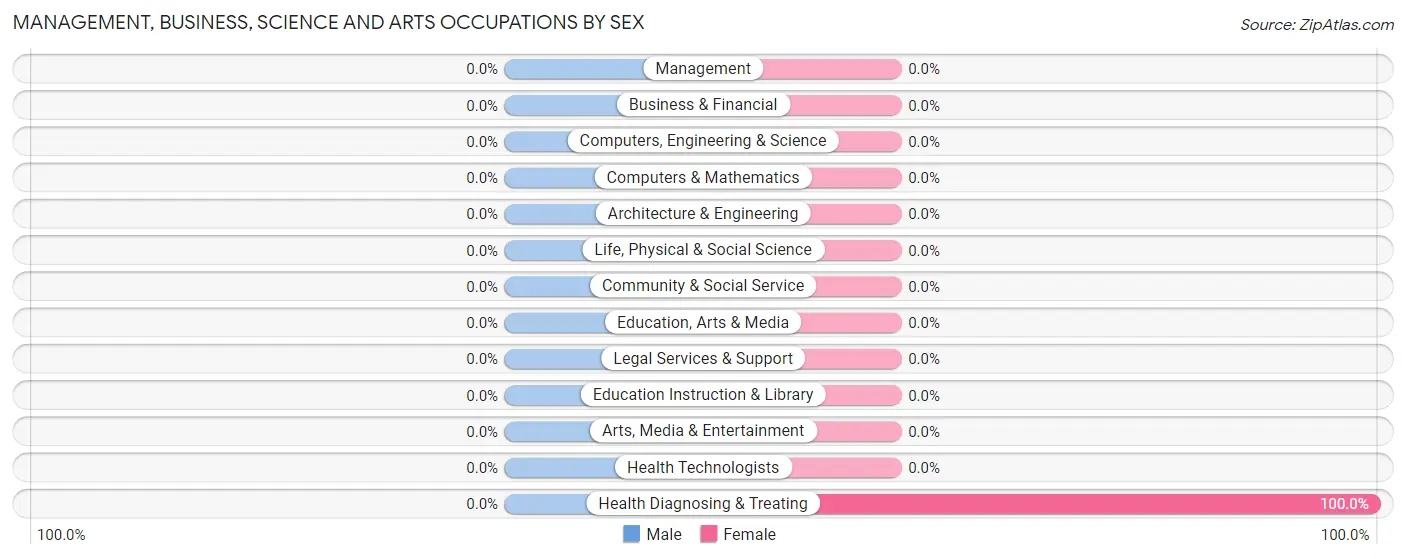
| Occupation | Male | Female |
| Management | 0 (0.0%) | 0 (0.0%) |
| Business & Financial | 0 (0.0%) | 0 (0.0%) |
| Computers, Engineering & Science | 0 (0.0%) | 0 (0.0%) |
| Computers & Mathematics | 0 (0.0%) | 0 (0.0%) |
| Architecture & Engineering | 0 (0.0%) | 0 (0.0%) |
| Life, Physical & Social Science | 0 (0.0%) | 0 (0.0%) |
| Community & Social Service | 0 (0.0%) | 0 (0.0%) |
| Education, Arts & Media | 0 (0.0%) | 0 (0.0%) |
| Legal Services & Support | 0 (0.0%) | 0 (0.0%) |
| Education Instruction & Library | 0 (0.0%) | 0 (0.0%) |
| Arts, Media & Entertainment | 0 (0.0%) | 0 (0.0%) |
| Health Diagnosing & Treating | 0 (0.0%) | 4 (100.0%) |
| Health Technologists | 0 (0.0%) | 0 (0.0%) |
| Total (Category) | 0 (0.0%) | 4 (100.0%) |
| Total (Overall) | 21 (80.8%) | 5 (19.2%) |
Services Occupations
The most common Services occupations in Spivey are , and Food Preparation & Serving (1 | 3.8%).
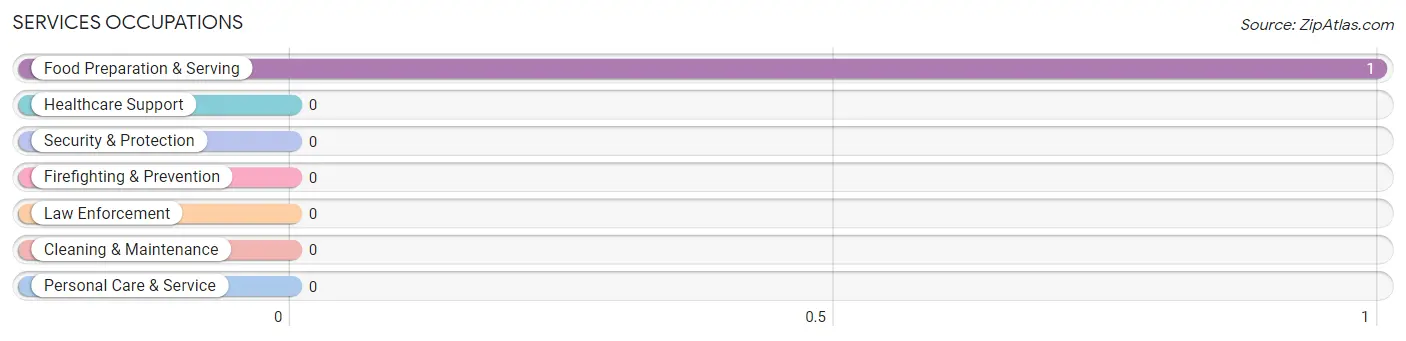
Services Occupations by Sex
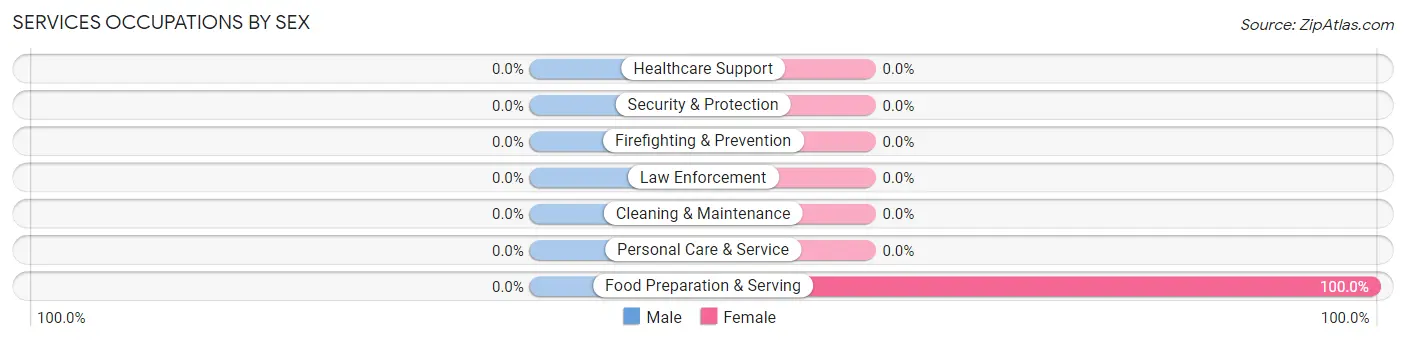
| Occupation | Male | Female |
| Healthcare Support | 0 (0.0%) | 0 (0.0%) |
| Security & Protection | 0 (0.0%) | 0 (0.0%) |
| Firefighting & Prevention | 0 (0.0%) | 0 (0.0%) |
| Law Enforcement | 0 (0.0%) | 0 (0.0%) |
| Food Preparation & Serving | 0 (0.0%) | 1 (100.0%) |
| Cleaning & Maintenance | 0 (0.0%) | 0 (0.0%) |
| Personal Care & Service | 0 (0.0%) | 0 (0.0%) |
| Total (Category) | 0 (0.0%) | 1 (100.0%) |
| Total (Overall) | 21 (80.8%) | 5 (19.2%) |
Sales and Office Occupations
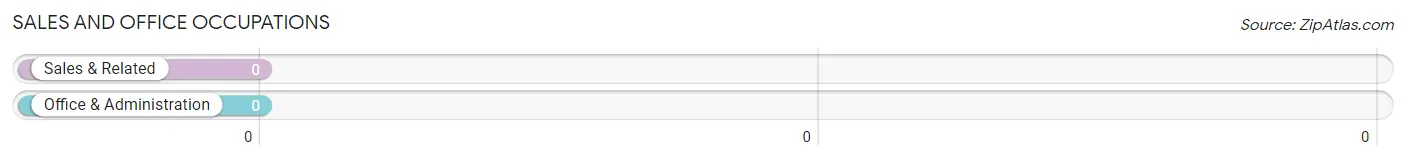
Sales and Office Occupations by Sex
| Occupation | Male | Female |
| Sales & Related | 0 (0.0%) | 0 (0.0%) |
| Office & Administration | 0 (0.0%) | 0 (0.0%) |
| Total (Category) | 0 (0.0%) | 0 (0.0%) |
| Total (Overall) | 21 (80.8%) | 5 (19.2%) |
Natural Resources, Construction and Maintenance Occupations
Natural Resources, Construction and Maintenance Occupations by Sex
| Occupation | Male | Female |
| Farming, Fishing & Forestry | 0 (0.0%) | 0 (0.0%) |
| Construction & Extraction | 0 (0.0%) | 0 (0.0%) |
| Installation, Maintenance & Repair | 0 (0.0%) | 0 (0.0%) |
| Total (Category) | 0 (0.0%) | 0 (0.0%) |
| Total (Overall) | 21 (80.8%) | 5 (19.2%) |
Production, Transportation and Moving Occupations
The most common Production, Transportation and Moving occupations in Spivey are Material Moving (17 | 65.4%), and Transportation (4 | 15.4%).
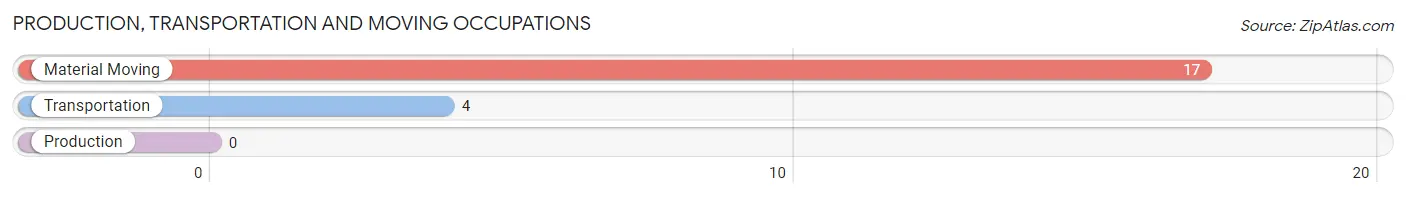
Production, Transportation and Moving Occupations by Sex
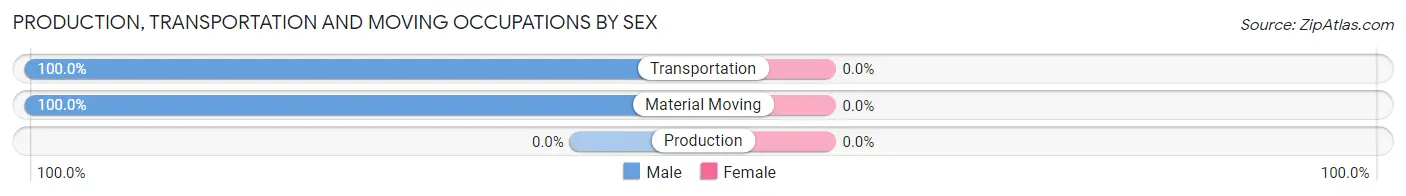
| Occupation | Male | Female |
| Production | 0 (0.0%) | 0 (0.0%) |
| Transportation | 4 (100.0%) | 0 (0.0%) |
| Material Moving | 17 (100.0%) | 0 (0.0%) |
| Total (Category) | 21 (100.0%) | 0 (0.0%) |
| Total (Overall) | 21 (80.8%) | 5 (19.2%) |
Employment Industries by Sex in Spivey
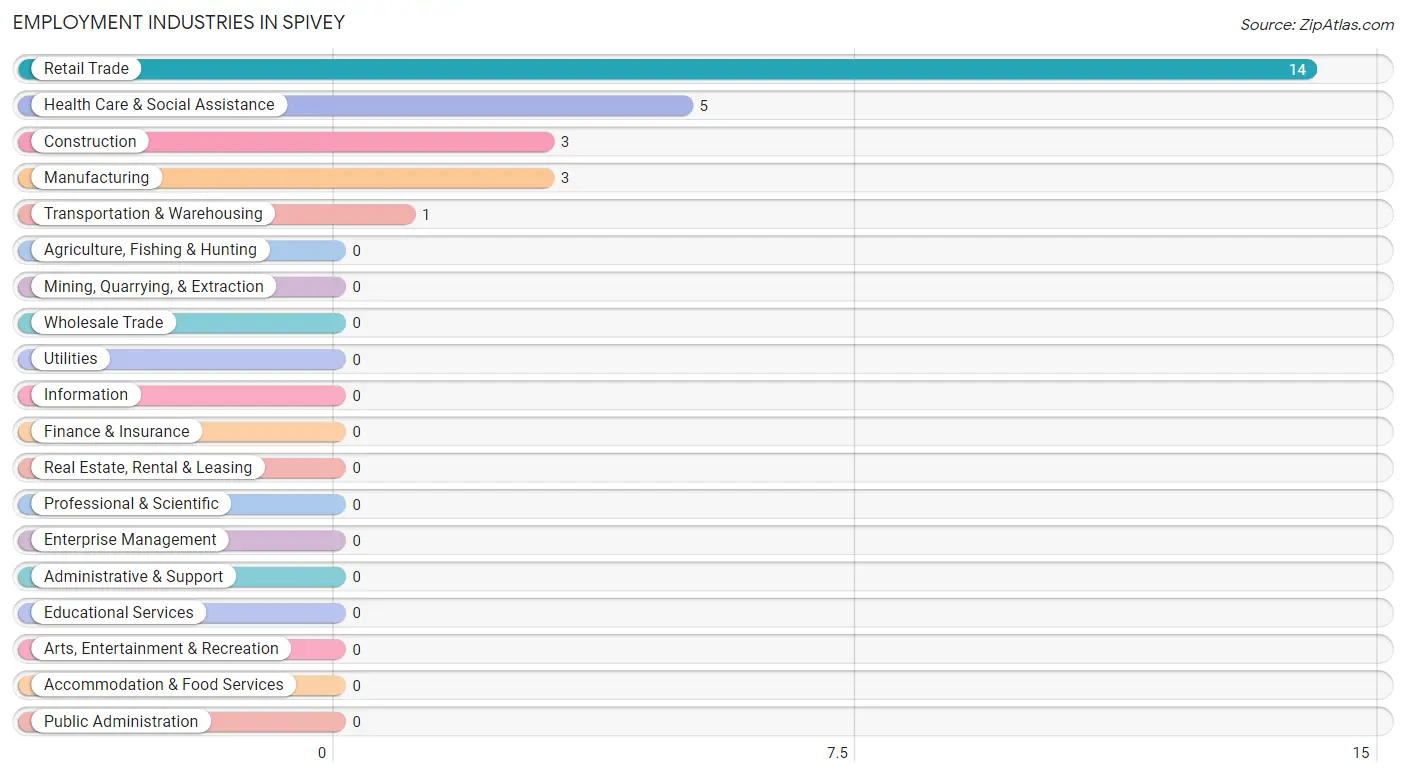
Employment Industries in Spivey
The major employment industries in Spivey include Retail Trade (14 | 53.8%), Health Care & Social Assistance (5 | 19.2%), Construction (3 | 11.5%), Manufacturing (3 | 11.5%), and Transportation & Warehousing (1 | 3.8%).
Employment Industries by Sex in Spivey
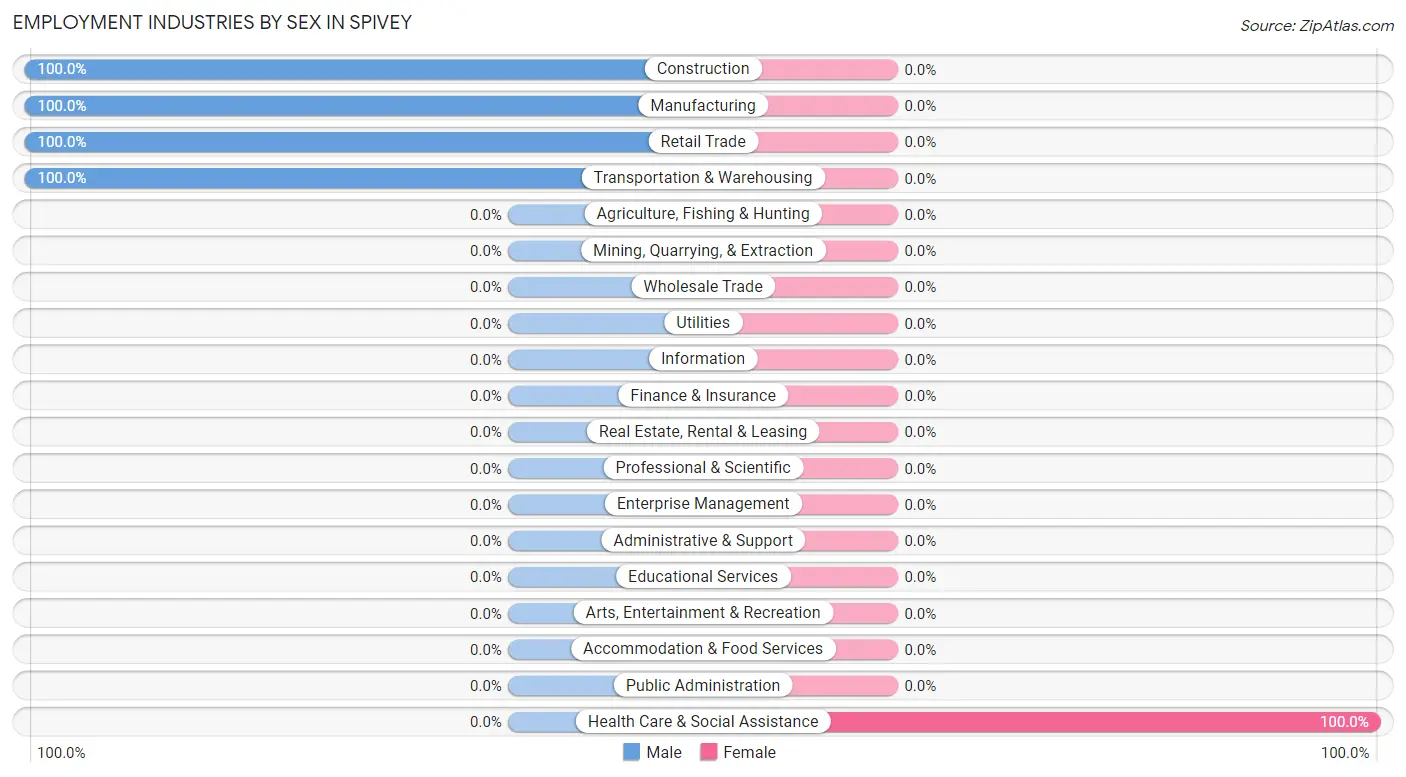
| Industry | Male | Female |
| Agriculture, Fishing & Hunting | 0 (0.0%) | 0 (0.0%) |
| Mining, Quarrying, & Extraction | 0 (0.0%) | 0 (0.0%) |
| Construction | 3 (100.0%) | 0 (0.0%) |
| Manufacturing | 3 (100.0%) | 0 (0.0%) |
| Wholesale Trade | 0 (0.0%) | 0 (0.0%) |
| Retail Trade | 14 (100.0%) | 0 (0.0%) |
| Transportation & Warehousing | 1 (100.0%) | 0 (0.0%) |
| Utilities | 0 (0.0%) | 0 (0.0%) |
| Information | 0 (0.0%) | 0 (0.0%) |
| Finance & Insurance | 0 (0.0%) | 0 (0.0%) |
| Real Estate, Rental & Leasing | 0 (0.0%) | 0 (0.0%) |
| Professional & Scientific | 0 (0.0%) | 0 (0.0%) |
| Enterprise Management | 0 (0.0%) | 0 (0.0%) |
| Administrative & Support | 0 (0.0%) | 0 (0.0%) |
| Educational Services | 0 (0.0%) | 0 (0.0%) |
| Health Care & Social Assistance | 0 (0.0%) | 5 (100.0%) |
| Arts, Entertainment & Recreation | 0 (0.0%) | 0 (0.0%) |
| Accommodation & Food Services | 0 (0.0%) | 0 (0.0%) |
| Public Administration | 0 (0.0%) | 0 (0.0%) |
| Total | 21 (80.8%) | 5 (19.2%) |
Education in Spivey
School Enrollment in Spivey
The most common levels of schooling among the 28 students in Spivey are kindergarten (17 | 60.7%), and middle school (11 | 39.3%).
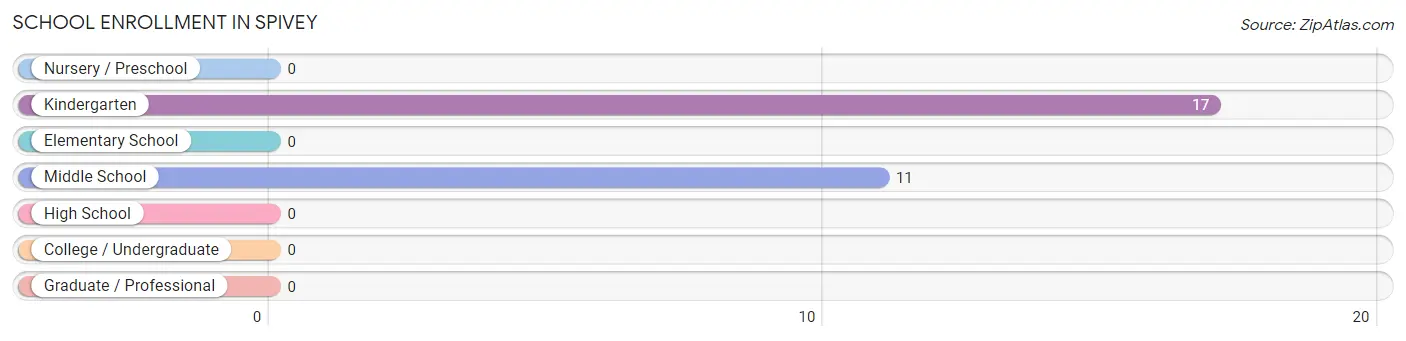
| School Level | # Students | % Students |
| Nursery / Preschool | 0 | 0.0% |
| Kindergarten | 17 | 60.7% |
| Elementary School | 0 | 0.0% |
| Middle School | 11 | 39.3% |
| High School | 0 | 0.0% |
| College / Undergraduate | 0 | 0.0% |
| Graduate / Professional | 0 | 0.0% |
| Total | 28 | 100.0% |
School Enrollment by Age by Funding Source in Spivey
Out of a total of 28 students who are enrolled in schools in Spivey, 17 (60.7%) attend a private institution, while the remaining 11 (39.3%) are enrolled in public schools. The age group of 5 to 9 year old has the highest likelihood of being enrolled in private schools, with 17 (100.0% in the age bracket) enrolled. Conversely, the age group of 10 to 14 year olds has the lowest likelihood of being enrolled in a private school, with 11 (100.0% in the age bracket) attending a public institution.
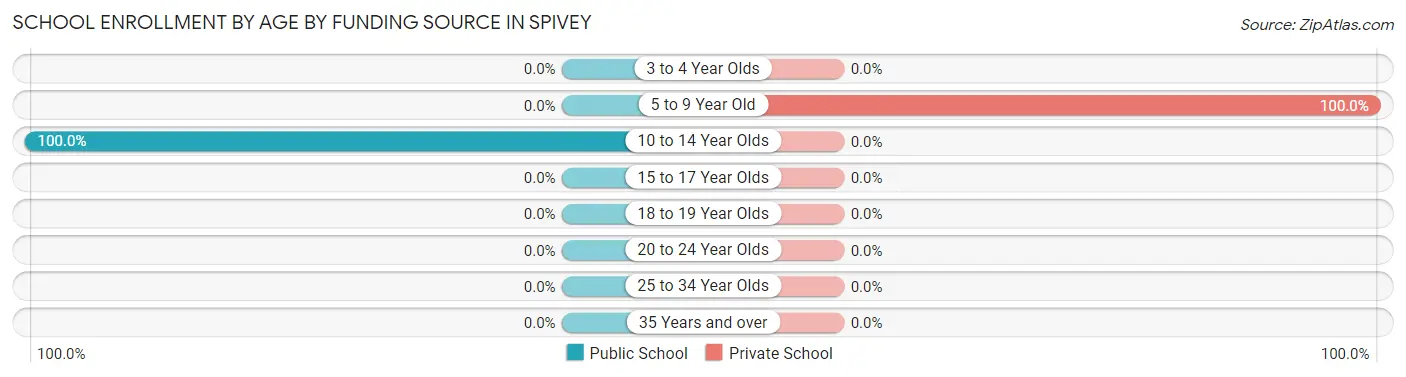
| Age Bracket | Public School | Private School |
| 3 to 4 Year Olds | 0 (0.0%) | 0 (0.0%) |
| 5 to 9 Year Old | 0 (0.0%) | 17 (100.0%) |
| 10 to 14 Year Olds | 11 (100.0%) | 0 (0.0%) |
| 15 to 17 Year Olds | 0 (0.0%) | 0 (0.0%) |
| 18 to 19 Year Olds | 0 (0.0%) | 0 (0.0%) |
| 20 to 24 Year Olds | 0 (0.0%) | 0 (0.0%) |
| 25 to 34 Year Olds | 0 (0.0%) | 0 (0.0%) |
| 35 Years and over | 0 (0.0%) | 0 (0.0%) |
| Total | 11 (39.3%) | 17 (60.7%) |
Educational Attainment by Field of Study in Spivey
Arts & humanities (4 | 80.0%), and education (1 | 20.0%) are the most common fields of study among 5 individuals in Spivey who have obtained a bachelor's degree or higher.
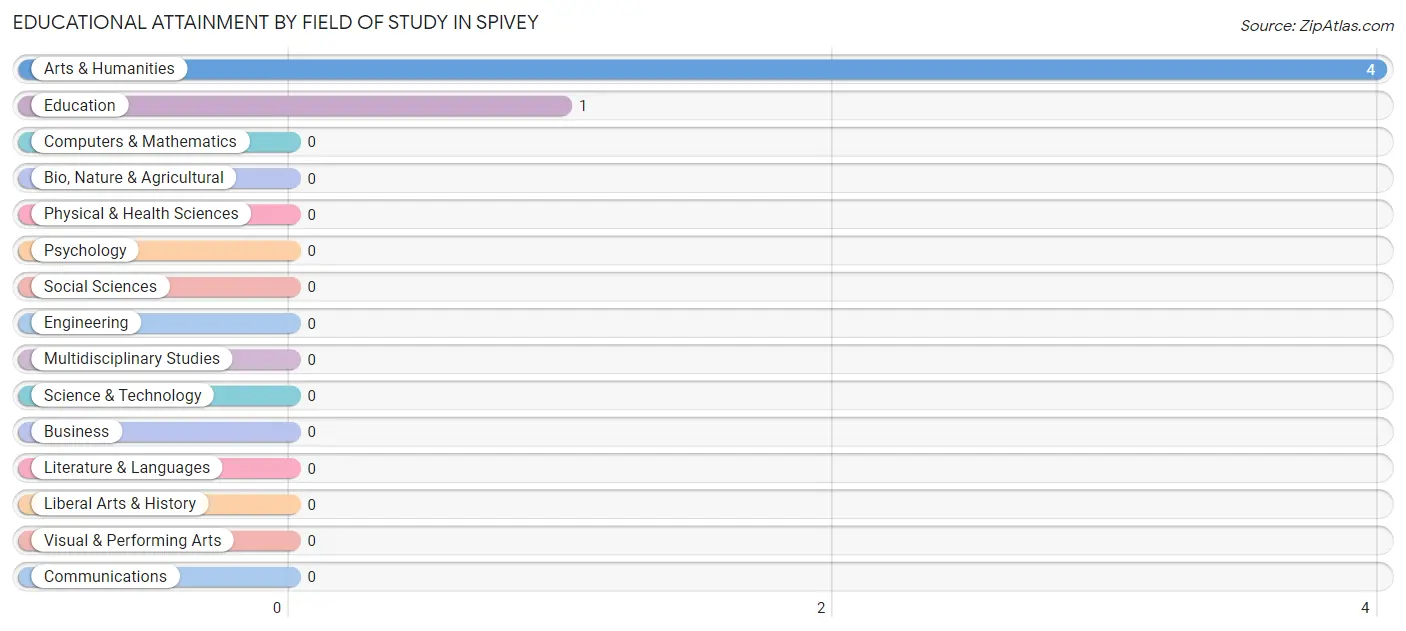
| Field of Study | # Graduates | % Graduates |
| Computers & Mathematics | 0 | 0.0% |
| Bio, Nature & Agricultural | 0 | 0.0% |
| Physical & Health Sciences | 0 | 0.0% |
| Psychology | 0 | 0.0% |
| Social Sciences | 0 | 0.0% |
| Engineering | 0 | 0.0% |
| Multidisciplinary Studies | 0 | 0.0% |
| Science & Technology | 0 | 0.0% |
| Business | 0 | 0.0% |
| Education | 1 | 20.0% |
| Literature & Languages | 0 | 0.0% |
| Liberal Arts & History | 0 | 0.0% |
| Visual & Performing Arts | 0 | 0.0% |
| Communications | 0 | 0.0% |
| Arts & Humanities | 4 | 80.0% |
| Total | 5 | 100.0% |
Transportation & Commute in Spivey
Vehicle Availability by Sex in Spivey
The most prevalent vehicle ownership categories in Spivey are males with 2 vehicles (18, accounting for 85.7%) and females with 2 vehicles (1, making up 360.0%).
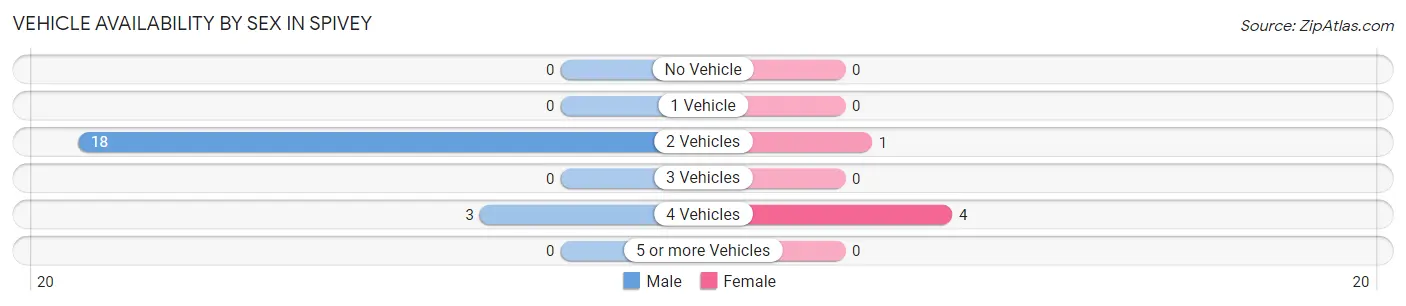
| Vehicles Available | Male | Female |
| No Vehicle | 0 (0.0%) | 0 (0.0%) |
| 1 Vehicle | 0 (0.0%) | 0 (0.0%) |
| 2 Vehicles | 18 (85.7%) | 1 (20.0%) |
| 3 Vehicles | 0 (0.0%) | 0 (0.0%) |
| 4 Vehicles | 3 (14.3%) | 4 (80.0%) |
| 5 or more Vehicles | 0 (0.0%) | 0 (0.0%) |
| Total | 21 (100.0%) | 5 (100.0%) |
Commute Time in Spivey
The most frequently occuring commute durations in Spivey are 60 to 89 minutes (14 commuters, 53.8%), 10 to 14 minutes (4 commuters, 15.4%), and 15 to 19 minutes (3 commuters, 11.5%).
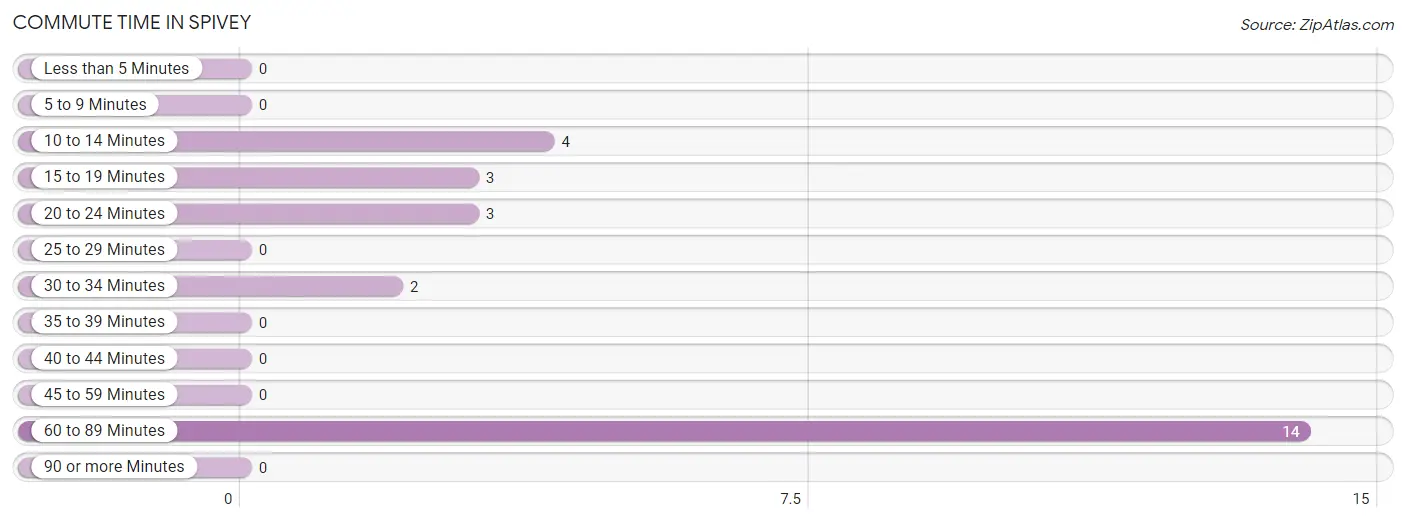
| Commute Time | # Commuters | % Commuters |
| Less than 5 Minutes | 0 | 0.0% |
| 5 to 9 Minutes | 0 | 0.0% |
| 10 to 14 Minutes | 4 | 15.4% |
| 15 to 19 Minutes | 3 | 11.5% |
| 20 to 24 Minutes | 3 | 11.5% |
| 25 to 29 Minutes | 0 | 0.0% |
| 30 to 34 Minutes | 2 | 7.7% |
| 35 to 39 Minutes | 0 | 0.0% |
| 40 to 44 Minutes | 0 | 0.0% |
| 45 to 59 Minutes | 0 | 0.0% |
| 60 to 89 Minutes | 14 | 53.8% |
| 90 or more Minutes | 0 | 0.0% |
Commute Time by Sex in Spivey
The most common commute times in Spivey are 60 to 89 minutes (14 commuters, 66.7%) for males and 10 to 14 minutes (4 commuters, 80.0%) for females.
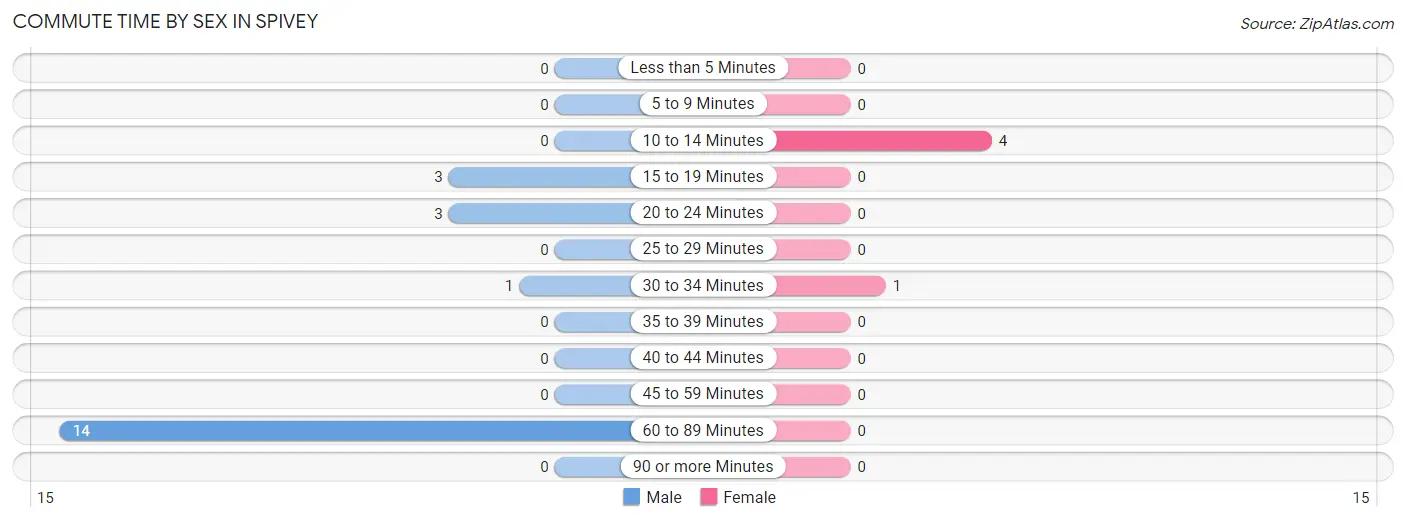
| Commute Time | Male | Female |
| Less than 5 Minutes | 0 (0.0%) | 0 (0.0%) |
| 5 to 9 Minutes | 0 (0.0%) | 0 (0.0%) |
| 10 to 14 Minutes | 0 (0.0%) | 4 (80.0%) |
| 15 to 19 Minutes | 3 (14.3%) | 0 (0.0%) |
| 20 to 24 Minutes | 3 (14.3%) | 0 (0.0%) |
| 25 to 29 Minutes | 0 (0.0%) | 0 (0.0%) |
| 30 to 34 Minutes | 1 (4.8%) | 1 (20.0%) |
| 35 to 39 Minutes | 0 (0.0%) | 0 (0.0%) |
| 40 to 44 Minutes | 0 (0.0%) | 0 (0.0%) |
| 45 to 59 Minutes | 0 (0.0%) | 0 (0.0%) |
| 60 to 89 Minutes | 14 (66.7%) | 0 (0.0%) |
| 90 or more Minutes | 0 (0.0%) | 0 (0.0%) |
Time of Departure to Work by Sex in Spivey
The most frequent times of departure to work in Spivey are 4:00 PM to 11:59 PM (9, 42.9%) for males and 11:00 AM to 11:59 AM (4, 80.0%) for females.
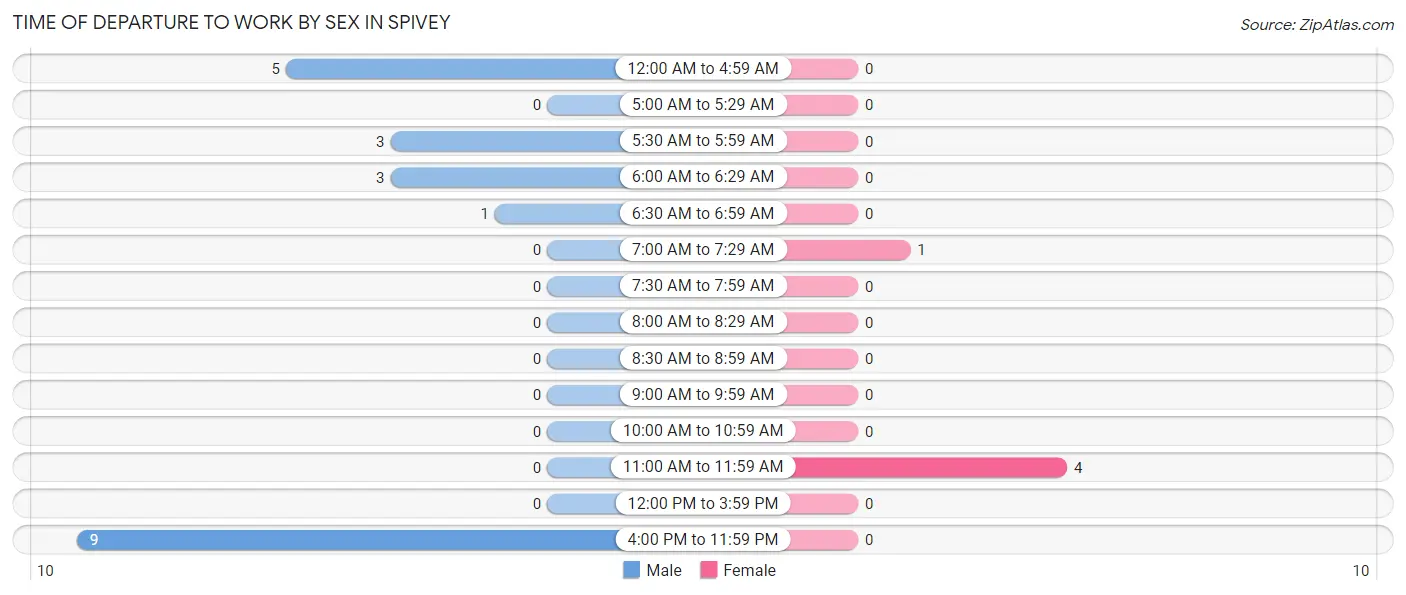
| Time of Departure | Male | Female |
| 12:00 AM to 4:59 AM | 5 (23.8%) | 0 (0.0%) |
| 5:00 AM to 5:29 AM | 0 (0.0%) | 0 (0.0%) |
| 5:30 AM to 5:59 AM | 3 (14.3%) | 0 (0.0%) |
| 6:00 AM to 6:29 AM | 3 (14.3%) | 0 (0.0%) |
| 6:30 AM to 6:59 AM | 1 (4.8%) | 0 (0.0%) |
| 7:00 AM to 7:29 AM | 0 (0.0%) | 1 (20.0%) |
| 7:30 AM to 7:59 AM | 0 (0.0%) | 0 (0.0%) |
| 8:00 AM to 8:29 AM | 0 (0.0%) | 0 (0.0%) |
| 8:30 AM to 8:59 AM | 0 (0.0%) | 0 (0.0%) |
| 9:00 AM to 9:59 AM | 0 (0.0%) | 0 (0.0%) |
| 10:00 AM to 10:59 AM | 0 (0.0%) | 0 (0.0%) |
| 11:00 AM to 11:59 AM | 0 (0.0%) | 4 (80.0%) |
| 12:00 PM to 3:59 PM | 0 (0.0%) | 0 (0.0%) |
| 4:00 PM to 11:59 PM | 9 (42.9%) | 0 (0.0%) |
| Total | 21 (100.0%) | 5 (100.0%) |
Housing Occupancy in Spivey
Occupancy by Ownership in Spivey
Of the total 29 dwellings in Spivey, owner-occupied units account for 16 (55.2%), while renter-occupied units make up 13 (44.8%).
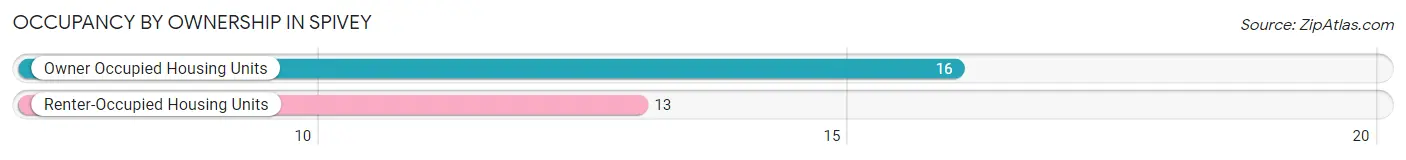
| Occupancy | # Housing Units | % Housing Units |
| Owner Occupied Housing Units | 16 | 55.2% |
| Renter-Occupied Housing Units | 13 | 44.8% |
| Total Occupied Housing Units | 29 | 100.0% |
Occupancy by Household Size in Spivey
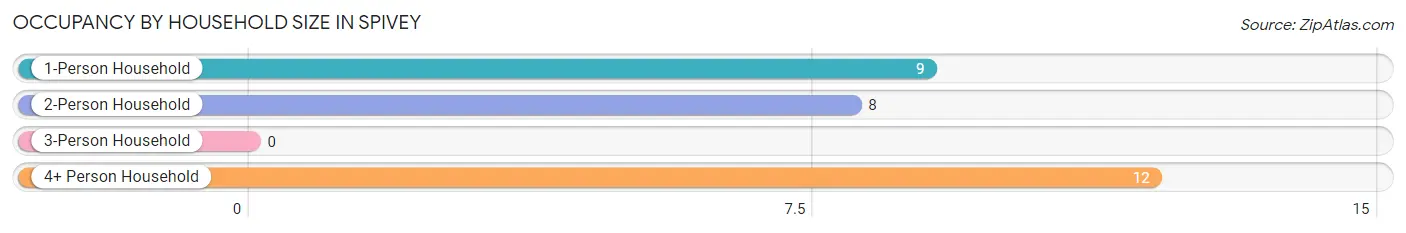
| Household Size | # Housing Units | % Housing Units |
| 1-Person Household | 9 | 31.0% |
| 2-Person Household | 8 | 27.6% |
| 3-Person Household | 0 | 0.0% |
| 4+ Person Household | 12 | 41.4% |
| Total Housing Units | 29 | 100.0% |
Occupancy by Ownership by Household Size in Spivey
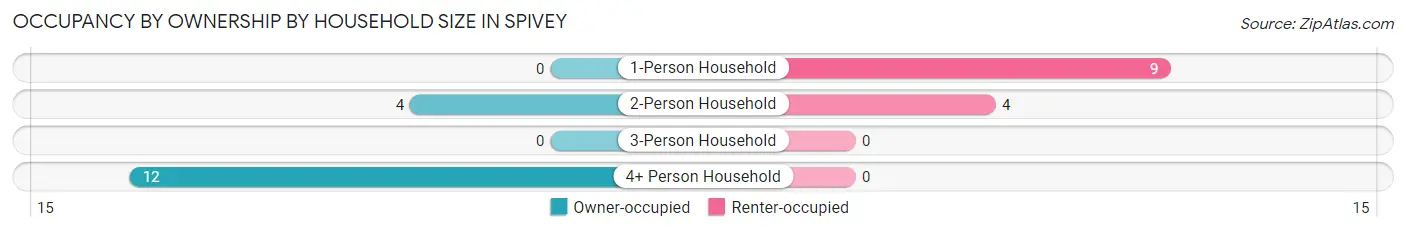
| Household Size | Owner-occupied | Renter-occupied |
| 1-Person Household | 0 (0.0%) | 9 (100.0%) |
| 2-Person Household | 4 (50.0%) | 4 (50.0%) |
| 3-Person Household | 0 (0.0%) | 0 (0.0%) |
| 4+ Person Household | 12 (100.0%) | 0 (0.0%) |
| Total Housing Units | 16 (55.2%) | 13 (44.8%) |
Occupancy by Educational Attainment in Spivey
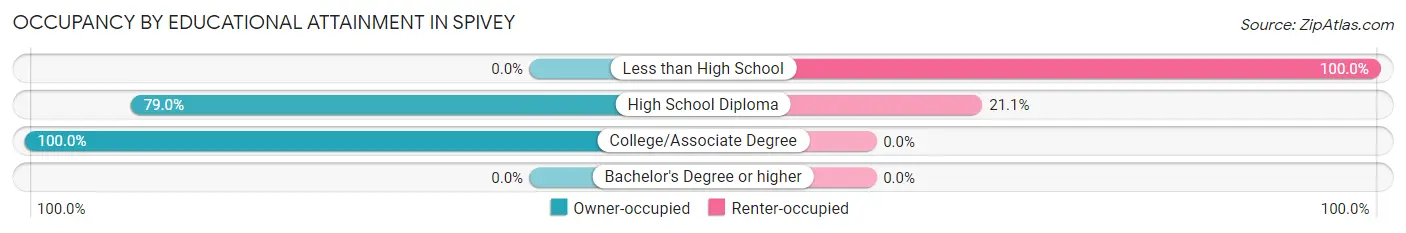
| Household Size | Owner-occupied | Renter-occupied |
| Less than High School | 0 (0.0%) | 9 (100.0%) |
| High School Diploma | 15 (78.9%) | 4 (21.0%) |
| College/Associate Degree | 1 (100.0%) | 0 (0.0%) |
| Bachelor's Degree or higher | 0 (0.0%) | 0 (0.0%) |
Occupancy by Age of Householder in Spivey
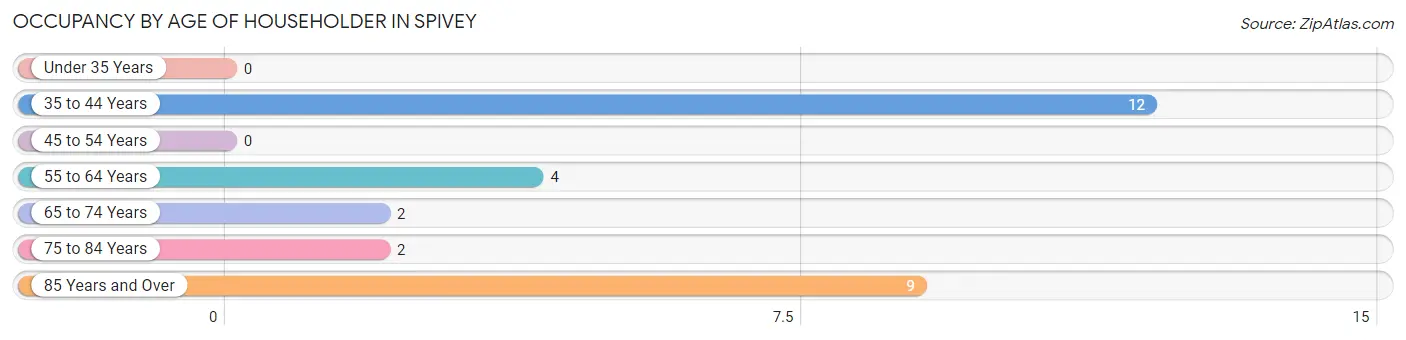
| Age Bracket | # Households | % Households |
| Under 35 Years | 0 | 0.0% |
| 35 to 44 Years | 12 | 41.4% |
| 45 to 54 Years | 0 | 0.0% |
| 55 to 64 Years | 4 | 13.8% |
| 65 to 74 Years | 2 | 6.9% |
| 75 to 84 Years | 2 | 6.9% |
| 85 Years and Over | 9 | 31.0% |
| Total | 29 | 100.0% |
Housing Finances in Spivey
Median Income by Occupancy in Spivey
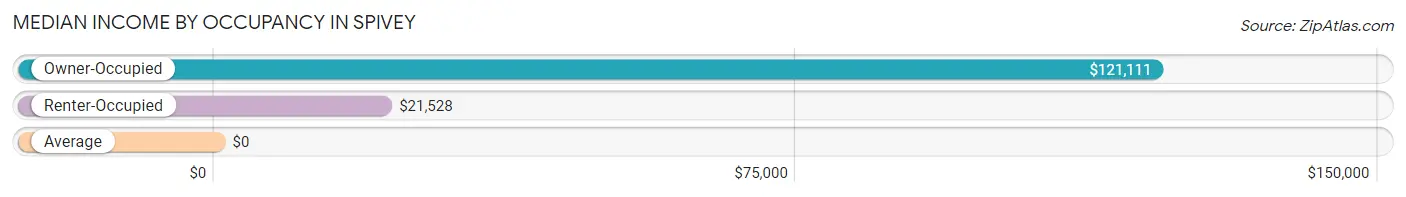
| Occupancy Type | # Households | Median Income |
| Owner-Occupied | 16 (55.2%) | $121,111 |
| Renter-Occupied | 13 (44.8%) | $21,528 |
| Average | 29 (100.0%) | $0 |
Occupancy by Householder Income Bracket in Spivey
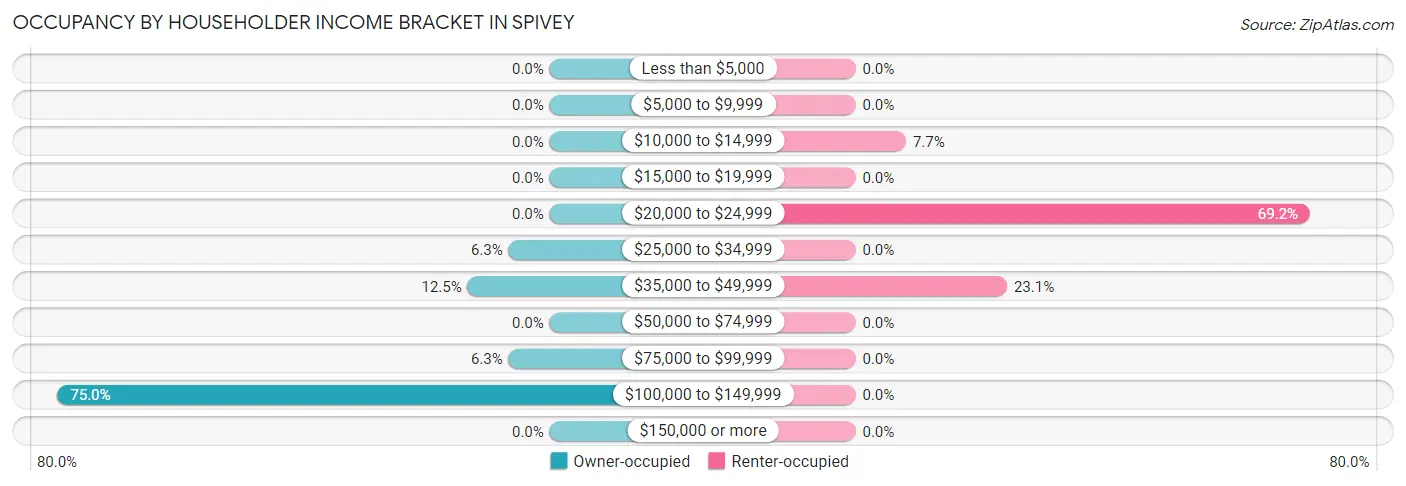
| Income Bracket | Owner-occupied | Renter-occupied |
| Less than $5,000 | 0 (0.0%) | 0 (0.0%) |
| $5,000 to $9,999 | 0 (0.0%) | 0 (0.0%) |
| $10,000 to $14,999 | 0 (0.0%) | 1 (7.7%) |
| $15,000 to $19,999 | 0 (0.0%) | 0 (0.0%) |
| $20,000 to $24,999 | 0 (0.0%) | 9 (69.2%) |
| $25,000 to $34,999 | 1 (6.2%) | 0 (0.0%) |
| $35,000 to $49,999 | 2 (12.5%) | 3 (23.1%) |
| $50,000 to $74,999 | 0 (0.0%) | 0 (0.0%) |
| $75,000 to $99,999 | 1 (6.2%) | 0 (0.0%) |
| $100,000 to $149,999 | 12 (75.0%) | 0 (0.0%) |
| $150,000 or more | 0 (0.0%) | 0 (0.0%) |
| Total | 16 (100.0%) | 13 (100.0%) |
Monthly Housing Cost Tiers in Spivey
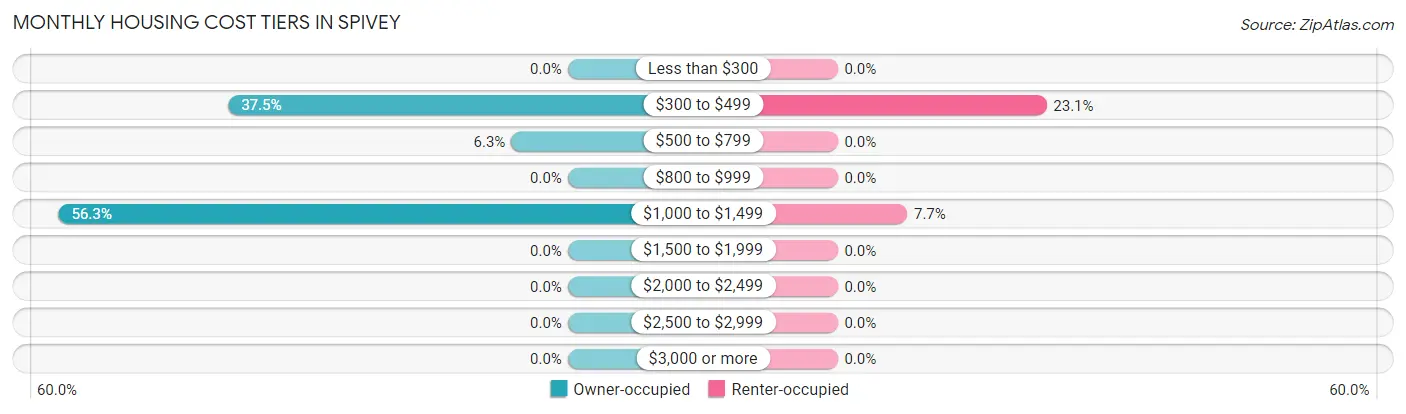
| Monthly Cost | Owner-occupied | Renter-occupied |
| Less than $300 | 0 (0.0%) | 0 (0.0%) |
| $300 to $499 | 6 (37.5%) | 3 (23.1%) |
| $500 to $799 | 1 (6.2%) | 0 (0.0%) |
| $800 to $999 | 0 (0.0%) | 0 (0.0%) |
| $1,000 to $1,499 | 9 (56.2%) | 1 (7.7%) |
| $1,500 to $1,999 | 0 (0.0%) | 0 (0.0%) |
| $2,000 to $2,499 | 0 (0.0%) | 0 (0.0%) |
| $2,500 to $2,999 | 0 (0.0%) | 0 (0.0%) |
| $3,000 or more | 0 (0.0%) | 0 (0.0%) |
| Total | 16 (100.0%) | 13 (100.0%) |
Physical Housing Characteristics in Spivey
Housing Structures in Spivey
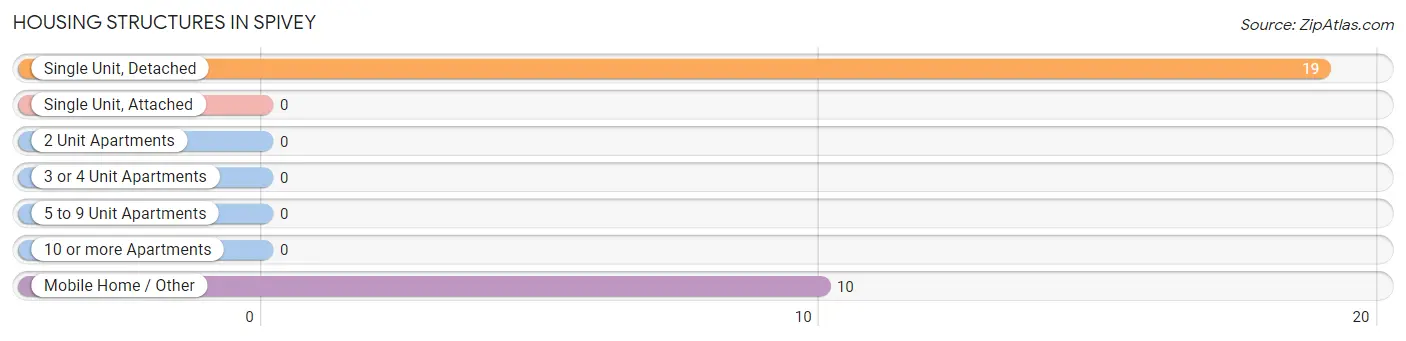
| Structure Type | # Housing Units | % Housing Units |
| Single Unit, Detached | 19 | 65.5% |
| Single Unit, Attached | 0 | 0.0% |
| 2 Unit Apartments | 0 | 0.0% |
| 3 or 4 Unit Apartments | 0 | 0.0% |
| 5 to 9 Unit Apartments | 0 | 0.0% |
| 10 or more Apartments | 0 | 0.0% |
| Mobile Home / Other | 10 | 34.5% |
| Total | 29 | 100.0% |
Housing Structures by Occupancy in Spivey
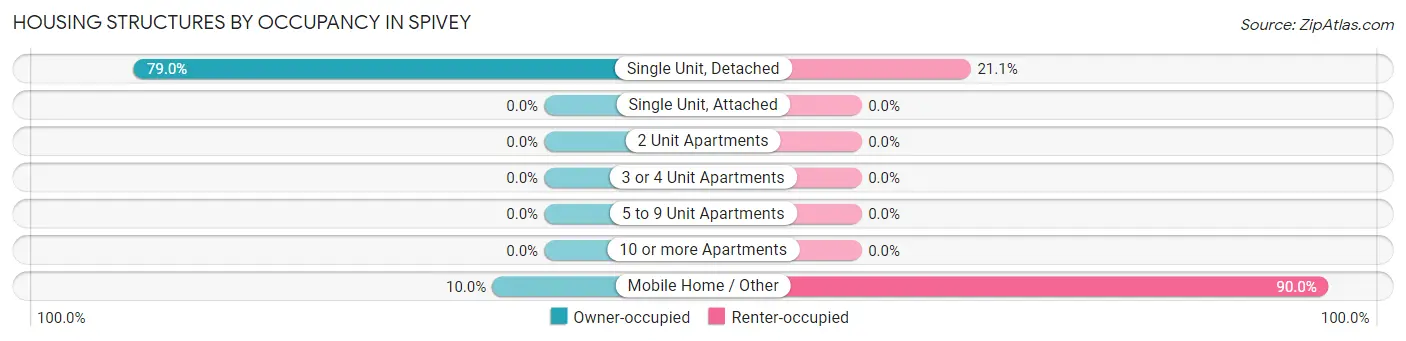
| Structure Type | Owner-occupied | Renter-occupied |
| Single Unit, Detached | 15 (78.9%) | 4 (21.0%) |
| Single Unit, Attached | 0 (0.0%) | 0 (0.0%) |
| 2 Unit Apartments | 0 (0.0%) | 0 (0.0%) |
| 3 or 4 Unit Apartments | 0 (0.0%) | 0 (0.0%) |
| 5 to 9 Unit Apartments | 0 (0.0%) | 0 (0.0%) |
| 10 or more Apartments | 0 (0.0%) | 0 (0.0%) |
| Mobile Home / Other | 1 (10.0%) | 9 (90.0%) |
| Total | 16 (55.2%) | 13 (44.8%) |
Housing Structures by Number of Rooms in Spivey
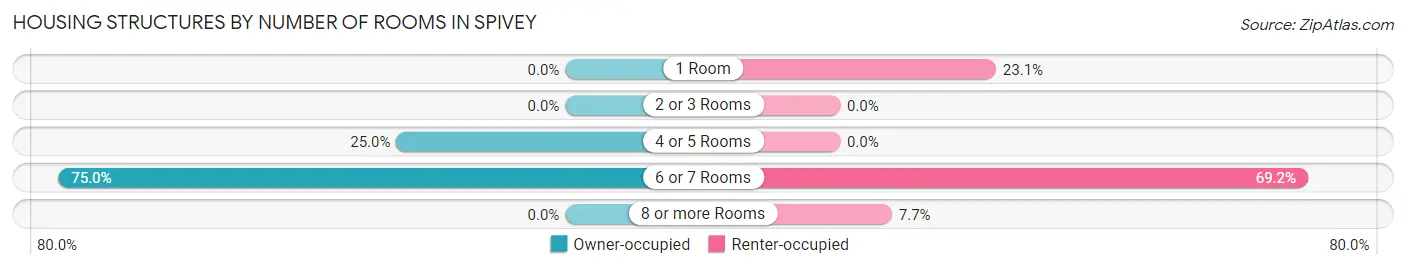
| Number of Rooms | Owner-occupied | Renter-occupied |
| 1 Room | 0 (0.0%) | 3 (23.1%) |
| 2 or 3 Rooms | 0 (0.0%) | 0 (0.0%) |
| 4 or 5 Rooms | 4 (25.0%) | 0 (0.0%) |
| 6 or 7 Rooms | 12 (75.0%) | 9 (69.2%) |
| 8 or more Rooms | 0 (0.0%) | 1 (7.7%) |
| Total | 16 (100.0%) | 13 (100.0%) |
Housing Structure by Heating Type in Spivey
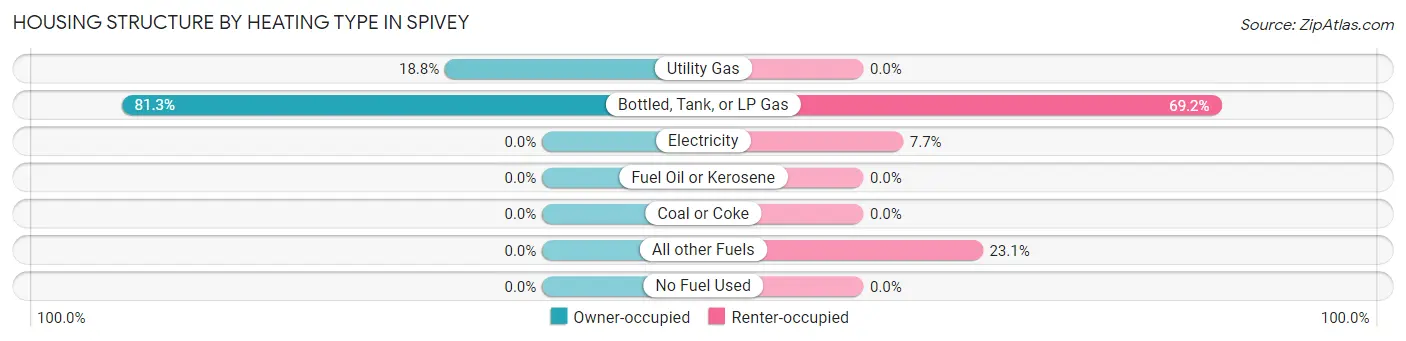
| Heating Type | Owner-occupied | Renter-occupied |
| Utility Gas | 3 (18.8%) | 0 (0.0%) |
| Bottled, Tank, or LP Gas | 13 (81.2%) | 9 (69.2%) |
| Electricity | 0 (0.0%) | 1 (7.7%) |
| Fuel Oil or Kerosene | 0 (0.0%) | 0 (0.0%) |
| Coal or Coke | 0 (0.0%) | 0 (0.0%) |
| All other Fuels | 0 (0.0%) | 3 (23.1%) |
| No Fuel Used | 0 (0.0%) | 0 (0.0%) |
| Total | 16 (100.0%) | 13 (100.0%) |
Household Vehicle Usage in Spivey
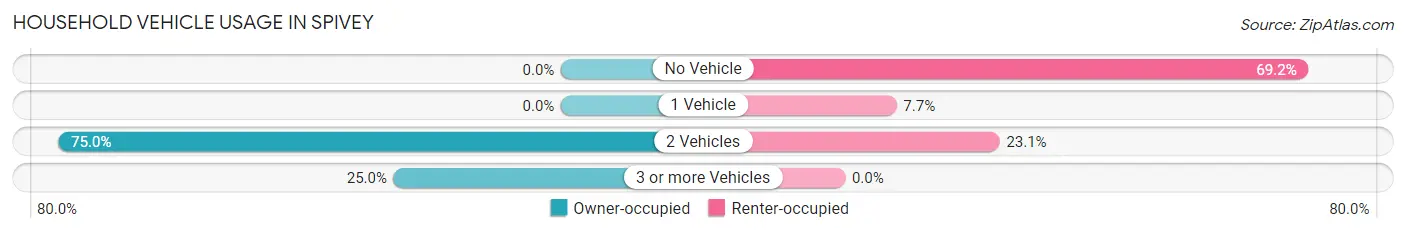
| Vehicles per Household | Owner-occupied | Renter-occupied |
| No Vehicle | 0 (0.0%) | 9 (69.2%) |
| 1 Vehicle | 0 (0.0%) | 1 (7.7%) |
| 2 Vehicles | 12 (75.0%) | 3 (23.1%) |
| 3 or more Vehicles | 4 (25.0%) | 0 (0.0%) |
| Total | 16 (100.0%) | 13 (100.0%) |
Real Estate & Mortgages in Spivey
Real Estate and Mortgage Overview in Spivey
| Characteristic | Without Mortgage | With Mortgage |
| Housing Units | 16 | 0 |
| Median Property Value | $64,400 | $0 |
| Median Household Income | $121,111 | $0 |
| Monthly Housing Costs | $1,011 | $0 |
| Real Estate Taxes | $911 | $0 |
Property Value by Mortgage Status in Spivey
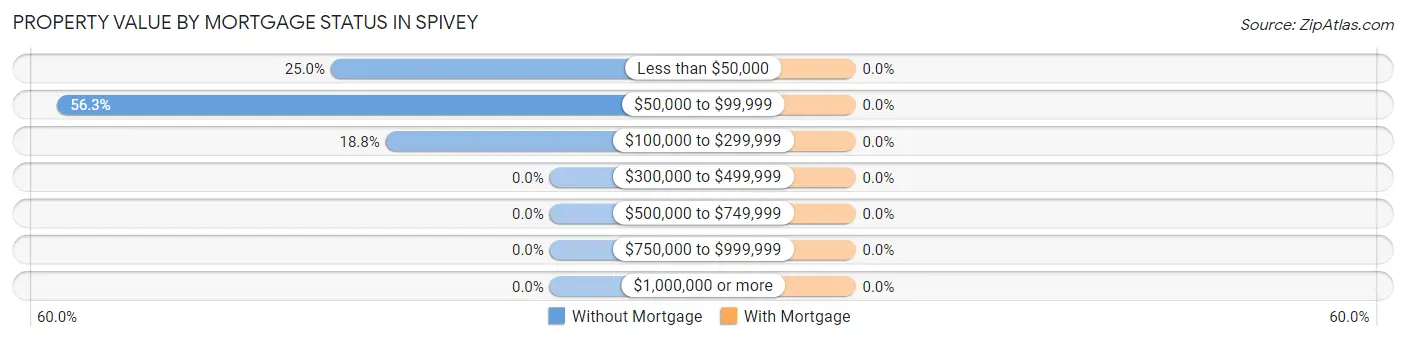
| Property Value | Without Mortgage | With Mortgage |
| Less than $50,000 | 4 (25.0%) | 0 (0.0%) |
| $50,000 to $99,999 | 9 (56.2%) | 0 (0.0%) |
| $100,000 to $299,999 | 3 (18.8%) | 0 (0.0%) |
| $300,000 to $499,999 | 0 (0.0%) | 0 (0.0%) |
| $500,000 to $749,999 | 0 (0.0%) | 0 (0.0%) |
| $750,000 to $999,999 | 0 (0.0%) | 0 (0.0%) |
| $1,000,000 or more | 0 (0.0%) | 0 (0.0%) |
| Total | 16 (100.0%) | 0 (0.0%) |
Household Income by Mortgage Status in Spivey
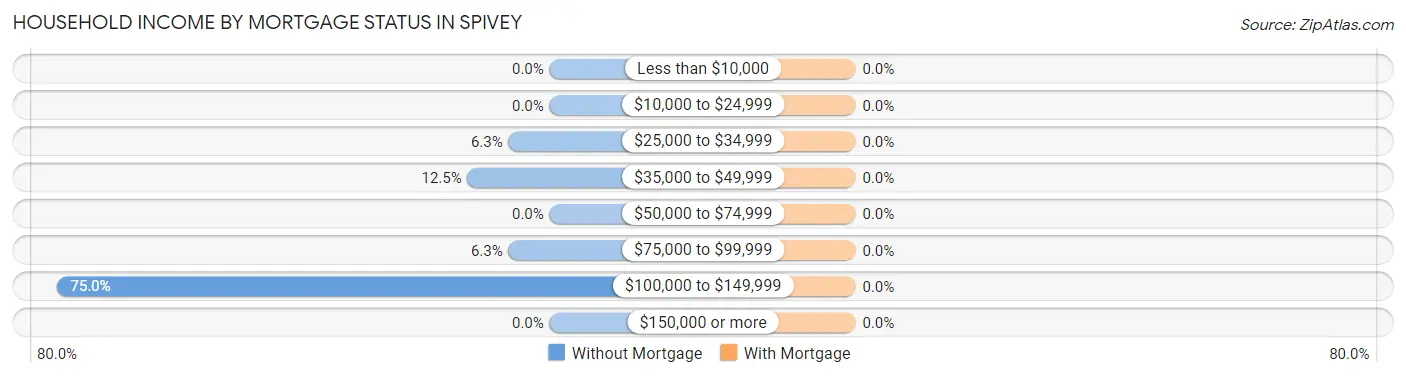
| Household Income | Without Mortgage | With Mortgage |
| Less than $10,000 | 0 (0.0%) | 0 (0.0%) |
| $10,000 to $24,999 | 0 (0.0%) | 0 (0.0%) |
| $25,000 to $34,999 | 1 (6.2%) | 0 (0.0%) |
| $35,000 to $49,999 | 2 (12.5%) | 0 (0.0%) |
| $50,000 to $74,999 | 0 (0.0%) | 0 (0.0%) |
| $75,000 to $99,999 | 1 (6.2%) | 0 (0.0%) |
| $100,000 to $149,999 | 12 (75.0%) | 0 (0.0%) |
| $150,000 or more | 0 (0.0%) | 0 (0.0%) |
| Total | 16 (100.0%) | 0 (0.0%) |
Property Value to Household Income Ratio in Spivey
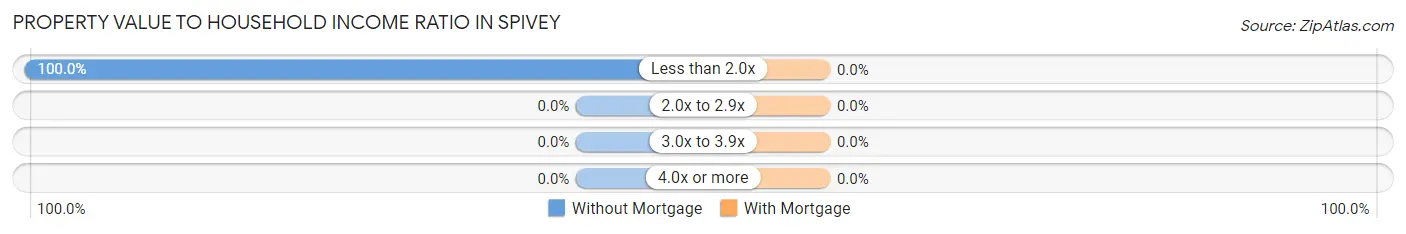
| Value-to-Income Ratio | Without Mortgage | With Mortgage |
| Less than 2.0x | 16 (100.0%) | 0 (0.0%) |
| 2.0x to 2.9x | 0 (0.0%) | 0 (0.0%) |
| 3.0x to 3.9x | 0 (0.0%) | 0 (0.0%) |
| 4.0x or more | 0 (0.0%) | 0 (0.0%) |
| Total | 16 (100.0%) | 0 (0.0%) |
Real Estate Taxes by Mortgage Status in Spivey
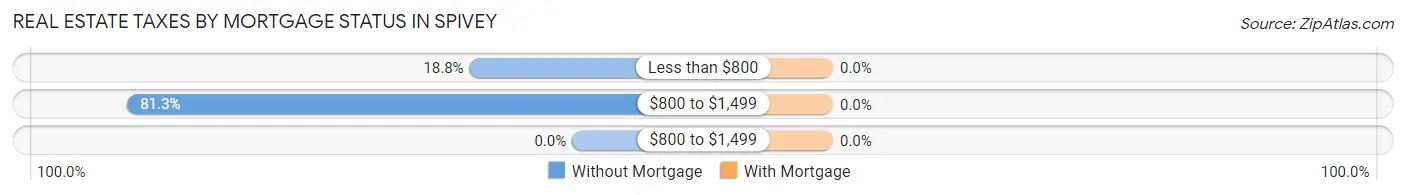
| Property Taxes | Without Mortgage | With Mortgage |
| Less than $800 | 3 (18.8%) | 0 (0.0%) |
| $800 to $1,499 | 13 (81.2%) | 0 (0.0%) |
| $800 to $1,499 | 0 (0.0%) | 0 (0.0%) |
| Total | 16 (100.0%) | 0 (0.0%) |
Health & Disability in Spivey
Health Insurance Coverage by Age in Spivey
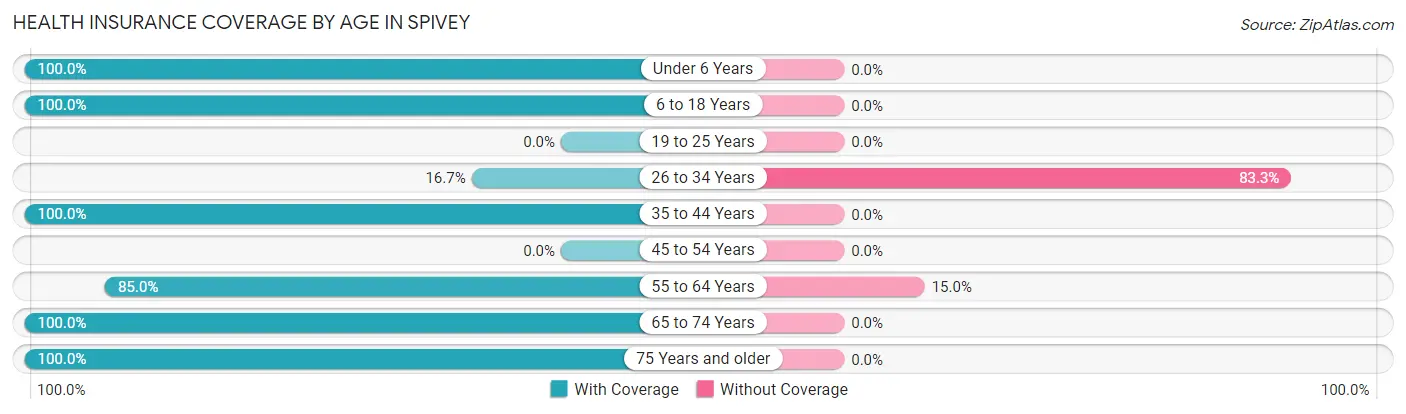
| Age Bracket | With Coverage | Without Coverage |
| Under 6 Years | 26 (100.0%) | 0 (0.0%) |
| 6 to 18 Years | 28 (100.0%) | 0 (0.0%) |
| 19 to 25 Years | 0 (0.0%) | 0 (0.0%) |
| 26 to 34 Years | 4 (16.7%) | 20 (83.3%) |
| 35 to 44 Years | 18 (100.0%) | 0 (0.0%) |
| 45 to 54 Years | 0 (0.0%) | 0 (0.0%) |
| 55 to 64 Years | 17 (85.0%) | 3 (15.0%) |
| 65 to 74 Years | 4 (100.0%) | 0 (0.0%) |
| 75 Years and older | 12 (100.0%) | 0 (0.0%) |
| Total | 109 (82.6%) | 23 (17.4%) |
Health Insurance Coverage by Citizenship Status in Spivey
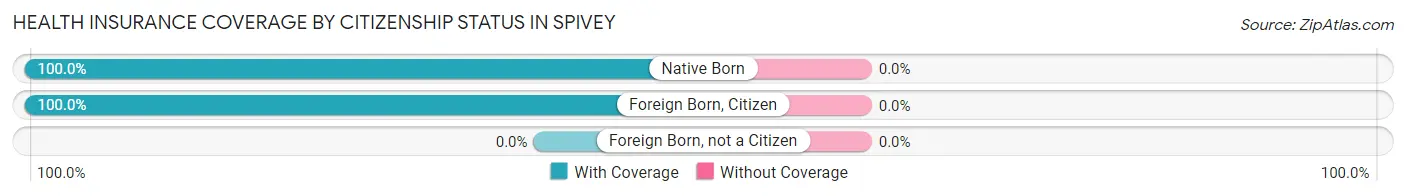
| Citizenship Status | With Coverage | Without Coverage |
| Native Born | 26 (100.0%) | 0 (0.0%) |
| Foreign Born, Citizen | 28 (100.0%) | 0 (0.0%) |
| Foreign Born, not a Citizen | 0 (0.0%) | 0 (0.0%) |
Health Insurance Coverage by Household Income in Spivey
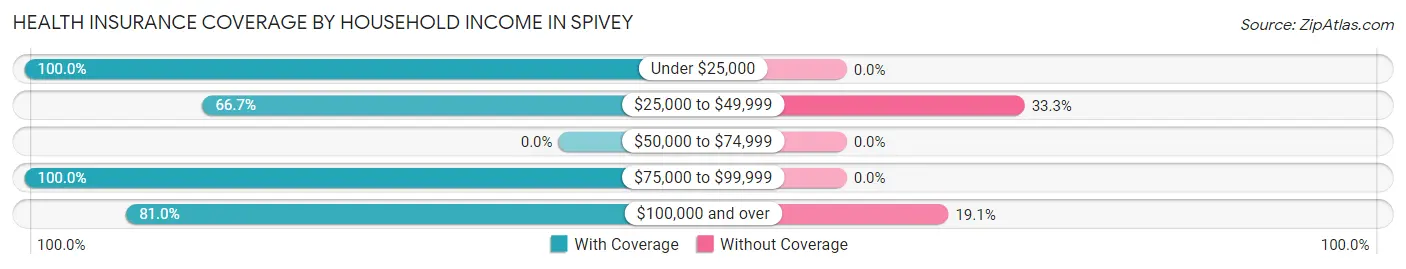
| Household Income | With Coverage | Without Coverage |
| Under $25,000 | 16 (100.0%) | 0 (0.0%) |
| $25,000 to $49,999 | 6 (66.7%) | 3 (33.3%) |
| $50,000 to $74,999 | 0 (0.0%) | 0 (0.0%) |
| $75,000 to $99,999 | 2 (100.0%) | 0 (0.0%) |
| $100,000 and over | 85 (80.9%) | 20 (19.1%) |
Public vs Private Health Insurance Coverage by Age in Spivey
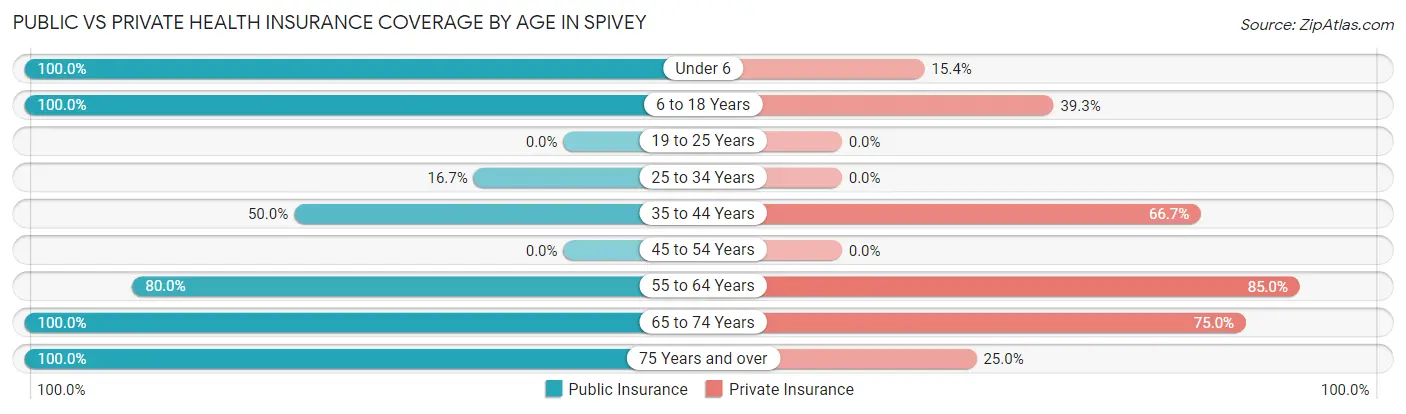
| Age Bracket | Public Insurance | Private Insurance |
| Under 6 | 26 (100.0%) | 4 (15.4%) |
| 6 to 18 Years | 28 (100.0%) | 11 (39.3%) |
| 19 to 25 Years | 0 (0.0%) | 0 (0.0%) |
| 25 to 34 Years | 4 (16.7%) | 0 (0.0%) |
| 35 to 44 Years | 9 (50.0%) | 12 (66.7%) |
| 45 to 54 Years | 0 (0.0%) | 0 (0.0%) |
| 55 to 64 Years | 16 (80.0%) | 17 (85.0%) |
| 65 to 74 Years | 4 (100.0%) | 3 (75.0%) |
| 75 Years and over | 12 (100.0%) | 3 (25.0%) |
| Total | 99 (75.0%) | 50 (37.9%) |
Disability Status by Sex by Age in Spivey
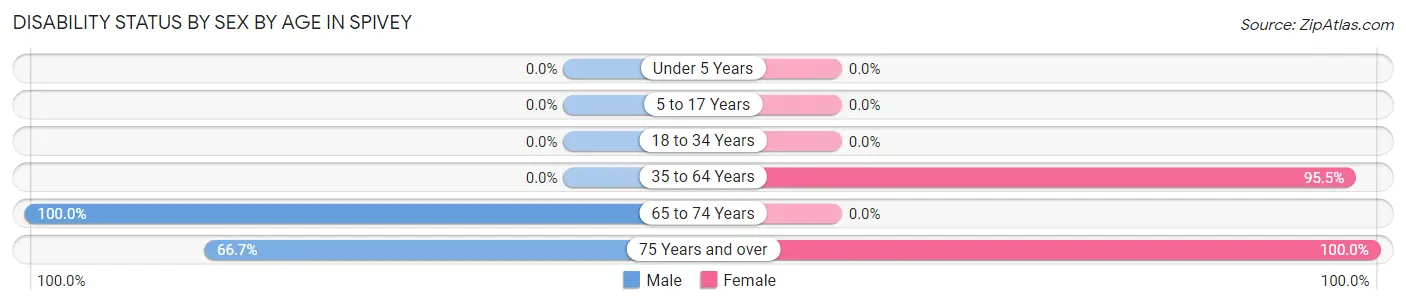
| Age Bracket | Male | Female |
| Under 5 Years | 0 (0.0%) | 0 (0.0%) |
| 5 to 17 Years | 0 (0.0%) | 0 (0.0%) |
| 18 to 34 Years | 0 (0.0%) | 0 (0.0%) |
| 35 to 64 Years | 0 (0.0%) | 21 (95.5%) |
| 65 to 74 Years | 2 (100.0%) | 0 (0.0%) |
| 75 Years and over | 2 (66.7%) | 9 (100.0%) |
Disability Class by Sex by Age in Spivey
Disability Class: Hearing Difficulty
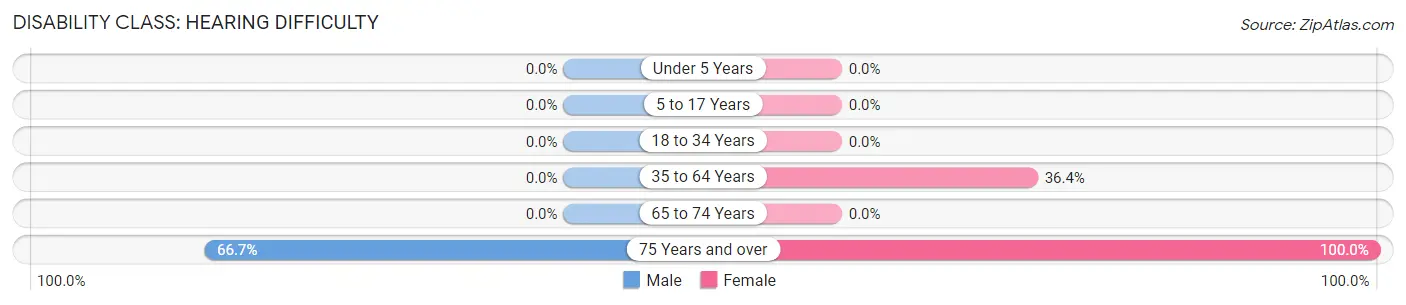
| Age Bracket | Male | Female |
| Under 5 Years | 0 (0.0%) | 0 (0.0%) |
| 5 to 17 Years | 0 (0.0%) | 0 (0.0%) |
| 18 to 34 Years | 0 (0.0%) | 0 (0.0%) |
| 35 to 64 Years | 0 (0.0%) | 8 (36.4%) |
| 65 to 74 Years | 0 (0.0%) | 0 (0.0%) |
| 75 Years and over | 2 (66.7%) | 9 (100.0%) |
Disability Class: Vision Difficulty
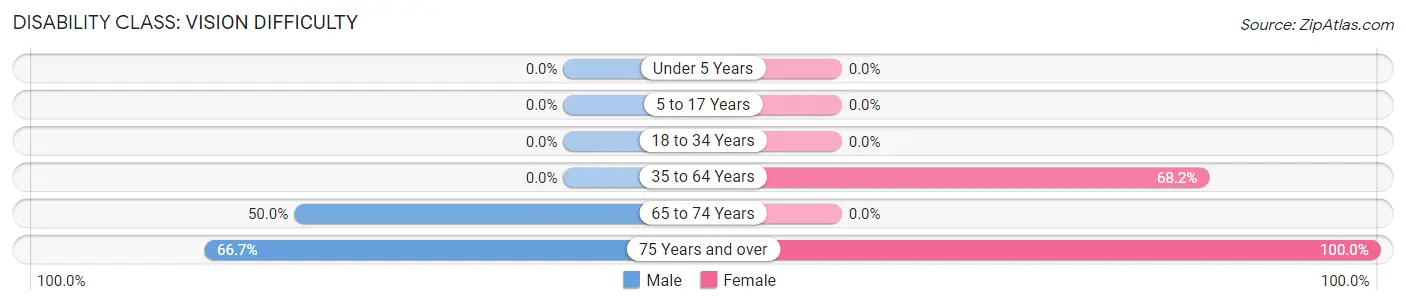
| Age Bracket | Male | Female |
| Under 5 Years | 0 (0.0%) | 0 (0.0%) |
| 5 to 17 Years | 0 (0.0%) | 0 (0.0%) |
| 18 to 34 Years | 0 (0.0%) | 0 (0.0%) |
| 35 to 64 Years | 0 (0.0%) | 15 (68.2%) |
| 65 to 74 Years | 1 (50.0%) | 0 (0.0%) |
| 75 Years and over | 2 (66.7%) | 9 (100.0%) |
Disability Class: Cognitive Difficulty
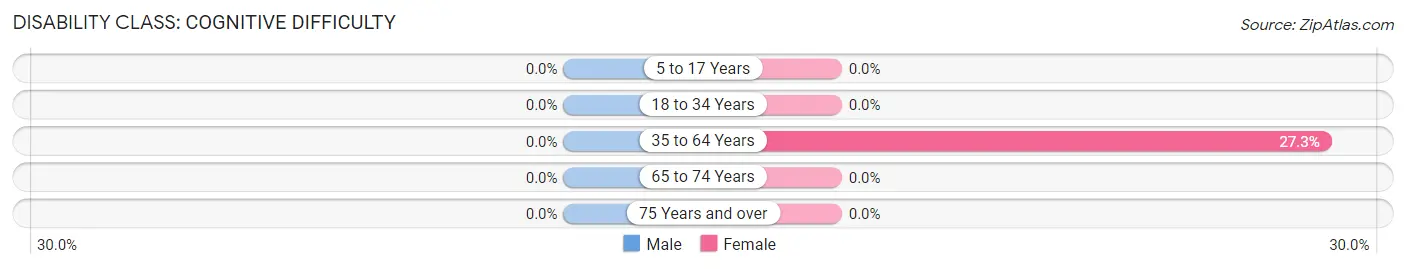
| Age Bracket | Male | Female |
| 5 to 17 Years | 0 (0.0%) | 0 (0.0%) |
| 18 to 34 Years | 0 (0.0%) | 0 (0.0%) |
| 35 to 64 Years | 0 (0.0%) | 6 (27.3%) |
| 65 to 74 Years | 0 (0.0%) | 0 (0.0%) |
| 75 Years and over | 0 (0.0%) | 0 (0.0%) |
Disability Class: Ambulatory Difficulty
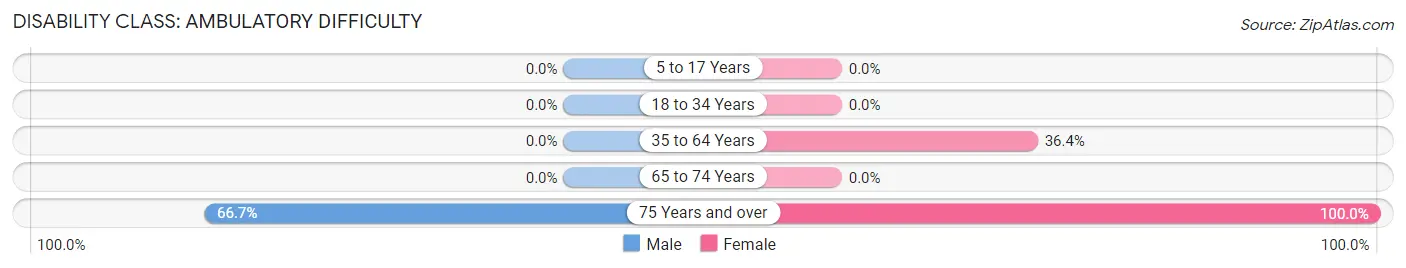
| Age Bracket | Male | Female |
| 5 to 17 Years | 0 (0.0%) | 0 (0.0%) |
| 18 to 34 Years | 0 (0.0%) | 0 (0.0%) |
| 35 to 64 Years | 0 (0.0%) | 8 (36.4%) |
| 65 to 74 Years | 0 (0.0%) | 0 (0.0%) |
| 75 Years and over | 2 (66.7%) | 9 (100.0%) |
Disability Class: Self-Care Difficulty
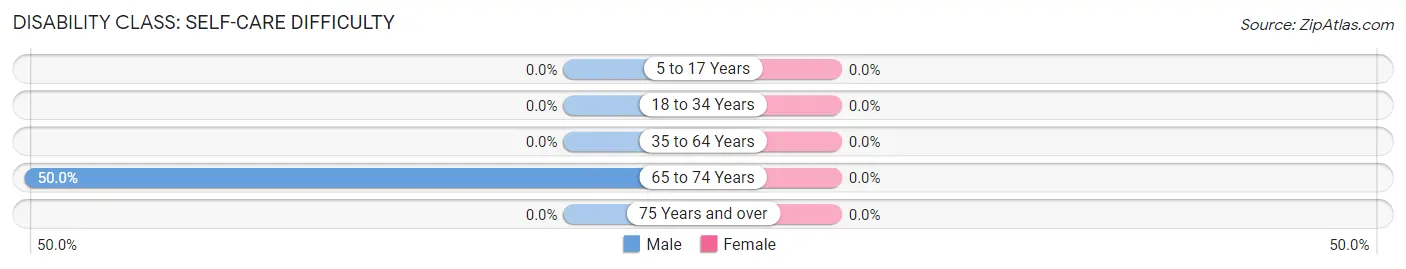
| Age Bracket | Male | Female |
| 5 to 17 Years | 0 (0.0%) | 0 (0.0%) |
| 18 to 34 Years | 0 (0.0%) | 0 (0.0%) |
| 35 to 64 Years | 0 (0.0%) | 0 (0.0%) |
| 65 to 74 Years | 1 (50.0%) | 0 (0.0%) |
| 75 Years and over | 0 (0.0%) | 0 (0.0%) |
Technology Access in Spivey
Computing Device Access in Spivey
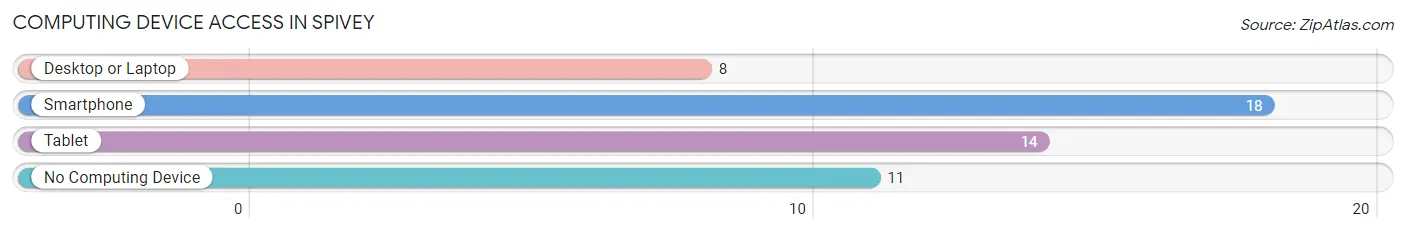
| Device Type | # Households | % Households |
| Desktop or Laptop | 8 | 27.6% |
| Smartphone | 18 | 62.1% |
| Tablet | 14 | 48.3% |
| No Computing Device | 11 | 37.9% |
| Total | 29 | 100.0% |
Internet Access in Spivey
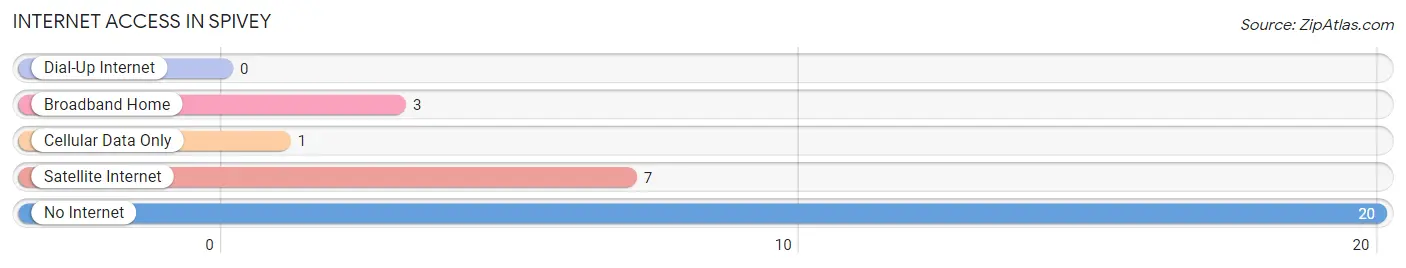
| Internet Type | # Households | % Households |
| Dial-Up Internet | 0 | 0.0% |
| Broadband Home | 3 | 10.3% |
| Cellular Data Only | 1 | 3.5% |
| Satellite Internet | 7 | 24.1% |
| No Internet | 20 | 69.0% |
| Total | 29 | 100.0% |
Spivey Summary
Spivey, Kansas is a small town located in the southeastern corner of the state. It is situated in the Flint Hills region of Kansas, and is part of the Wichita metropolitan area. The town has a population of just over 500 people, and is known for its rural charm and friendly atmosphere.
History
Spivey, Kansas was founded in 1887 by a group of settlers from Missouri. The town was named after the Spivey family, who were among the first settlers. The town was originally a farming community, and the main crops grown were wheat, corn, and hay. In the early 1900s, the town began to grow and develop, and a post office was established in 1906.
In the 1920s, the town began to experience a period of growth and prosperity. The population increased, and businesses began to open. The town was home to a variety of businesses, including a bank, a hotel, a general store, and a blacksmith shop.
In the 1950s, the town began to decline. Many of the businesses closed, and the population began to decrease. In the 1970s, the town was revitalized, and the population began to increase again.
Geography
Spivey, Kansas is located in the southeastern corner of the state. It is situated in the Flint Hills region of Kansas, and is part of the Wichita metropolitan area. The town is located on the banks of the Arkansas River, and is surrounded by rolling hills and prairies. The town has a total area of 0.6 square miles, all of which is land.
Economy
The economy of Spivey, Kansas is largely based on agriculture. The town is home to several farms, and the main crops grown are wheat, corn, and hay. The town also has a few small businesses, including a general store, a gas station, and a restaurant.
Demographics
As of the 2010 census, the population of Spivey, Kansas was 514. The racial makeup of the town was 97.3% White, 0.6% African American, 0.2% Native American, 0.2% Asian, 0.4% from other races, and 1.3% from two or more races. The median household income was $37,500, and the median family income was $45,000. The per capita income was $17,000.
Conclusion
Spivey, Kansas is a small town located in the southeastern corner of the state. It is situated in the Flint Hills region of Kansas, and is part of the Wichita metropolitan area. The town has a population of just over 500 people, and is known for its rural charm and friendly atmosphere. The economy of the town is largely based on agriculture, and the main crops grown are wheat, corn, and hay. The town also has a few small businesses, including a general store, a gas station, and a restaurant. The population of Spivey, Kansas is 97.3% White, 0.6% African American, 0.2% Native American, 0.2% Asian, 0.4% from other races, and 1.3% from two or more races. The median household income was $37,500, and the median family income was $45,000. The per capita income was $17,000.
Common Questions
What is Per Capita Income in Spivey?
Per Capita income in Spivey is $14,563.
What is the Median Family Income in Spivey?
Median Family Income in Spivey is $120,556.
What is Inequality or Gini Index in Spivey?
Inequality or Gini Index in Spivey is 0.37.
What is the Total Population of Spivey?
Total Population of Spivey is 132.
What is the Total Male Population of Spivey?
Total Male Population of Spivey is 51.
What is the Total Female Population of Spivey?
Total Female Population of Spivey is 81.
What is the Ratio of Males per 100 Females in Spivey?
There are 62.96 Males per 100 Females in Spivey.
What is the Ratio of Females per 100 Males in Spivey?
There are 158.82 Females per 100 Males in Spivey.
What is the Median Population Age in Spivey?
Median Population Age in Spivey is 28.8 Years.
What is the Average Family Size in Spivey
Average Family Size in Spivey is 6.2 People.
What is the Average Household Size in Spivey
Average Household Size in Spivey is 4.5 People.
How Large is the Labor Force in Spivey?
There are 26 People in the Labor Forcein in Spivey.
What is the Percentage of People in the Labor Force in Spivey?
33.3% of People are in the Labor Force in Spivey.