Ness City, KS Map & Demographics
Ness City Map
Ness City Overview
$44,670
PER CAPITA INCOME
$105,060
AVG FAMILY INCOME
$77,917
AVG HOUSEHOLD INCOME
56.3%
WAGE / INCOME GAP [ % ]
43.7¢/ $1
WAGE / INCOME GAP [ $ ]
0.50
INEQUALITY / GINI INDEX
1,243
TOTAL POPULATION
645
MALE POPULATION
598
FEMALE POPULATION
107.86
MALES / 100 FEMALES
92.71
FEMALES / 100 MALES
46.9
MEDIAN AGE
3.0
AVG FAMILY SIZE
2.4
AVG HOUSEHOLD SIZE
691
LABOR FORCE [ PEOPLE ]
68.3%
PERCENT IN LABOR FORCE
0.4%
UNEMPLOYMENT RATE
Ness City Zip Codes
Ness City Area Codes
Income in Ness City
Income Overview in Ness City
Per Capita Income in Ness City is $44,670, while median incomes of families and households are $105,060 and $77,917 respectively.
| Characteristic | Number | Measure |
| Per Capita Income | 1,243 | $44,670 |
| Median Family Income | 333 | $105,060 |
| Mean Family Income | 333 | $136,929 |
| Median Household Income | 508 | $77,917 |
| Mean Household Income | 508 | $105,594 |
| Income Deficit | 333 | $0 |
| Wage / Income Gap (%) | 1,243 | 56.26% |
| Wage / Income Gap ($) | 1,243 | 43.74¢ per $1 |
| Gini / Inequality Index | 1,243 | 0.50 |
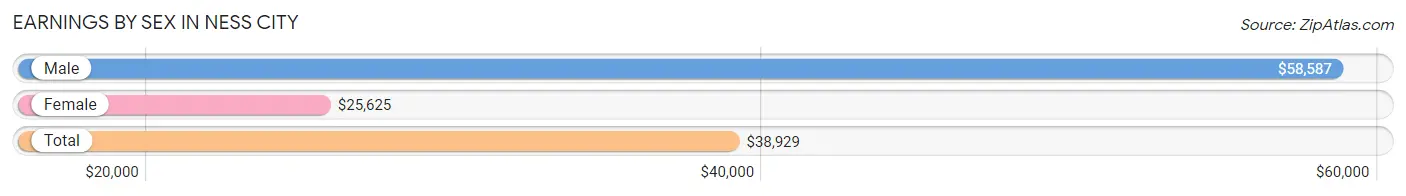
Earnings by Sex in Ness City
Average Earnings in Ness City are $38,929, $58,587 for men and $25,625 for women, a difference of 56.3%.
| Sex | Number | Average Earnings |
| Male | 398 (52.9%) | $58,587 |
| Female | 354 (47.1%) | $25,625 |
| Total | 752 (100.0%) | $38,929 |
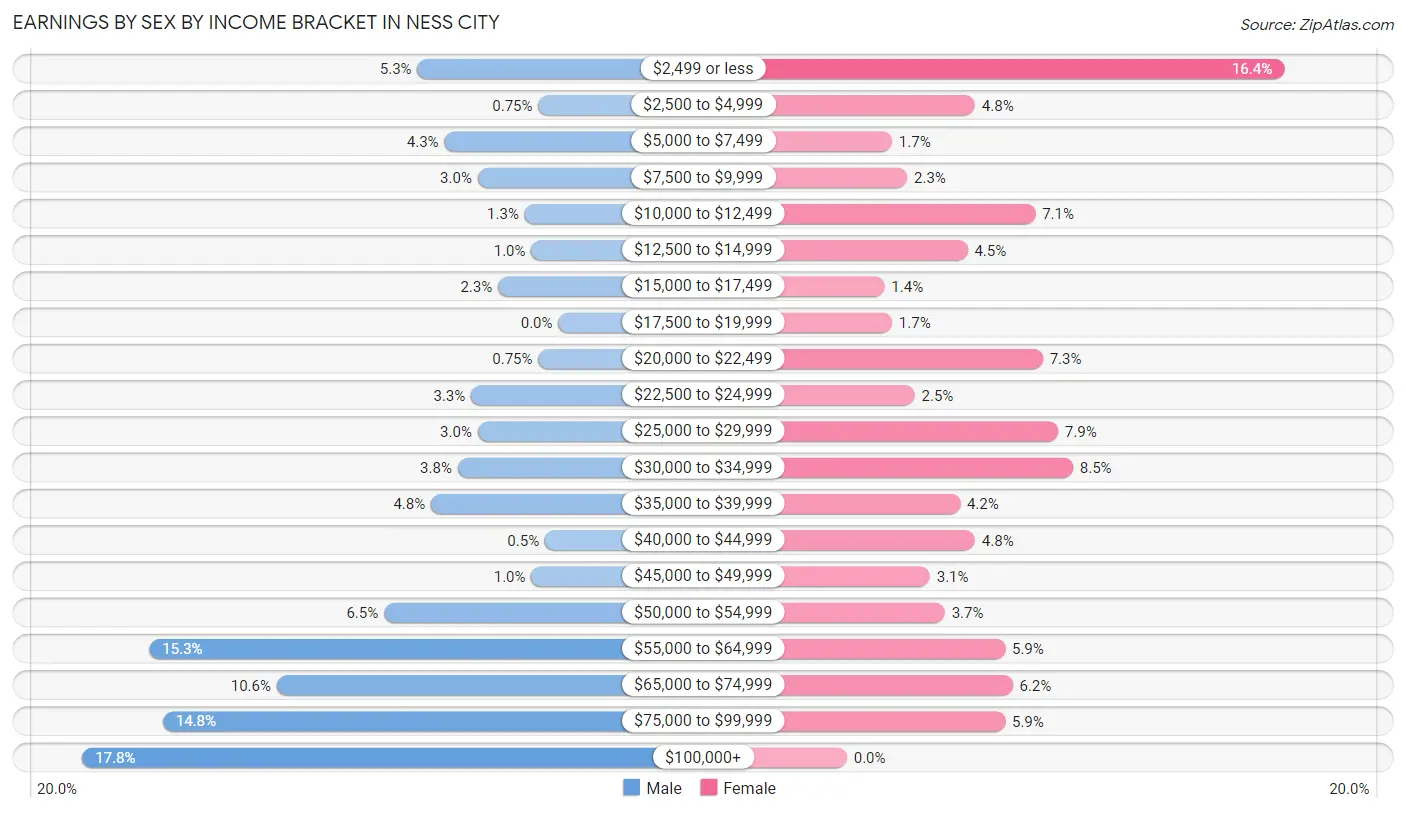
Earnings by Sex by Income Bracket in Ness City
The most common earnings brackets in Ness City are $100,000+ for men (71 | 17.8%) and $2,499 or less for women (58 | 16.4%).
| Income | Male | Female |
| $2,499 or less | 21 (5.3%) | 58 (16.4%) |
| $2,500 to $4,999 | 3 (0.7%) | 17 (4.8%) |
| $5,000 to $7,499 | 17 (4.3%) | 6 (1.7%) |
| $7,500 to $9,999 | 12 (3.0%) | 8 (2.3%) |
| $10,000 to $12,499 | 5 (1.3%) | 25 (7.1%) |
| $12,500 to $14,999 | 4 (1.0%) | 16 (4.5%) |
| $15,000 to $17,499 | 9 (2.3%) | 5 (1.4%) |
| $17,500 to $19,999 | 0 (0.0%) | 6 (1.7%) |
| $20,000 to $22,499 | 3 (0.7%) | 26 (7.3%) |
| $22,500 to $24,999 | 13 (3.3%) | 9 (2.5%) |
| $25,000 to $29,999 | 12 (3.0%) | 28 (7.9%) |
| $30,000 to $34,999 | 15 (3.8%) | 30 (8.5%) |
| $35,000 to $39,999 | 19 (4.8%) | 15 (4.2%) |
| $40,000 to $44,999 | 2 (0.5%) | 17 (4.8%) |
| $45,000 to $49,999 | 4 (1.0%) | 11 (3.1%) |
| $50,000 to $54,999 | 26 (6.5%) | 13 (3.7%) |
| $55,000 to $64,999 | 61 (15.3%) | 21 (5.9%) |
| $65,000 to $74,999 | 42 (10.5%) | 22 (6.2%) |
| $75,000 to $99,999 | 59 (14.8%) | 21 (5.9%) |
| $100,000+ | 71 (17.8%) | 0 (0.0%) |
| Total | 398 (100.0%) | 354 (100.0%) |
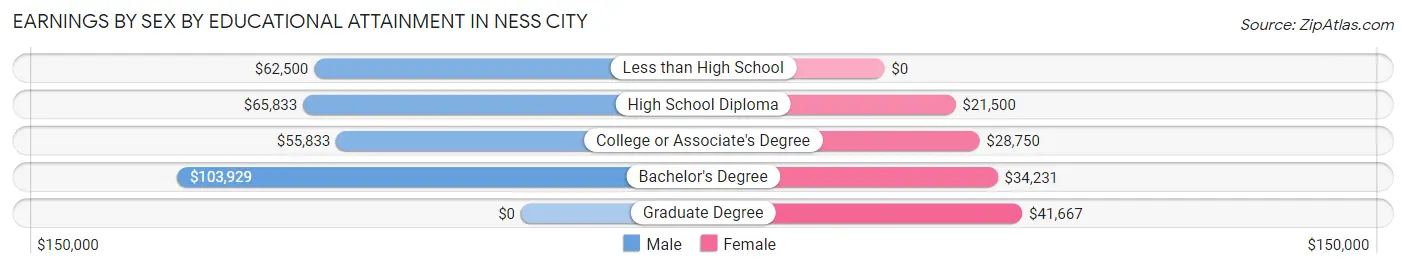
Earnings by Sex by Educational Attainment in Ness City
Average earnings in Ness City are $63,625 for men and $28,750 for women, a difference of 54.8%. Men with an educational attainment of bachelor's degree enjoy the highest average annual earnings of $103,929, while those with college or associate's degree education earn the least with $55,833. Women with an educational attainment of graduate degree earn the most with the average annual earnings of $41,667, while those with high school diploma education have the smallest earnings of $21,500.
| Educational Attainment | Male Income | Female Income |
| Less than High School | $62,500 | $0 |
| High School Diploma | $65,833 | $21,500 |
| College or Associate's Degree | $55,833 | $28,750 |
| Bachelor's Degree | $103,929 | $34,231 |
| Graduate Degree | - | - |
| Total | $63,625 | $28,750 |
Family Income in Ness City
Family Income Brackets in Ness City
According to the Ness City family income data, there are 104 families falling into the $100,000 to $149,999 income range, which is the most common income bracket and makes up 31.2% of all families. Conversely, the $15,000 to $24,999 income bracket is the least frequent group with only 3 families (0.9%) belonging to this category.
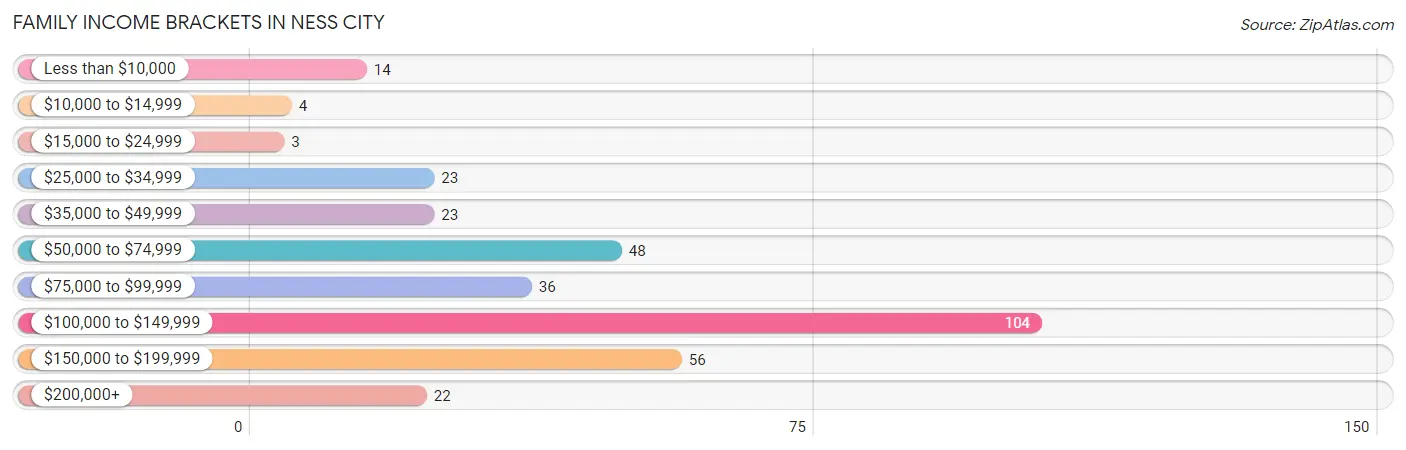
| Income Bracket | # Families | % Families |
| Less than $10,000 | 14 | 4.2% |
| $10,000 to $14,999 | 4 | 1.2% |
| $15,000 to $24,999 | 3 | 0.9% |
| $25,000 to $34,999 | 23 | 6.9% |
| $35,000 to $49,999 | 23 | 6.9% |
| $50,000 to $74,999 | 48 | 14.4% |
| $75,000 to $99,999 | 36 | 10.8% |
| $100,000 to $149,999 | 104 | 31.2% |
| $150,000 to $199,999 | 56 | 16.8% |
| $200,000+ | 22 | 6.6% |
Family Income by Famaliy Size in Ness City
4-person families (61 | 18.3%) account for the highest median family income in Ness City with $137,188 per family, while 2-person families (192 | 57.7%) have the highest median income of $52,574 per family member.
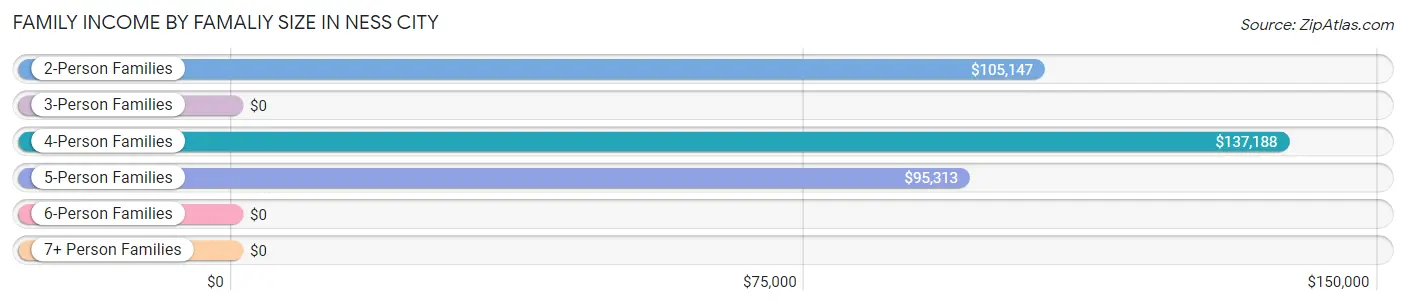
| Income Bracket | # Families | Median Income |
| 2-Person Families | 192 (57.7%) | $105,147 |
| 3-Person Families | 45 (13.5%) | $0 |
| 4-Person Families | 61 (18.3%) | $137,188 |
| 5-Person Families | 32 (9.6%) | $95,313 |
| 6-Person Families | 3 (0.9%) | $0 |
| 7+ Person Families | 0 (0.0%) | $0 |
| Total | 333 (100.0%) | $105,060 |
Family Income by Number of Earners in Ness City
The median family income in Ness City is $105,060, with families comprising 3+ earners (20) having the highest median family income of $118,333, while families with no earners (28) have the lowest median family income of $33,333, accounting for 6.0% and 8.4% of families, respectively.
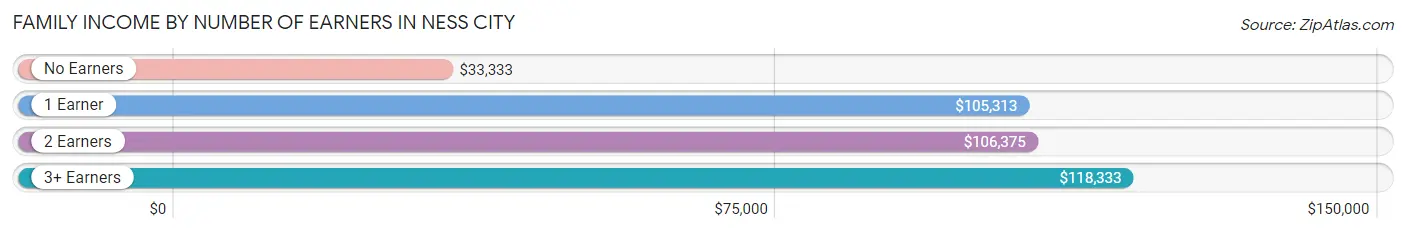
| Number of Earners | # Families | Median Income |
| No Earners | 28 (8.4%) | $33,333 |
| 1 Earner | 76 (22.8%) | $105,313 |
| 2 Earners | 209 (62.8%) | $106,375 |
| 3+ Earners | 20 (6.0%) | $118,333 |
| Total | 333 (100.0%) | $105,060 |
Household Income in Ness City
Household Income Brackets in Ness City
With 112 households falling in the category, the $100,000 to $149,999 income range is the most frequent in Ness City, accounting for 22.1% of all households. In contrast, only 18 households (3.5%) fall into the $10,000 to $14,999 income bracket, making it the least populous group.
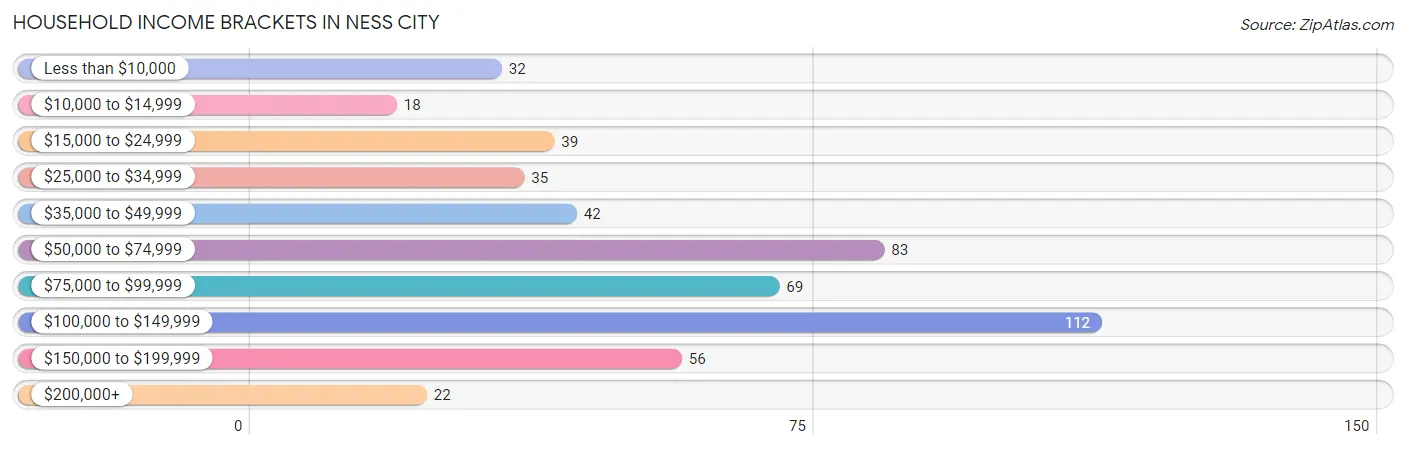
| Income Bracket | # Households | % Households |
| Less than $10,000 | 32 | 6.3% |
| $10,000 to $14,999 | 18 | 3.5% |
| $15,000 to $24,999 | 39 | 7.7% |
| $25,000 to $34,999 | 35 | 6.9% |
| $35,000 to $49,999 | 42 | 8.3% |
| $50,000 to $74,999 | 83 | 16.3% |
| $75,000 to $99,999 | 69 | 13.6% |
| $100,000 to $149,999 | 112 | 22.0% |
| $150,000 to $199,999 | 56 | 11.0% |
| $200,000+ | 22 | 4.3% |
Household Income by Householder Age in Ness City
The median household income in Ness City is $77,917, with the highest median household income of $98,750 found in the 45 to 64 years age bracket for the primary householder. A total of 200 households (39.4%) fall into this category. Meanwhile, the 15 to 24 years age bracket for the primary householder has the lowest median household income of $0, with 39 households (7.7%) in this group.
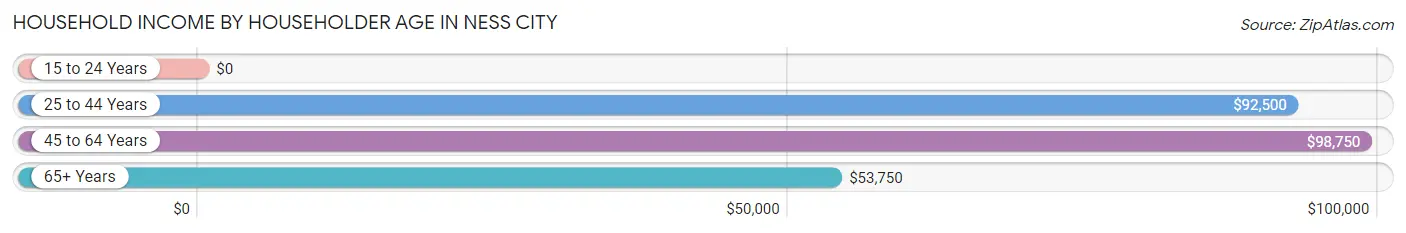
| Income Bracket | # Households | Median Income |
| 15 to 24 Years | 39 (7.7%) | $0 |
| 25 to 44 Years | 98 (19.3%) | $92,500 |
| 45 to 64 Years | 200 (39.4%) | $98,750 |
| 65+ Years | 171 (33.7%) | $53,750 |
| Total | 508 (100.0%) | $77,917 |
Poverty in Ness City
Income Below Poverty by Sex and Age in Ness City
With 8.5% poverty level for males and 7.1% for females among the residents of Ness City, 18 to 24 year old males and 18 to 24 year old females are the most vulnerable to poverty, with 9 males (23.7%) and 12 females (21.0%) in their respective age groups living below the poverty level.
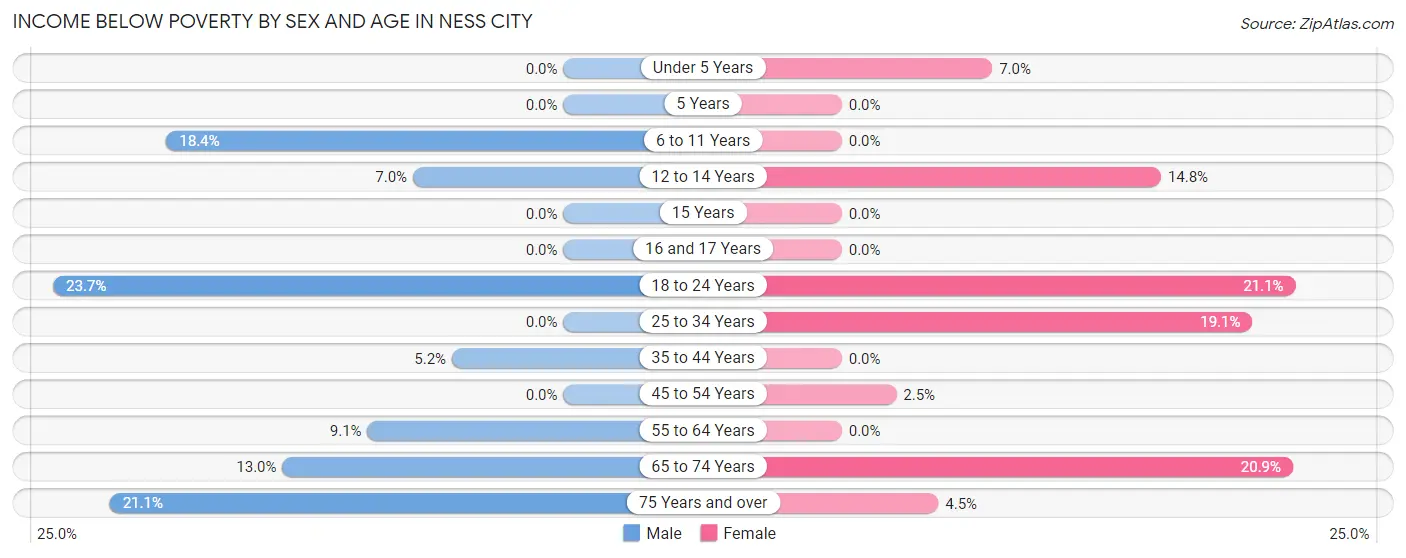
| Age Bracket | Male | Female |
| Under 5 Years | 0 (0.0%) | 3 (7.0%) |
| 5 Years | 0 (0.0%) | 0 (0.0%) |
| 6 to 11 Years | 7 (18.4%) | 0 (0.0%) |
| 12 to 14 Years | 3 (7.0%) | 4 (14.8%) |
| 15 Years | 0 (0.0%) | 0 (0.0%) |
| 16 and 17 Years | 0 (0.0%) | 0 (0.0%) |
| 18 to 24 Years | 9 (23.7%) | 12 (21.0%) |
| 25 to 34 Years | 0 (0.0%) | 8 (19.1%) |
| 35 to 44 Years | 3 (5.2%) | 0 (0.0%) |
| 45 to 54 Years | 0 (0.0%) | 2 (2.5%) |
| 55 to 64 Years | 11 (9.1%) | 0 (0.0%) |
| 65 to 74 Years | 12 (13.0%) | 9 (20.9%) |
| 75 Years and over | 8 (21.0%) | 3 (4.5%) |
| Total | 53 (8.5%) | 41 (7.1%) |
Income Above Poverty by Sex and Age in Ness City
According to the poverty statistics in Ness City, males aged under 5 years and females aged 5 years are the age groups that are most secure financially, with 100.0% of males and 100.0% of females in these age groups living above the poverty line.
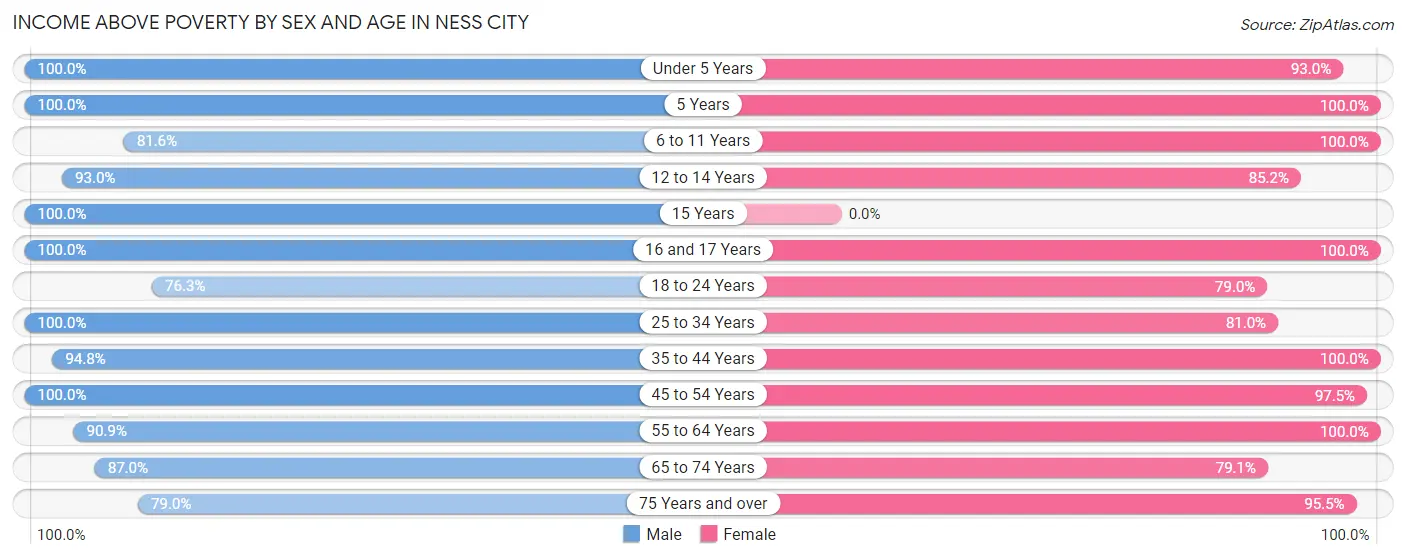
| Age Bracket | Male | Female |
| Under 5 Years | 30 (100.0%) | 40 (93.0%) |
| 5 Years | 3 (100.0%) | 8 (100.0%) |
| 6 to 11 Years | 31 (81.6%) | 22 (100.0%) |
| 12 to 14 Years | 40 (93.0%) | 23 (85.2%) |
| 15 Years | 14 (100.0%) | 0 (0.0%) |
| 16 and 17 Years | 35 (100.0%) | 20 (100.0%) |
| 18 to 24 Years | 29 (76.3%) | 45 (78.9%) |
| 25 to 34 Years | 56 (100.0%) | 34 (80.9%) |
| 35 to 44 Years | 55 (94.8%) | 55 (100.0%) |
| 45 to 54 Years | 60 (100.0%) | 77 (97.5%) |
| 55 to 64 Years | 110 (90.9%) | 117 (100.0%) |
| 65 to 74 Years | 80 (87.0%) | 34 (79.1%) |
| 75 Years and over | 30 (78.9%) | 64 (95.5%) |
| Total | 573 (91.5%) | 539 (92.9%) |
Income Below Poverty Among Married-Couple Families in Ness City
The poverty statistics for married-couple families in Ness City show that 2.3% or 7 of the total 306 families live below the poverty line. Families with no children have the highest poverty rate of 3.8%, comprising of 7 families. On the other hand, families with 1 or 2 children have the lowest poverty rate of 0.0%, which includes 0 families.
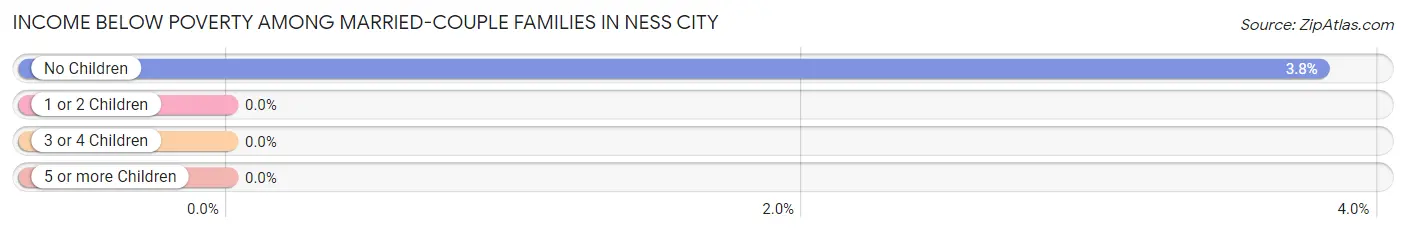
| Children | Above Poverty | Below Poverty |
| No Children | 177 (96.2%) | 7 (3.8%) |
| 1 or 2 Children | 87 (100.0%) | 0 (0.0%) |
| 3 or 4 Children | 35 (100.0%) | 0 (0.0%) |
| 5 or more Children | 0 (0.0%) | 0 (0.0%) |
| Total | 299 (97.7%) | 7 (2.3%) |
Income Below Poverty Among Single-Parent Households in Ness City
According to the poverty data in Ness City, 36.4% or 4 single-father households and 43.8% or 7 single-mother households are living below the poverty line. Among single-father households, those with 1 or 2 children have the highest poverty rate, with 4 households (100.0%) experiencing poverty. Likewise, among single-mother households, those with 1 or 2 children have the highest poverty rate, with 7 households (58.3%) falling below the poverty line.
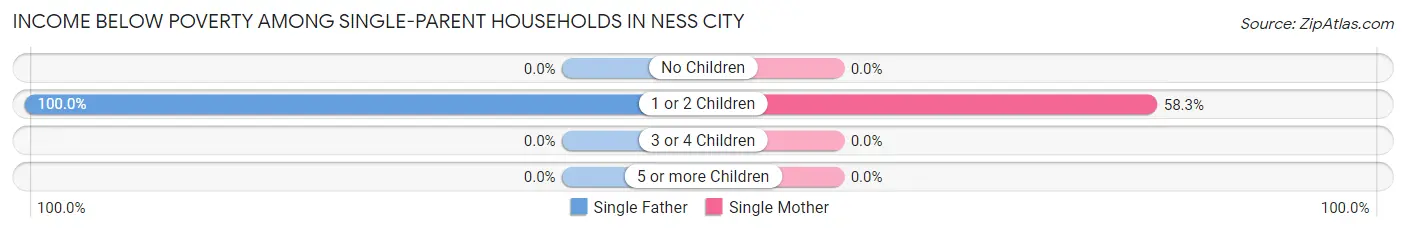
| Children | Single Father | Single Mother |
| No Children | 0 (0.0%) | 0 (0.0%) |
| 1 or 2 Children | 4 (100.0%) | 7 (58.3%) |
| 3 or 4 Children | 0 (0.0%) | 0 (0.0%) |
| 5 or more Children | 0 (0.0%) | 0 (0.0%) |
| Total | 4 (36.4%) | 7 (43.8%) |
Income Below Poverty Among Married-Couple vs Single-Parent Households in Ness City
The poverty data for Ness City shows that 7 of the married-couple family households (2.3%) and 11 of the single-parent households (40.7%) are living below the poverty level. Within the married-couple family households, those with no children have the highest poverty rate, with 7 households (3.8%) falling below the poverty line. Among the single-parent households, those with 1 or 2 children have the highest poverty rate, with 11 household (68.8%) living below poverty.
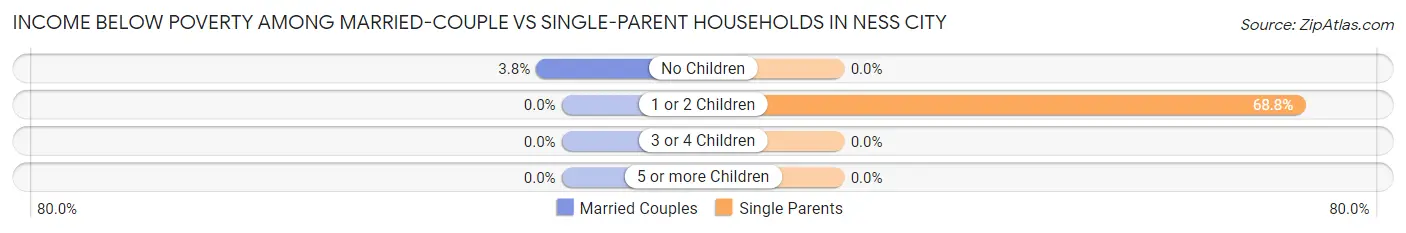
| Children | Married-Couple Families | Single-Parent Households |
| No Children | 7 (3.8%) | 0 (0.0%) |
| 1 or 2 Children | 0 (0.0%) | 11 (68.8%) |
| 3 or 4 Children | 0 (0.0%) | 0 (0.0%) |
| 5 or more Children | 0 (0.0%) | 0 (0.0%) |
| Total | 7 (2.3%) | 11 (40.7%) |
Race in Ness City
The most populous races in Ness City are White / Caucasian (1,073 | 86.3%), Hispanic or Latino (148 | 11.9%), and Some other Race (97 | 7.8%).
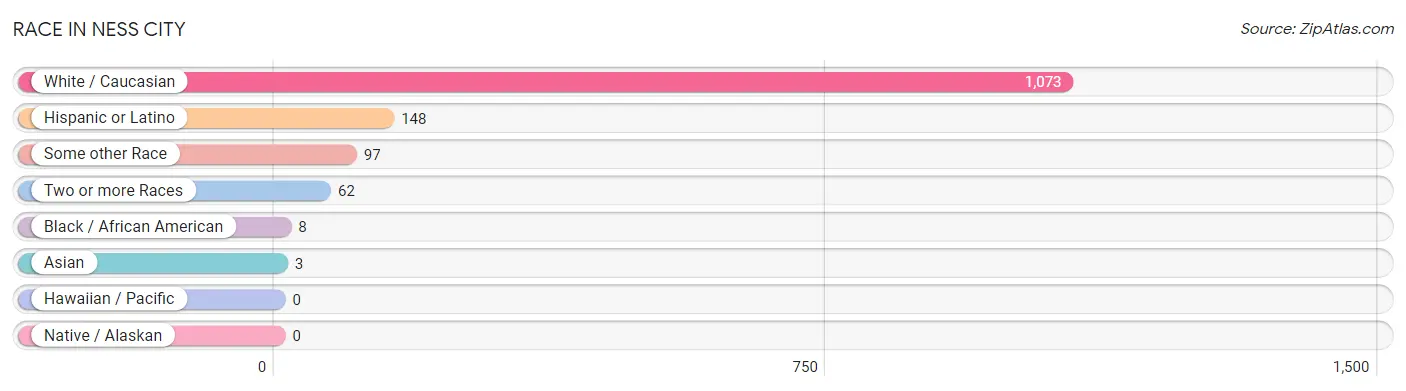
| Race | # Population | % Population |
| Asian | 3 | 0.2% |
| Black / African American | 8 | 0.6% |
| Hawaiian / Pacific | 0 | 0.0% |
| Hispanic or Latino | 148 | 11.9% |
| Native / Alaskan | 0 | 0.0% |
| White / Caucasian | 1,073 | 86.3% |
| Two or more Races | 62 | 5.0% |
| Some other Race | 97 | 7.8% |
| Total | 1,243 | 100.0% |
Ancestry in Ness City
The most populous ancestries reported in Ness City are German (516 | 41.5%), Mexican (148 | 11.9%), Irish (140 | 11.3%), English (100 | 8.1%), and American (74 | 5.9%), together accounting for 78.7% of all Ness City residents.
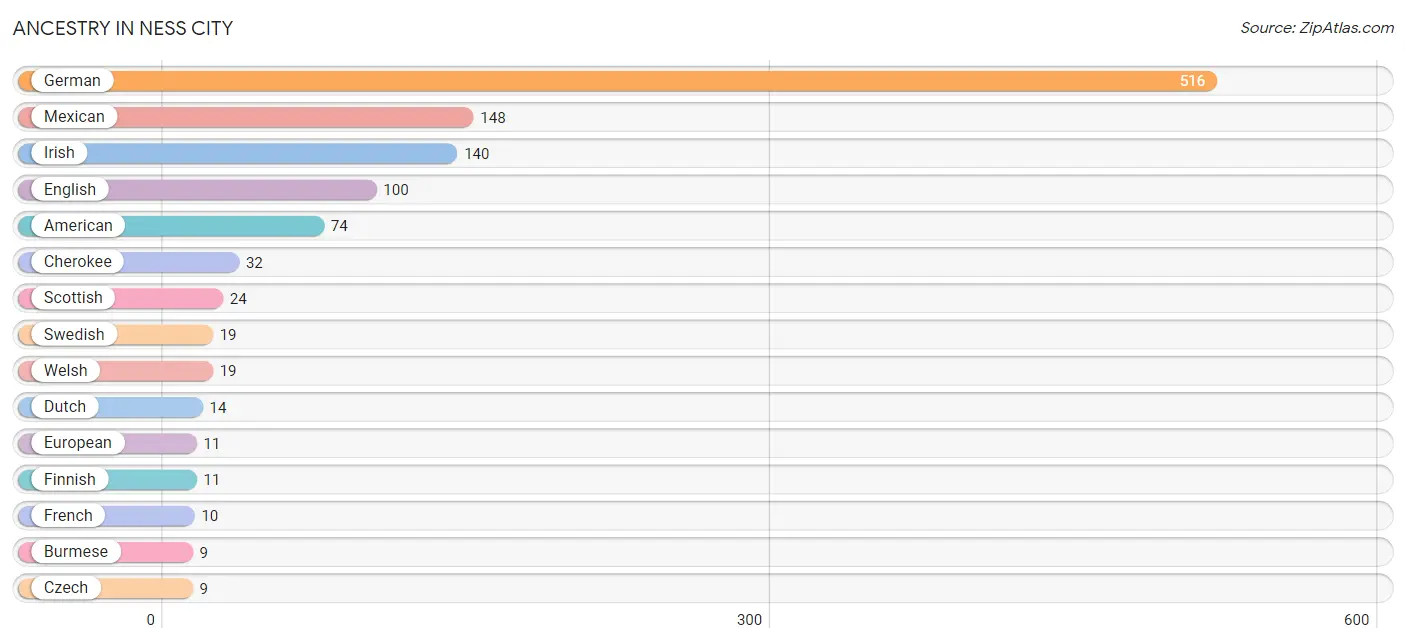
| Ancestry | # Population | % Population |
| American | 74 | 5.9% |
| Apache | 1 | 0.1% |
| Arab | 1 | 0.1% |
| Austrian | 6 | 0.5% |
| British | 3 | 0.2% |
| Burmese | 9 | 0.7% |
| Cherokee | 32 | 2.6% |
| Czech | 9 | 0.7% |
| Danish | 5 | 0.4% |
| Dutch | 14 | 1.1% |
| English | 100 | 8.1% |
| European | 11 | 0.9% |
| Finnish | 11 | 0.9% |
| French | 10 | 0.8% |
| French Canadian | 2 | 0.2% |
| German | 516 | 41.5% |
| Irish | 140 | 11.3% |
| Italian | 4 | 0.3% |
| Mexican | 148 | 11.9% |
| Osage | 4 | 0.3% |
| Russian | 3 | 0.2% |
| Scandinavian | 6 | 0.5% |
| Scotch-Irish | 9 | 0.7% |
| Scottish | 24 | 1.9% |
| South African | 6 | 0.5% |
| Subsaharan African | 6 | 0.5% |
| Swedish | 19 | 1.5% |
| Swiss | 5 | 0.4% |
| Welsh | 19 | 1.5% | View All 29 Rows |
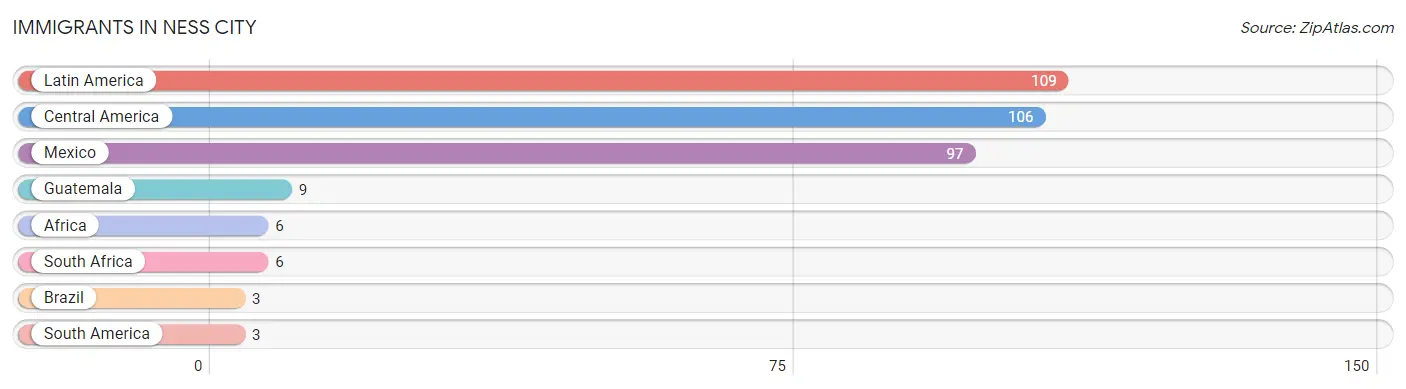
Immigrants in Ness City
The most numerous immigrant groups reported in Ness City came from Latin America (109 | 8.8%), Central America (106 | 8.5%), Mexico (97 | 7.8%), Guatemala (9 | 0.7%), and Africa (6 | 0.5%), together accounting for 26.3% of all Ness City residents.
| Immigration Origin | # Population | % Population |
| Africa | 6 | 0.5% |
| Brazil | 3 | 0.2% |
| Central America | 106 | 8.5% |
| Guatemala | 9 | 0.7% |
| Latin America | 109 | 8.8% |
| Mexico | 97 | 7.8% |
| South Africa | 6 | 0.5% |
| South America | 3 | 0.2% | View All 8 Rows |
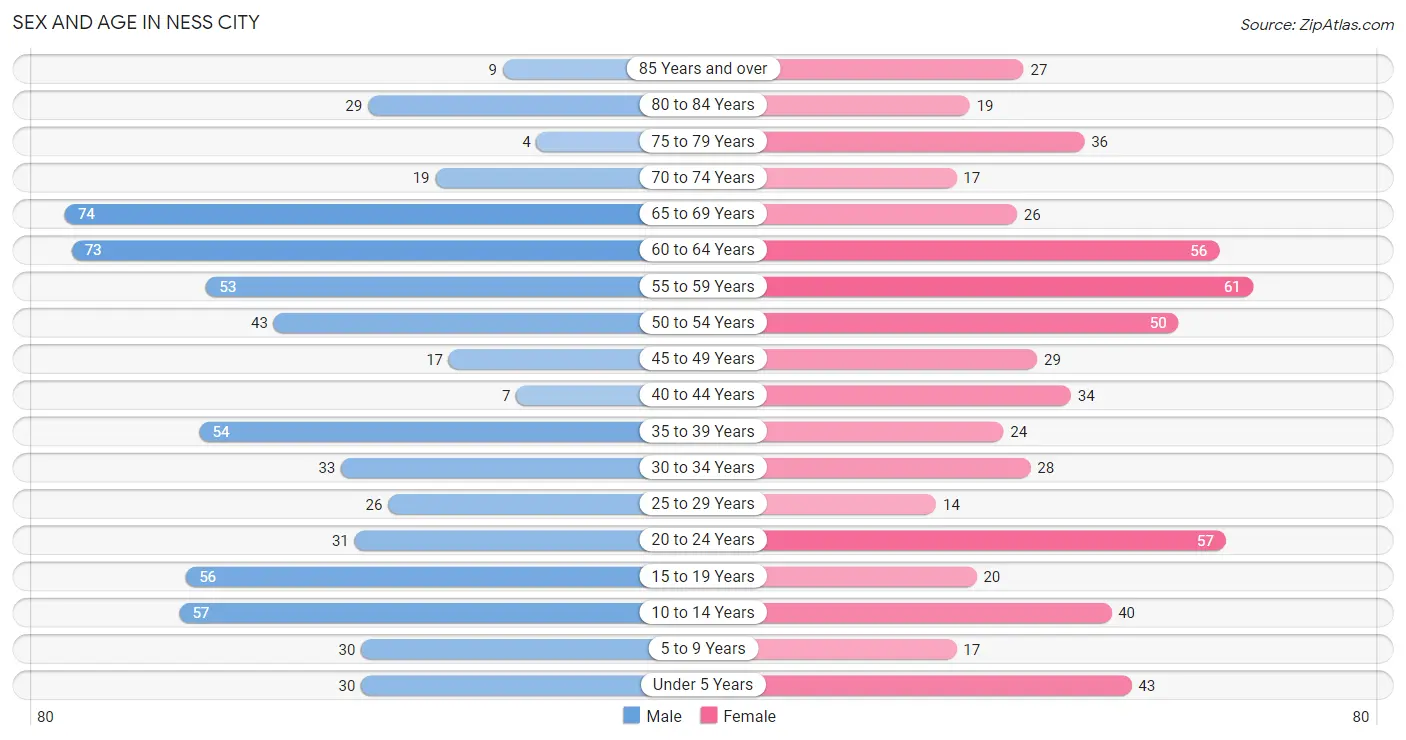
Sex and Age in Ness City
Sex and Age in Ness City
The most populous age groups in Ness City are 65 to 69 Years (74 | 11.5%) for men and 55 to 59 Years (61 | 10.2%) for women.
| Age Bracket | Male | Female |
| Under 5 Years | 30 (4.6%) | 43 (7.2%) |
| 5 to 9 Years | 30 (4.6%) | 17 (2.8%) |
| 10 to 14 Years | 57 (8.8%) | 40 (6.7%) |
| 15 to 19 Years | 56 (8.7%) | 20 (3.3%) |
| 20 to 24 Years | 31 (4.8%) | 57 (9.5%) |
| 25 to 29 Years | 26 (4.0%) | 14 (2.3%) |
| 30 to 34 Years | 33 (5.1%) | 28 (4.7%) |
| 35 to 39 Years | 54 (8.4%) | 24 (4.0%) |
| 40 to 44 Years | 7 (1.1%) | 34 (5.7%) |
| 45 to 49 Years | 17 (2.6%) | 29 (4.9%) |
| 50 to 54 Years | 43 (6.7%) | 50 (8.4%) |
| 55 to 59 Years | 53 (8.2%) | 61 (10.2%) |
| 60 to 64 Years | 73 (11.3%) | 56 (9.4%) |
| 65 to 69 Years | 74 (11.5%) | 26 (4.3%) |
| 70 to 74 Years | 19 (2.9%) | 17 (2.8%) |
| 75 to 79 Years | 4 (0.6%) | 36 (6.0%) |
| 80 to 84 Years | 29 (4.5%) | 19 (3.2%) |
| 85 Years and over | 9 (1.4%) | 27 (4.5%) |
| Total | 645 (100.0%) | 598 (100.0%) |
Families and Households in Ness City
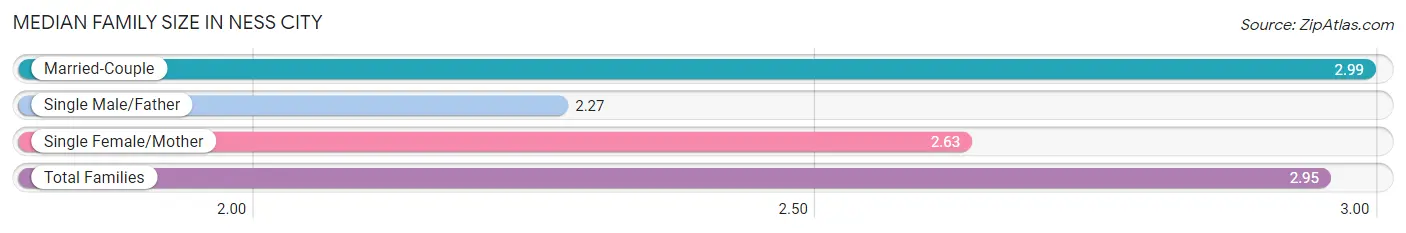
Median Family Size in Ness City
The median family size in Ness City is 2.95 persons per family, with married-couple families (306 | 91.9%) accounting for the largest median family size of 2.99 persons per family. On the other hand, single male/father families (11 | 3.3%) represent the smallest median family size with 2.27 persons per family.
| Family Type | # Families | Family Size |
| Married-Couple | 306 (91.9%) | 2.99 |
| Single Male/Father | 11 (3.3%) | 2.27 |
| Single Female/Mother | 16 (4.8%) | 2.63 |
| Total Families | 333 (100.0%) | 2.95 |
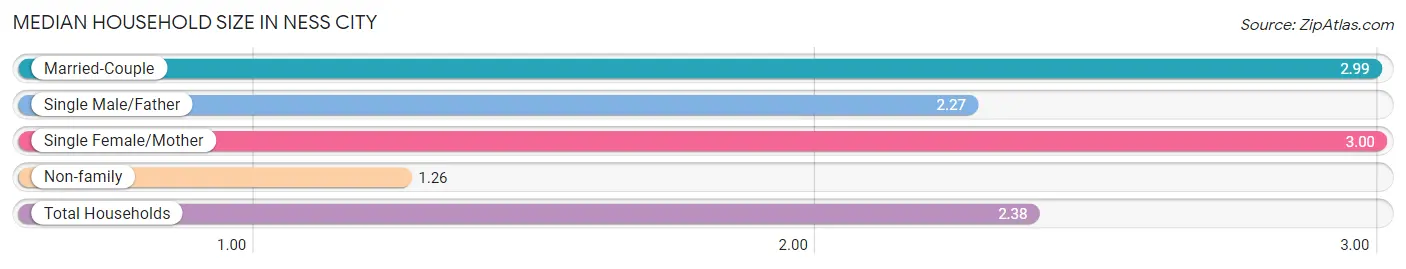
Median Household Size in Ness City
The median household size in Ness City is 2.38 persons per household, with single female/mother households (16 | 3.2%) accounting for the largest median household size of 3 persons per household. non-family households (175 | 34.4%) represent the smallest median household size with 1.26 persons per household.
| Household Type | # Households | Household Size |
| Married-Couple | 306 (60.2%) | 2.99 |
| Single Male/Father | 11 (2.2%) | 2.27 |
| Single Female/Mother | 16 (3.2%) | 3.00 |
| Non-family | 175 (34.4%) | 1.26 |
| Total Households | 508 (100.0%) | 2.38 |
Household Size by Marriage Status in Ness City
Out of a total of 508 households in Ness City, 333 (65.5%) are family households, while 175 (34.4%) are nonfamily households. The most numerous type of family households are 2-person households, comprising 192, and the most common type of nonfamily households are 1-person households, comprising 136.
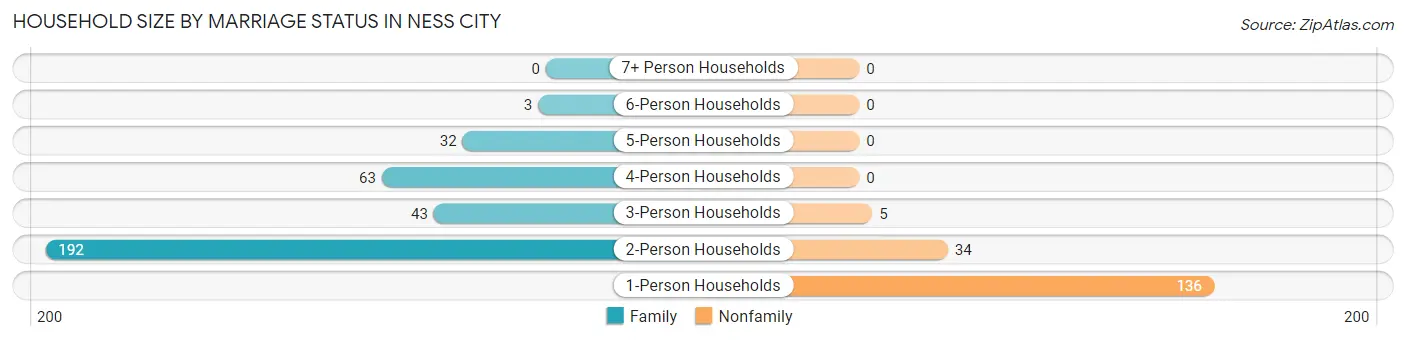
| Household Size | Family Households | Nonfamily Households |
| 1-Person Households | - | 136 (26.8%) |
| 2-Person Households | 192 (37.8%) | 34 (6.7%) |
| 3-Person Households | 43 (8.5%) | 5 (1.0%) |
| 4-Person Households | 63 (12.4%) | 0 (0.0%) |
| 5-Person Households | 32 (6.3%) | 0 (0.0%) |
| 6-Person Households | 3 (0.6%) | 0 (0.0%) |
| 7+ Person Households | 0 (0.0%) | 0 (0.0%) |
| Total | 333 (65.5%) | 175 (34.4%) |
Female Fertility in Ness City
Fertility by Age in Ness City
Average fertility rate in Ness City is 162.0 births per 1,000 women. Women in the age bracket of 20 to 34 years have the highest fertility rate with 343.0 births per 1,000 women. Women in the age bracket of 20 to 34 years acount for 100.0% of all women with births.
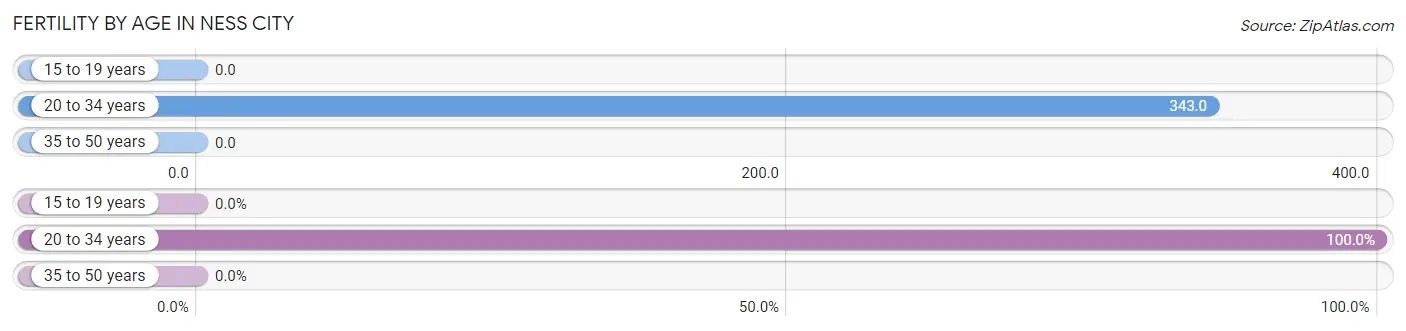
| Age Bracket | Women with Births | Births / 1,000 Women |
| 15 to 19 years | 0 (0.0%) | 0.0 |
| 20 to 34 years | 34 (100.0%) | 343.0 |
| 35 to 50 years | 0 (0.0%) | 0.0 |
| Total | 34 (100.0%) | 162.0 |
Fertility by Age by Marriage Status in Ness City
85.3% of women with births (34) in Ness City are married. The highest percentage of unmarried women with births falls into 20 to 34 years age bracket with 14.7% of them unmarried at the time of birth, while the lowest percentage of unmarried women with births belong to 20 to 34 years age bracket with 14.7% of them unmarried.
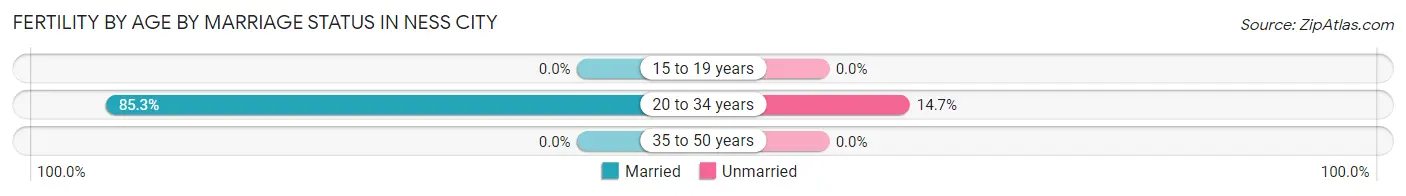
| Age Bracket | Married | Unmarried |
| 15 to 19 years | 0 (0.0%) | 0 (0.0%) |
| 20 to 34 years | 29 (85.3%) | 5 (14.7%) |
| 35 to 50 years | 0 (0.0%) | 0 (0.0%) |
| Total | 29 (85.3%) | 5 (14.7%) |
Fertility by Education in Ness City
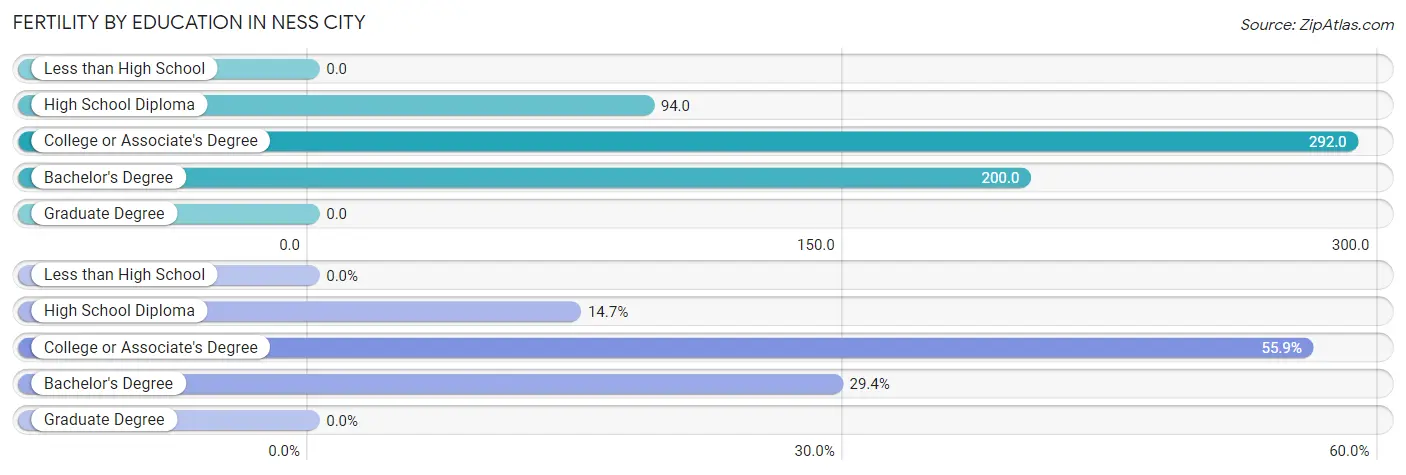
| Educational Attainment | Women with Births | Births / 1,000 Women |
| Less than High School | 0 (0.0%) | 0.0 |
| High School Diploma | 5 (14.7%) | 94.0 |
| College or Associate's Degree | 19 (55.9%) | 292.0 |
| Bachelor's Degree | 10 (29.4%) | 200.0 |
| Graduate Degree | 0 (0.0%) | 0.0 |
| Total | 34 (100.0%) | 162.0 |
Fertility by Education by Marriage Status in Ness City
14.7% of women with births in Ness City are unmarried. Women with the educational attainment of college or associate's degree are most likely to be married with 100.0% of them married at childbirth, while women with the educational attainment of high school diploma are least likely to be married with 100.0% of them unmarried at childbirth.
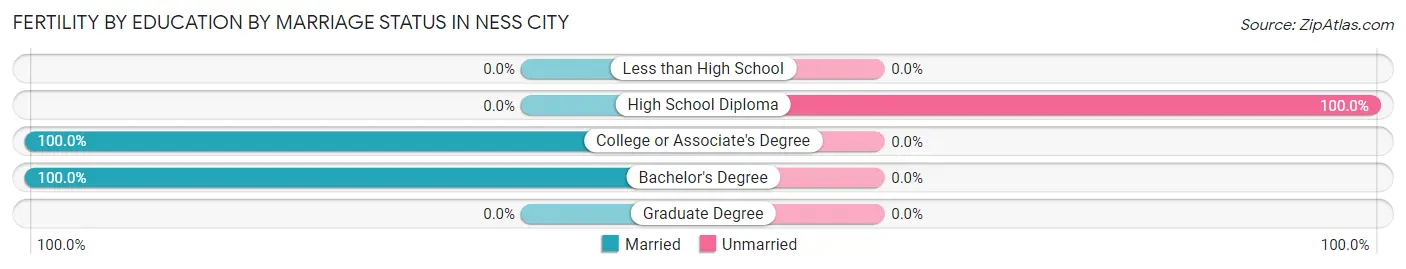
| Educational Attainment | Married | Unmarried |
| Less than High School | 0 (0.0%) | 0 (0.0%) |
| High School Diploma | 0 (0.0%) | 5 (100.0%) |
| College or Associate's Degree | 19 (100.0%) | 0 (0.0%) |
| Bachelor's Degree | 10 (100.0%) | 0 (0.0%) |
| Graduate Degree | 0 (0.0%) | 0 (0.0%) |
| Total | 29 (85.3%) | 5 (14.7%) |
Employment Characteristics in Ness City
Employment by Class of Employer in Ness City
Among the 673 employed individuals in Ness City, private company employees (391 | 58.1%), self-employed (not incorporated) (107 | 15.9%), and local government employees (82 | 12.2%) make up the most common classes of employment.
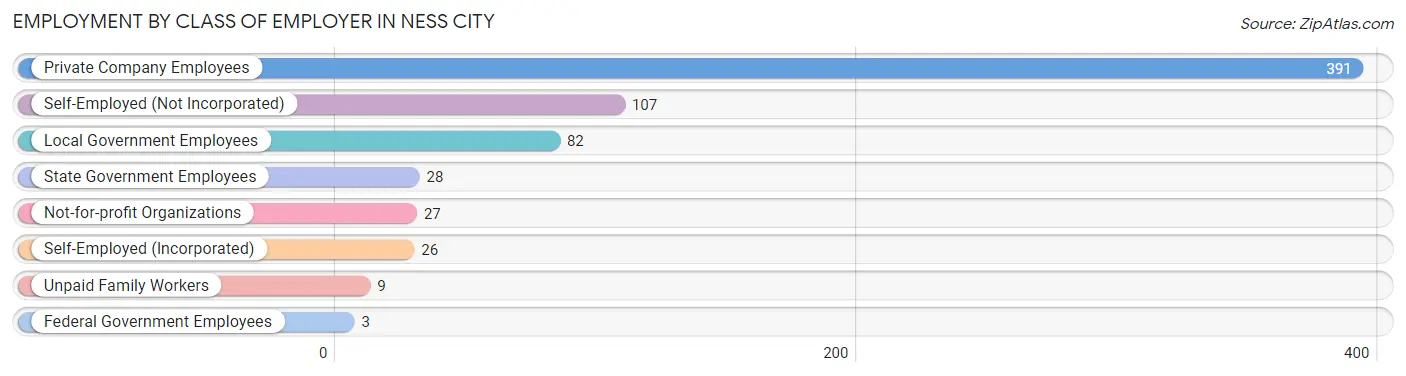
| Employer Class | # Employees | % Employees |
| Private Company Employees | 391 | 58.1% |
| Self-Employed (Incorporated) | 26 | 3.9% |
| Self-Employed (Not Incorporated) | 107 | 15.9% |
| Not-for-profit Organizations | 27 | 4.0% |
| Local Government Employees | 82 | 12.2% |
| State Government Employees | 28 | 4.2% |
| Federal Government Employees | 3 | 0.4% |
| Unpaid Family Workers | 9 | 1.3% |
| Total | 673 | 100.0% |
Employment Status by Age in Ness City
According to the labor force statistics for Ness City, out of the total population over 16 years of age (1,012), 68.3% or 691 individuals are in the labor force, with 0.4% or 3 of them unemployed. The age group with the highest labor force participation rate is 25 to 29 years, with 97.5% or 39 individuals in the labor force. Within the labor force, the 60 to 64 years age range has the highest percentage of unemployed individuals, with 2.6% or 2 of them being unemployed.
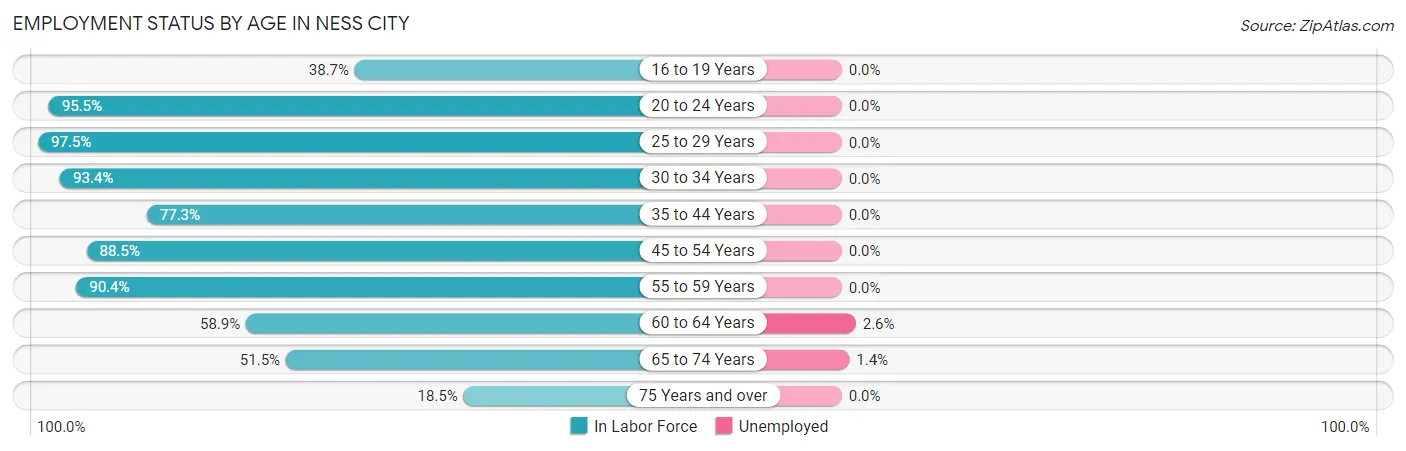
| Age Bracket | In Labor Force | Unemployed |
| 16 to 19 Years | 24 (38.7%) | 0 (0.0%) |
| 20 to 24 Years | 84 (95.5%) | 0 (0.0%) |
| 25 to 29 Years | 39 (97.5%) | 0 (0.0%) |
| 30 to 34 Years | 57 (93.4%) | 0 (0.0%) |
| 35 to 44 Years | 92 (77.3%) | 0 (0.0%) |
| 45 to 54 Years | 123 (88.5%) | 0 (0.0%) |
| 55 to 59 Years | 103 (90.4%) | 0 (0.0%) |
| 60 to 64 Years | 76 (58.9%) | 2 (2.6%) |
| 65 to 74 Years | 70 (51.5%) | 1 (1.4%) |
| 75 Years and over | 23 (18.5%) | 0 (0.0%) |
| Total | 691 (68.3%) | 3 (0.4%) |
Employment Status by Educational Attainment in Ness City
According to labor force statistics for Ness City, 81.4% of individuals (490) out of the total population between 25 and 64 years of age (602) are in the labor force, with 0.4% or 2 of them being unemployed. The group with the highest labor force participation rate are those with the educational attainment of bachelor's degree or higher, with 92.8% or 141 individuals in the labor force. Within the labor force, individuals with high school diploma education have the highest percentage of unemployment, with 1.4% or 2 of them being unemployed.
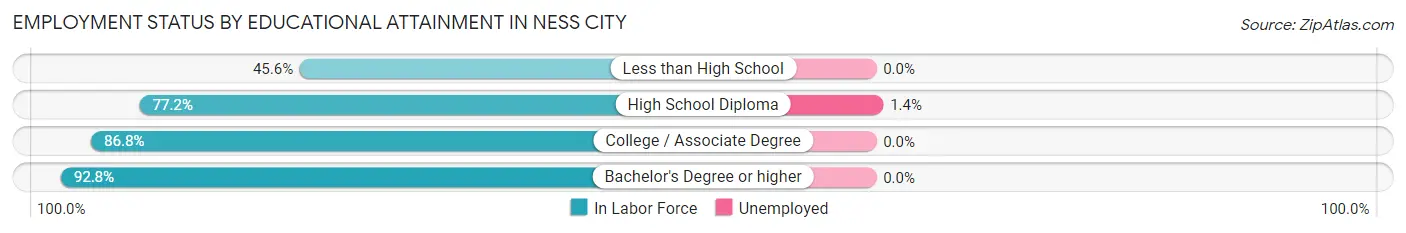
| Educational Attainment | In Labor Force | Unemployed |
| Less than High School | 26 (45.6%) | 0 (0.0%) |
| High School Diploma | 146 (77.2%) | 3 (1.4%) |
| College / Associate Degree | 177 (86.8%) | 0 (0.0%) |
| Bachelor's Degree or higher | 141 (92.8%) | 0 (0.0%) |
| Total | 490 (81.4%) | 2 (0.4%) |
Employment Occupations by Sex in Ness City
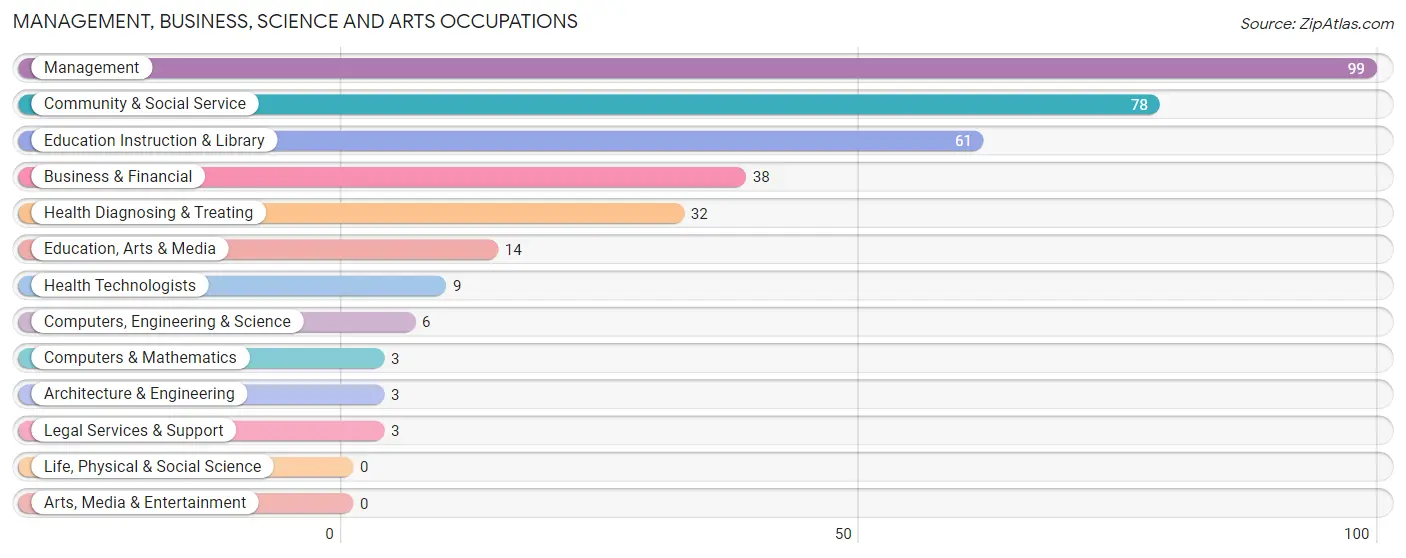
Management, Business, Science and Arts Occupations
The most common Management, Business, Science and Arts occupations in Ness City are Management (99 | 14.4%), Community & Social Service (78 | 11.3%), Education Instruction & Library (61 | 8.9%), Business & Financial (38 | 5.5%), and Health Diagnosing & Treating (32 | 4.6%).
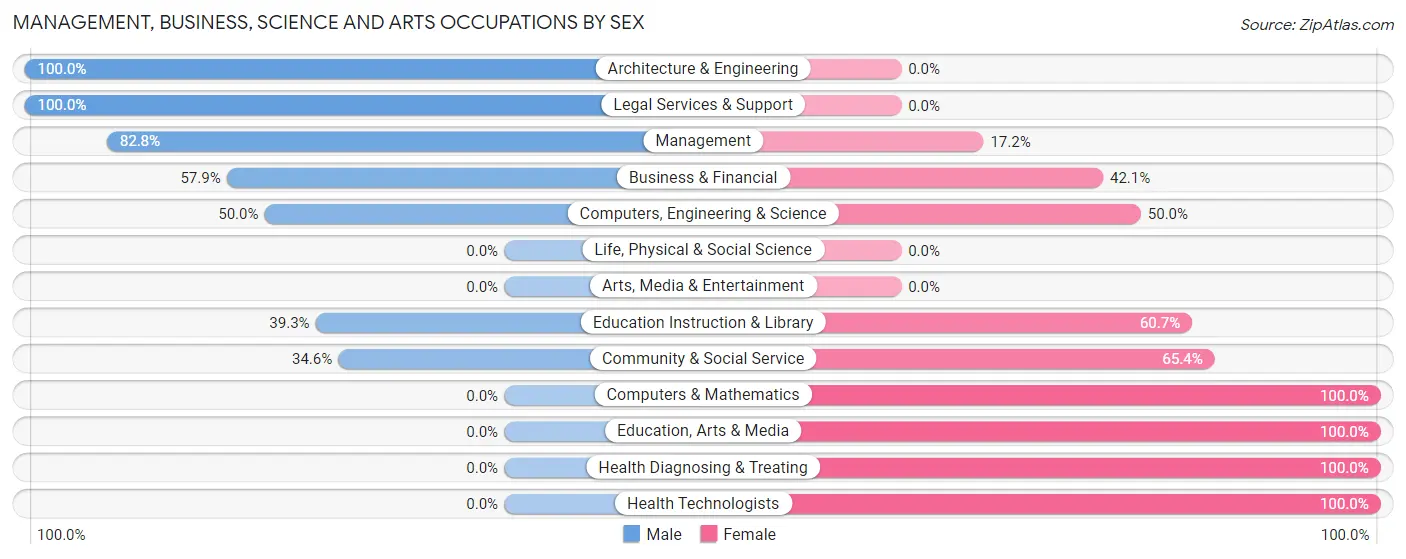
Management, Business, Science and Arts Occupations by Sex
Within the Management, Business, Science and Arts occupations in Ness City, the most male-oriented occupations are Architecture & Engineering (100.0%), Legal Services & Support (100.0%), and Management (82.8%), while the most female-oriented occupations are Computers & Mathematics (100.0%), Education, Arts & Media (100.0%), and Health Diagnosing & Treating (100.0%).
| Occupation | Male | Female |
| Management | 82 (82.8%) | 17 (17.2%) |
| Business & Financial | 22 (57.9%) | 16 (42.1%) |
| Computers, Engineering & Science | 3 (50.0%) | 3 (50.0%) |
| Computers & Mathematics | 0 (0.0%) | 3 (100.0%) |
| Architecture & Engineering | 3 (100.0%) | 0 (0.0%) |
| Life, Physical & Social Science | 0 (0.0%) | 0 (0.0%) |
| Community & Social Service | 27 (34.6%) | 51 (65.4%) |
| Education, Arts & Media | 0 (0.0%) | 14 (100.0%) |
| Legal Services & Support | 3 (100.0%) | 0 (0.0%) |
| Education Instruction & Library | 24 (39.3%) | 37 (60.7%) |
| Arts, Media & Entertainment | 0 (0.0%) | 0 (0.0%) |
| Health Diagnosing & Treating | 0 (0.0%) | 32 (100.0%) |
| Health Technologists | 0 (0.0%) | 9 (100.0%) |
| Total (Category) | 134 (53.0%) | 119 (47.0%) |
| Total (Overall) | 369 (53.6%) | 319 (46.4%) |
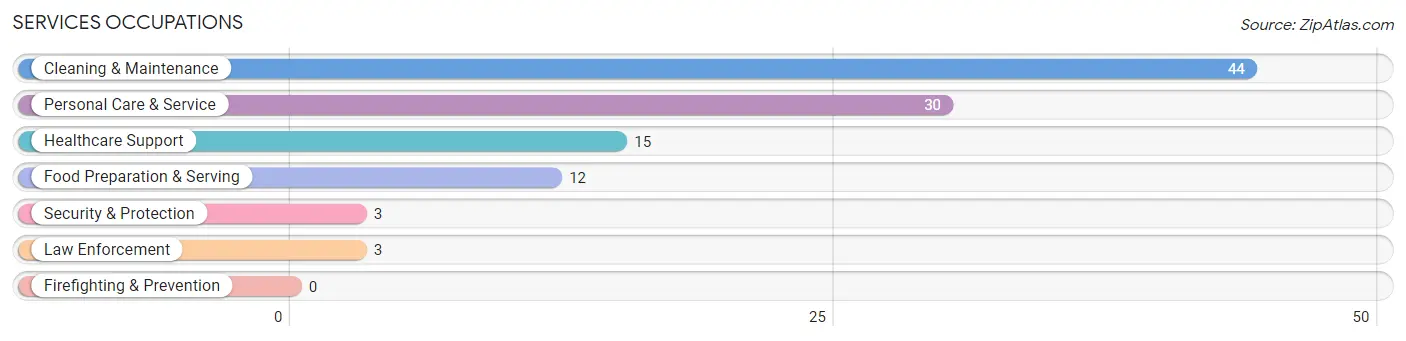
Services Occupations
The most common Services occupations in Ness City are Cleaning & Maintenance (44 | 6.4%), Personal Care & Service (30 | 4.4%), Healthcare Support (15 | 2.2%), Food Preparation & Serving (12 | 1.7%), and Security & Protection (3 | 0.4%).
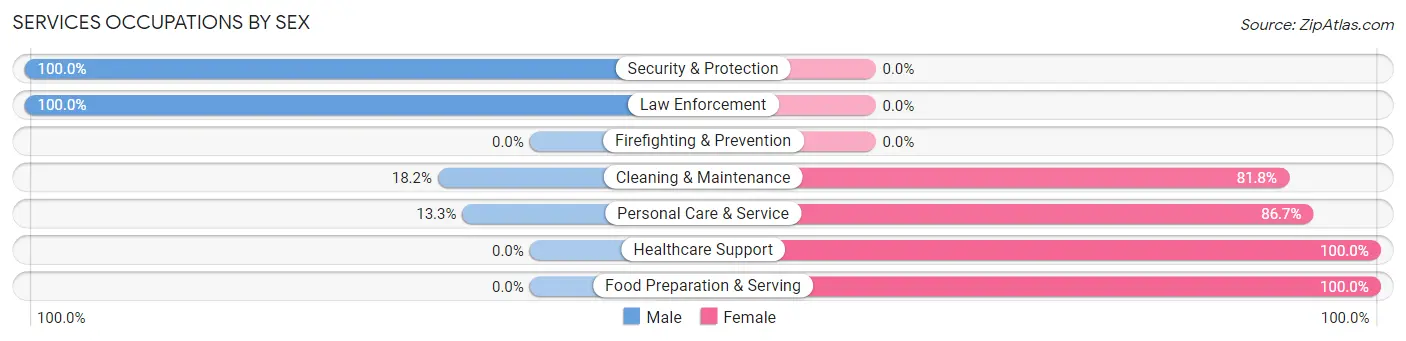
Services Occupations by Sex
Within the Services occupations in Ness City, the most male-oriented occupations are Security & Protection (100.0%), Law Enforcement (100.0%), and Cleaning & Maintenance (18.2%), while the most female-oriented occupations are Healthcare Support (100.0%), Food Preparation & Serving (100.0%), and Personal Care & Service (86.7%).
| Occupation | Male | Female |
| Healthcare Support | 0 (0.0%) | 15 (100.0%) |
| Security & Protection | 3 (100.0%) | 0 (0.0%) |
| Firefighting & Prevention | 0 (0.0%) | 0 (0.0%) |
| Law Enforcement | 3 (100.0%) | 0 (0.0%) |
| Food Preparation & Serving | 0 (0.0%) | 12 (100.0%) |
| Cleaning & Maintenance | 8 (18.2%) | 36 (81.8%) |
| Personal Care & Service | 4 (13.3%) | 26 (86.7%) |
| Total (Category) | 15 (14.4%) | 89 (85.6%) |
| Total (Overall) | 369 (53.6%) | 319 (46.4%) |
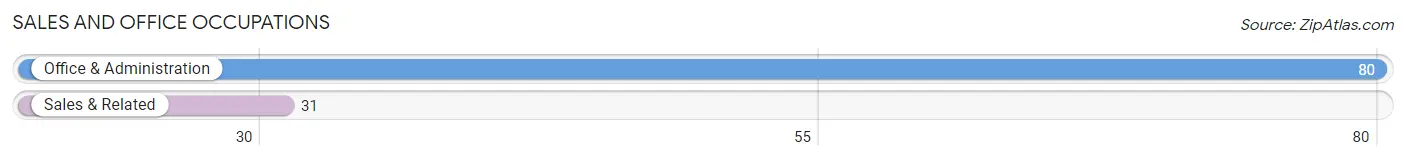
Sales and Office Occupations
The most common Sales and Office occupations in Ness City are Office & Administration (80 | 11.6%), and Sales & Related (31 | 4.5%).
Sales and Office Occupations by Sex
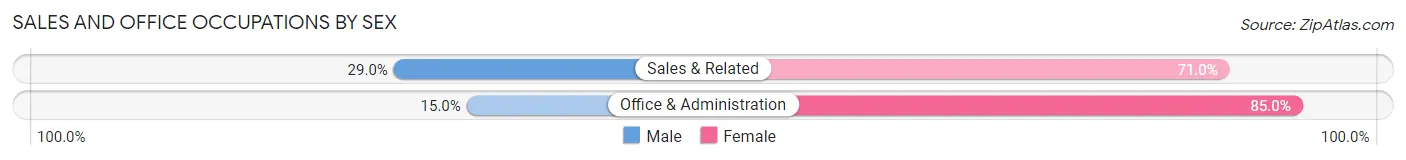
| Occupation | Male | Female |
| Sales & Related | 9 (29.0%) | 22 (71.0%) |
| Office & Administration | 12 (15.0%) | 68 (85.0%) |
| Total (Category) | 21 (18.9%) | 90 (81.1%) |
| Total (Overall) | 369 (53.6%) | 319 (46.4%) |
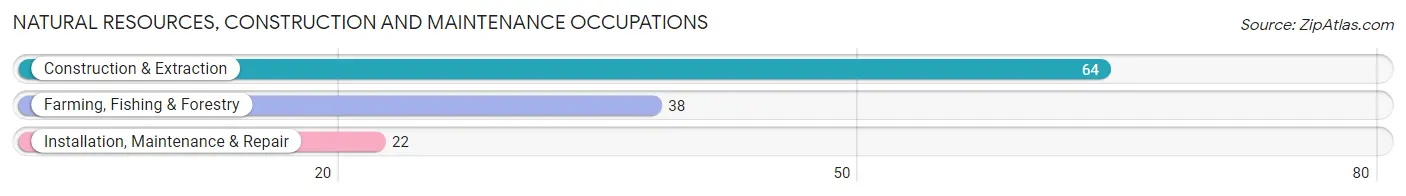
Natural Resources, Construction and Maintenance Occupations
The most common Natural Resources, Construction and Maintenance occupations in Ness City are Construction & Extraction (64 | 9.3%), Farming, Fishing & Forestry (38 | 5.5%), and Installation, Maintenance & Repair (22 | 3.2%).
Natural Resources, Construction and Maintenance Occupations by Sex
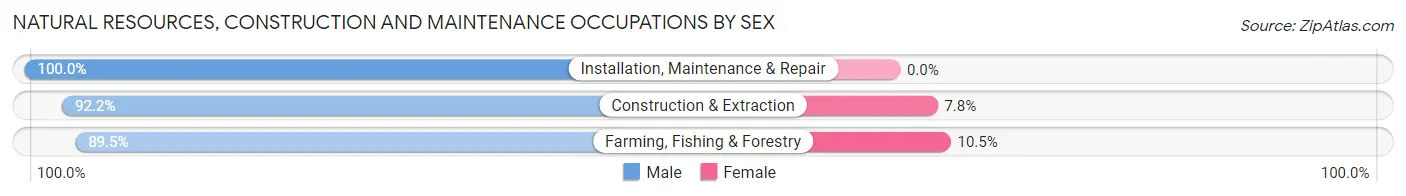
| Occupation | Male | Female |
| Farming, Fishing & Forestry | 34 (89.5%) | 4 (10.5%) |
| Construction & Extraction | 59 (92.2%) | 5 (7.8%) |
| Installation, Maintenance & Repair | 22 (100.0%) | 0 (0.0%) |
| Total (Category) | 115 (92.7%) | 9 (7.3%) |
| Total (Overall) | 369 (53.6%) | 319 (46.4%) |
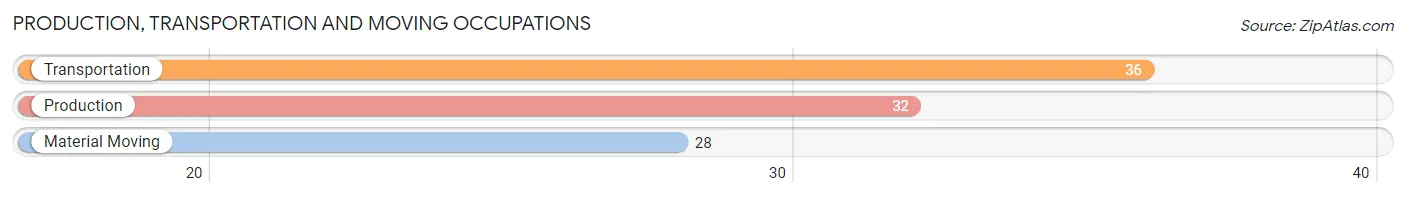
Production, Transportation and Moving Occupations
The most common Production, Transportation and Moving occupations in Ness City are Transportation (36 | 5.2%), Production (32 | 4.6%), and Material Moving (28 | 4.1%).
Production, Transportation and Moving Occupations by Sex
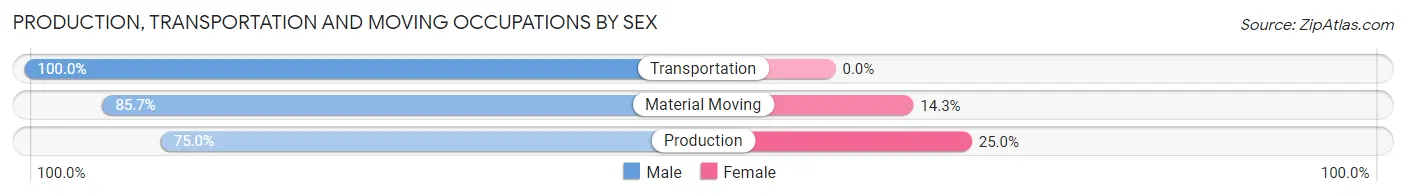
| Occupation | Male | Female |
| Production | 24 (75.0%) | 8 (25.0%) |
| Transportation | 36 (100.0%) | 0 (0.0%) |
| Material Moving | 24 (85.7%) | 4 (14.3%) |
| Total (Category) | 84 (87.5%) | 12 (12.5%) |
| Total (Overall) | 369 (53.6%) | 319 (46.4%) |
Employment Industries by Sex in Ness City
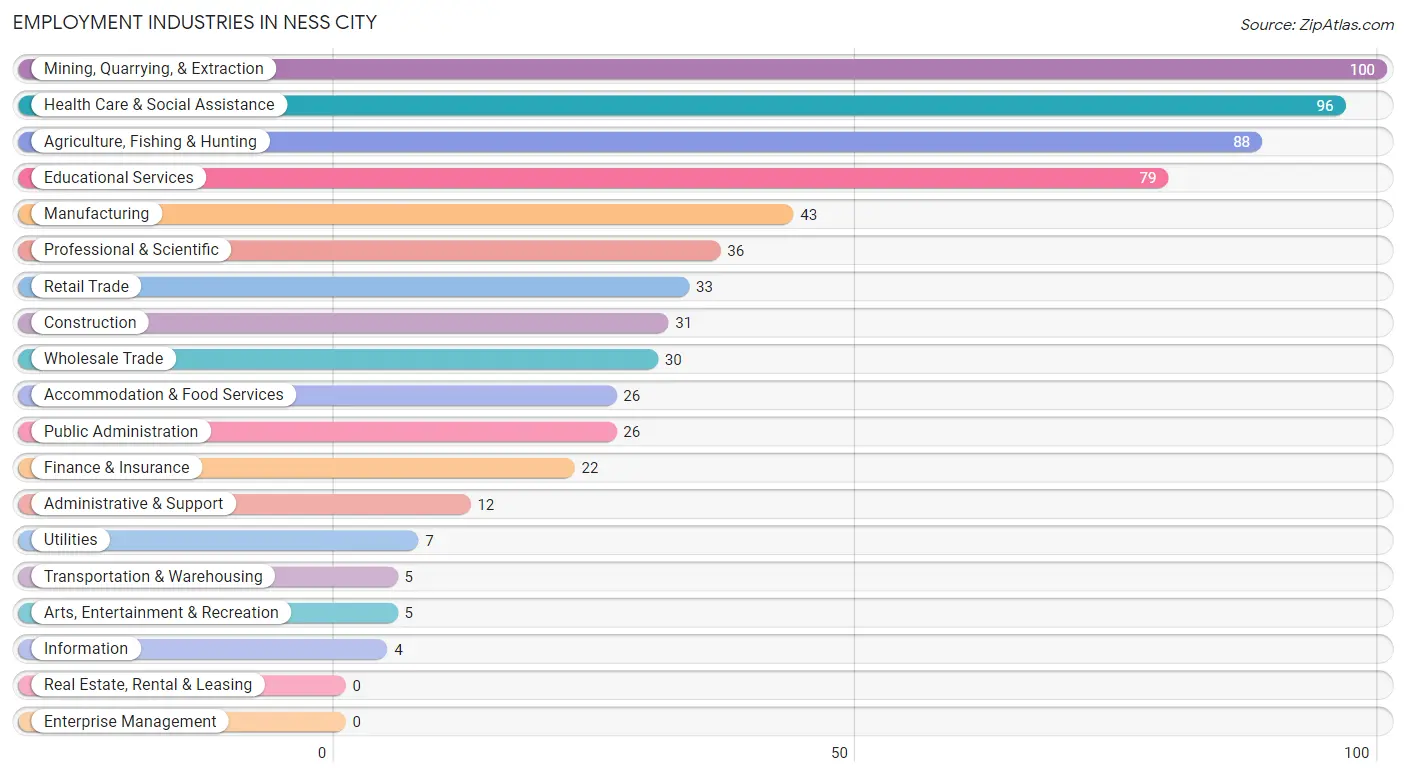
Employment Industries in Ness City
The major employment industries in Ness City include Mining, Quarrying, & Extraction (100 | 14.5%), Health Care & Social Assistance (96 | 14.0%), Agriculture, Fishing & Hunting (88 | 12.8%), Educational Services (79 | 11.5%), and Manufacturing (43 | 6.2%).
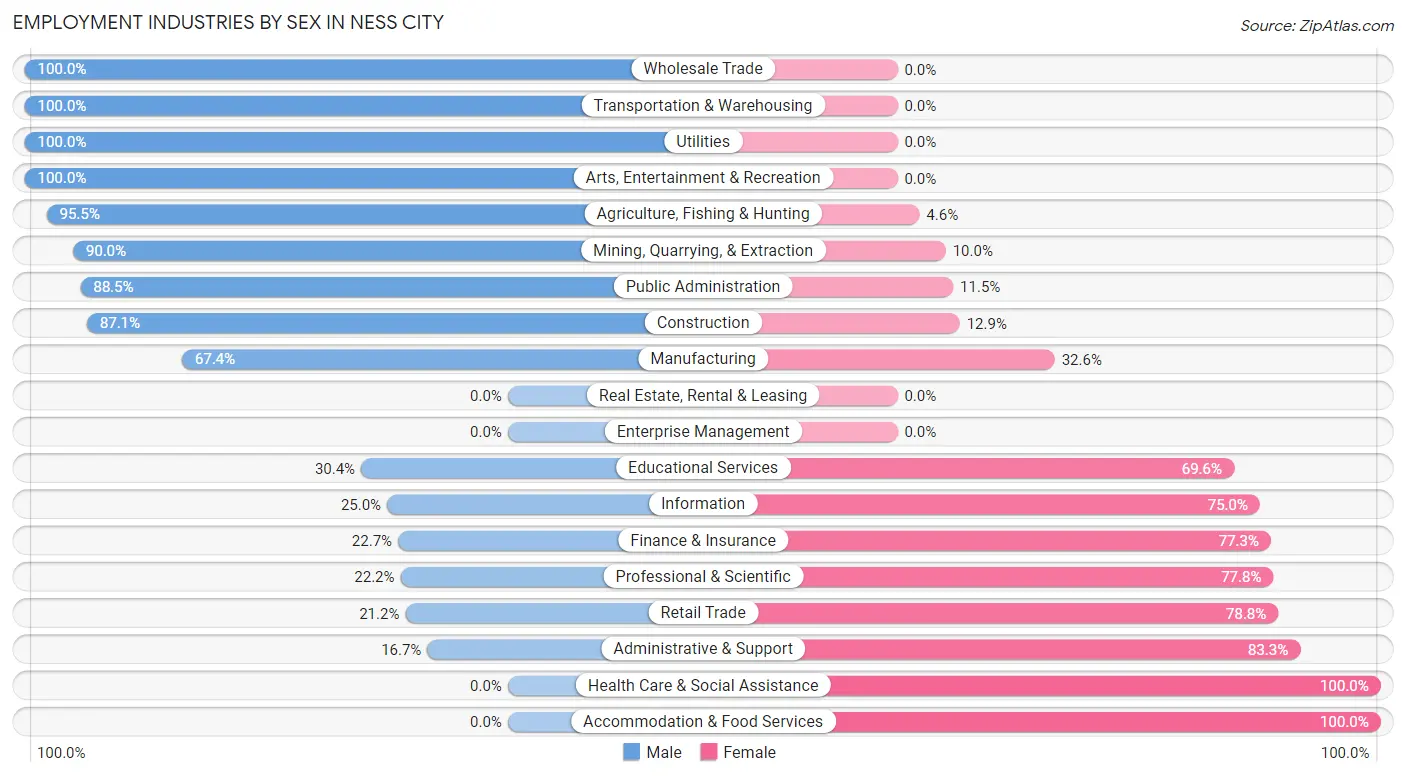
Employment Industries by Sex in Ness City
The Ness City industries that see more men than women are Wholesale Trade (100.0%), Transportation & Warehousing (100.0%), and Utilities (100.0%), whereas the industries that tend to have a higher number of women are Health Care & Social Assistance (100.0%), Accommodation & Food Services (100.0%), and Administrative & Support (83.3%).
| Industry | Male | Female |
| Agriculture, Fishing & Hunting | 84 (95.5%) | 4 (4.5%) |
| Mining, Quarrying, & Extraction | 90 (90.0%) | 10 (10.0%) |
| Construction | 27 (87.1%) | 4 (12.9%) |
| Manufacturing | 29 (67.4%) | 14 (32.6%) |
| Wholesale Trade | 30 (100.0%) | 0 (0.0%) |
| Retail Trade | 7 (21.2%) | 26 (78.8%) |
| Transportation & Warehousing | 5 (100.0%) | 0 (0.0%) |
| Utilities | 7 (100.0%) | 0 (0.0%) |
| Information | 1 (25.0%) | 3 (75.0%) |
| Finance & Insurance | 5 (22.7%) | 17 (77.3%) |
| Real Estate, Rental & Leasing | 0 (0.0%) | 0 (0.0%) |
| Professional & Scientific | 8 (22.2%) | 28 (77.8%) |
| Enterprise Management | 0 (0.0%) | 0 (0.0%) |
| Administrative & Support | 2 (16.7%) | 10 (83.3%) |
| Educational Services | 24 (30.4%) | 55 (69.6%) |
| Health Care & Social Assistance | 0 (0.0%) | 96 (100.0%) |
| Arts, Entertainment & Recreation | 5 (100.0%) | 0 (0.0%) |
| Accommodation & Food Services | 0 (0.0%) | 26 (100.0%) |
| Public Administration | 23 (88.5%) | 3 (11.5%) |
| Total | 369 (53.6%) | 319 (46.4%) |
Education in Ness City
School Enrollment in Ness City
The most common levels of schooling among the 286 students in Ness City are middle school (100 | 35.0%), high school (66 | 23.1%), and college / undergraduate (44 | 15.4%).
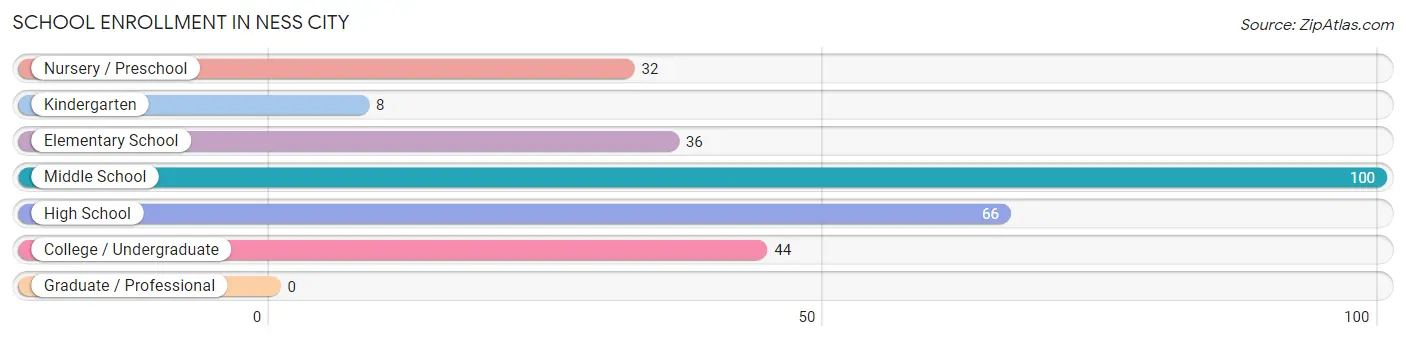
| School Level | # Students | % Students |
| Nursery / Preschool | 32 | 11.2% |
| Kindergarten | 8 | 2.8% |
| Elementary School | 36 | 12.6% |
| Middle School | 100 | 35.0% |
| High School | 66 | 23.1% |
| College / Undergraduate | 44 | 15.4% |
| Graduate / Professional | 0 | 0.0% |
| Total | 286 | 100.0% |
School Enrollment by Age by Funding Source in Ness City
Out of a total of 286 students who are enrolled in schools in Ness City, 45 (15.7%) attend a private institution, while the remaining 241 (84.3%) are enrolled in public schools. The age group of 10 to 14 year olds has the highest likelihood of being enrolled in private schools, with 33 (34.0% in the age bracket) enrolled. Conversely, the age group of 3 to 4 year olds has the lowest likelihood of being enrolled in a private school, with 26 (100.0% in the age bracket) attending a public institution.
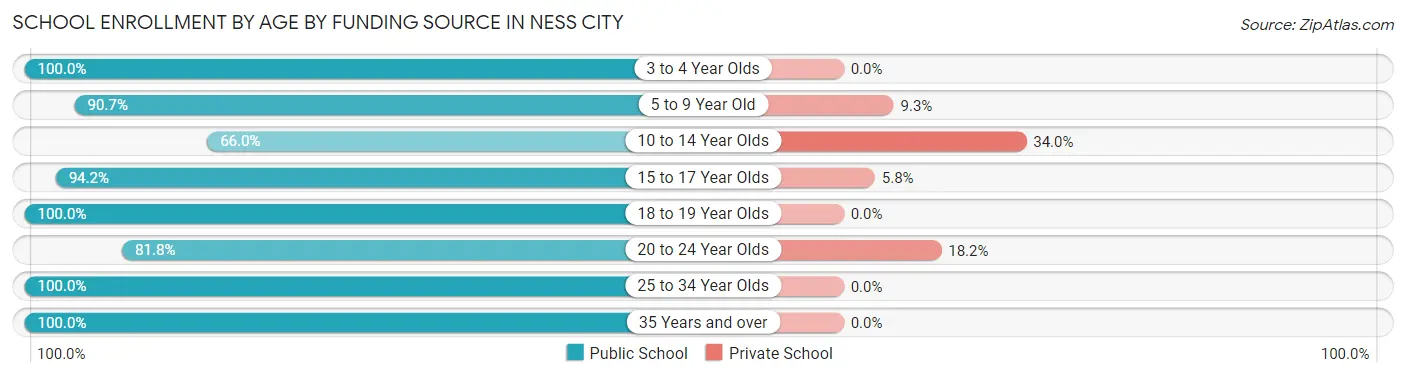
| Age Bracket | Public School | Private School |
| 3 to 4 Year Olds | 26 (100.0%) | 0 (0.0%) |
| 5 to 9 Year Old | 39 (90.7%) | 4 (9.3%) |
| 10 to 14 Year Olds | 64 (66.0%) | 33 (34.0%) |
| 15 to 17 Year Olds | 65 (94.2%) | 4 (5.8%) |
| 18 to 19 Year Olds | 7 (100.0%) | 0 (0.0%) |
| 20 to 24 Year Olds | 18 (81.8%) | 4 (18.2%) |
| 25 to 34 Year Olds | 6 (100.0%) | 0 (0.0%) |
| 35 Years and over | 16 (100.0%) | 0 (0.0%) |
| Total | 241 (84.3%) | 45 (15.7%) |
Educational Attainment by Field of Study in Ness City
Education (64 | 28.4%), bio, nature & agricultural (51 | 22.7%), business (22 | 9.8%), arts & humanities (22 | 9.8%), and science & technology (18 | 8.0%) are the most common fields of study among 225 individuals in Ness City who have obtained a bachelor's degree or higher.
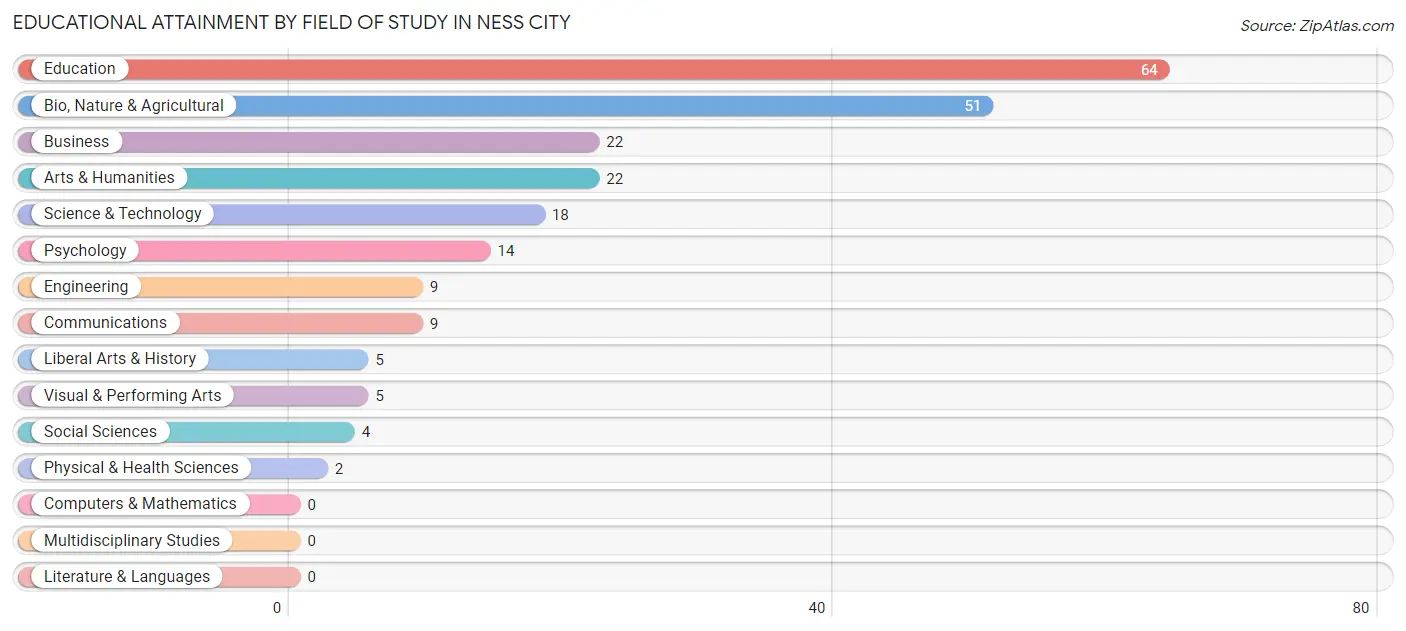
| Field of Study | # Graduates | % Graduates |
| Computers & Mathematics | 0 | 0.0% |
| Bio, Nature & Agricultural | 51 | 22.7% |
| Physical & Health Sciences | 2 | 0.9% |
| Psychology | 14 | 6.2% |
| Social Sciences | 4 | 1.8% |
| Engineering | 9 | 4.0% |
| Multidisciplinary Studies | 0 | 0.0% |
| Science & Technology | 18 | 8.0% |
| Business | 22 | 9.8% |
| Education | 64 | 28.4% |
| Literature & Languages | 0 | 0.0% |
| Liberal Arts & History | 5 | 2.2% |
| Visual & Performing Arts | 5 | 2.2% |
| Communications | 9 | 4.0% |
| Arts & Humanities | 22 | 9.8% |
| Total | 225 | 100.0% |
Transportation & Commute in Ness City
Vehicle Availability by Sex in Ness City
The most prevalent vehicle ownership categories in Ness City are males with 2 vehicles (177, accounting for 48.0%) and females with 2 vehicles (150, making up 58.2%).
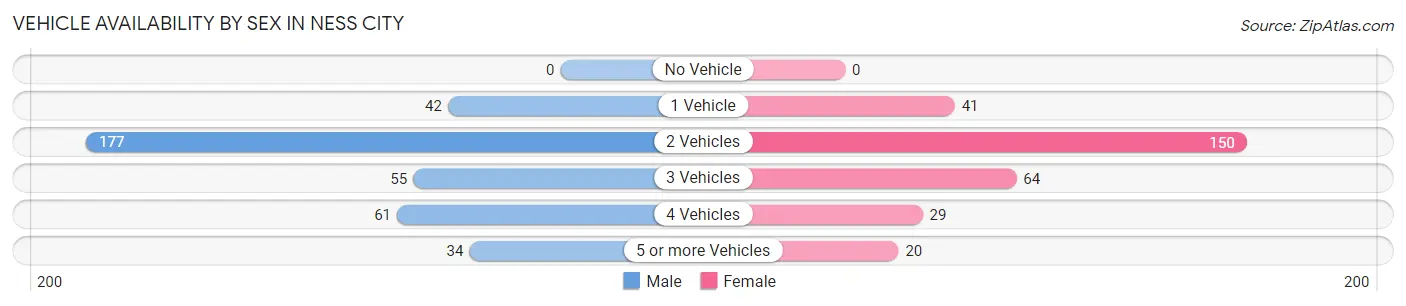
| Vehicles Available | Male | Female |
| No Vehicle | 0 (0.0%) | 0 (0.0%) |
| 1 Vehicle | 42 (11.4%) | 41 (13.5%) |
| 2 Vehicles | 177 (48.0%) | 150 (49.3%) |
| 3 Vehicles | 55 (14.9%) | 64 (21.0%) |
| 4 Vehicles | 61 (16.5%) | 29 (9.5%) |
| 5 or more Vehicles | 34 (9.2%) | 20 (6.6%) |
| Total | 369 (100.0%) | 304 (100.0%) |
Commute Time in Ness City
The most frequently occuring commute durations in Ness City are 5 to 9 minutes (198 commuters, 31.0%), less than 5 minutes (188 commuters, 29.4%), and 10 to 14 minutes (90 commuters, 14.1%).
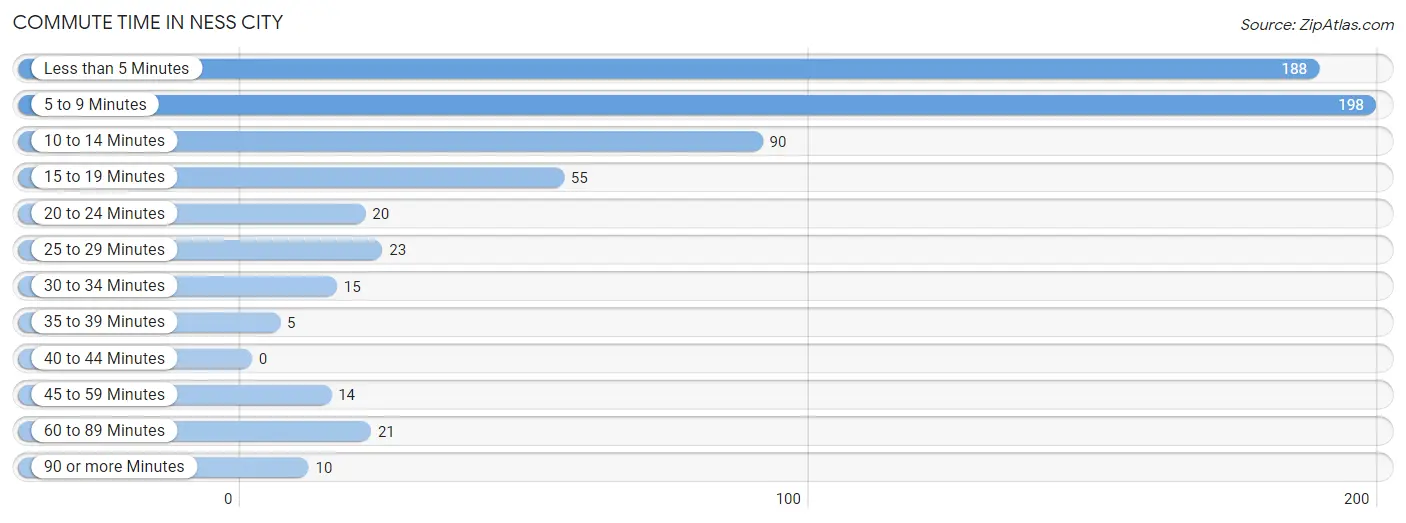
| Commute Time | # Commuters | % Commuters |
| Less than 5 Minutes | 188 | 29.4% |
| 5 to 9 Minutes | 198 | 31.0% |
| 10 to 14 Minutes | 90 | 14.1% |
| 15 to 19 Minutes | 55 | 8.6% |
| 20 to 24 Minutes | 20 | 3.1% |
| 25 to 29 Minutes | 23 | 3.6% |
| 30 to 34 Minutes | 15 | 2.4% |
| 35 to 39 Minutes | 5 | 0.8% |
| 40 to 44 Minutes | 0 | 0.0% |
| 45 to 59 Minutes | 14 | 2.2% |
| 60 to 89 Minutes | 21 | 3.3% |
| 90 or more Minutes | 10 | 1.6% |
Commute Time by Sex in Ness City
The most common commute times in Ness City are less than 5 minutes (113 commuters, 31.3%) for males and 5 to 9 minutes (129 commuters, 46.4%) for females.
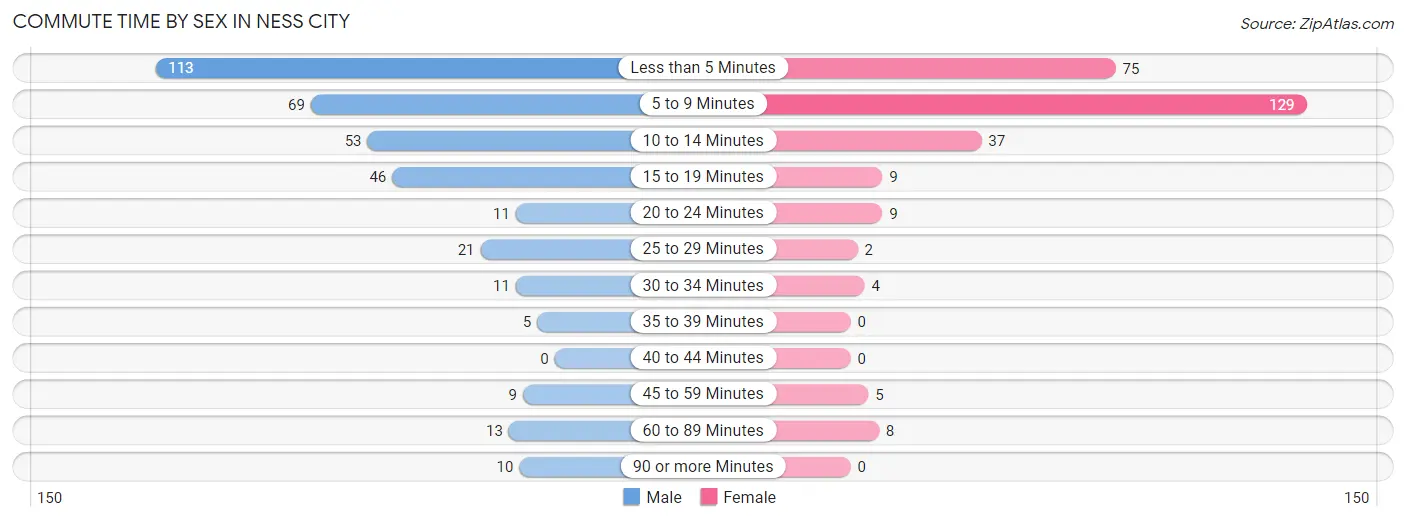
| Commute Time | Male | Female |
| Less than 5 Minutes | 113 (31.3%) | 75 (27.0%) |
| 5 to 9 Minutes | 69 (19.1%) | 129 (46.4%) |
| 10 to 14 Minutes | 53 (14.7%) | 37 (13.3%) |
| 15 to 19 Minutes | 46 (12.7%) | 9 (3.2%) |
| 20 to 24 Minutes | 11 (3.0%) | 9 (3.2%) |
| 25 to 29 Minutes | 21 (5.8%) | 2 (0.7%) |
| 30 to 34 Minutes | 11 (3.0%) | 4 (1.4%) |
| 35 to 39 Minutes | 5 (1.4%) | 0 (0.0%) |
| 40 to 44 Minutes | 0 (0.0%) | 0 (0.0%) |
| 45 to 59 Minutes | 9 (2.5%) | 5 (1.8%) |
| 60 to 89 Minutes | 13 (3.6%) | 8 (2.9%) |
| 90 or more Minutes | 10 (2.8%) | 0 (0.0%) |
Time of Departure to Work by Sex in Ness City
The most frequent times of departure to work in Ness City are 7:00 AM to 7:29 AM (108, 29.9%) for males and 7:30 AM to 7:59 AM (92, 33.1%) for females.
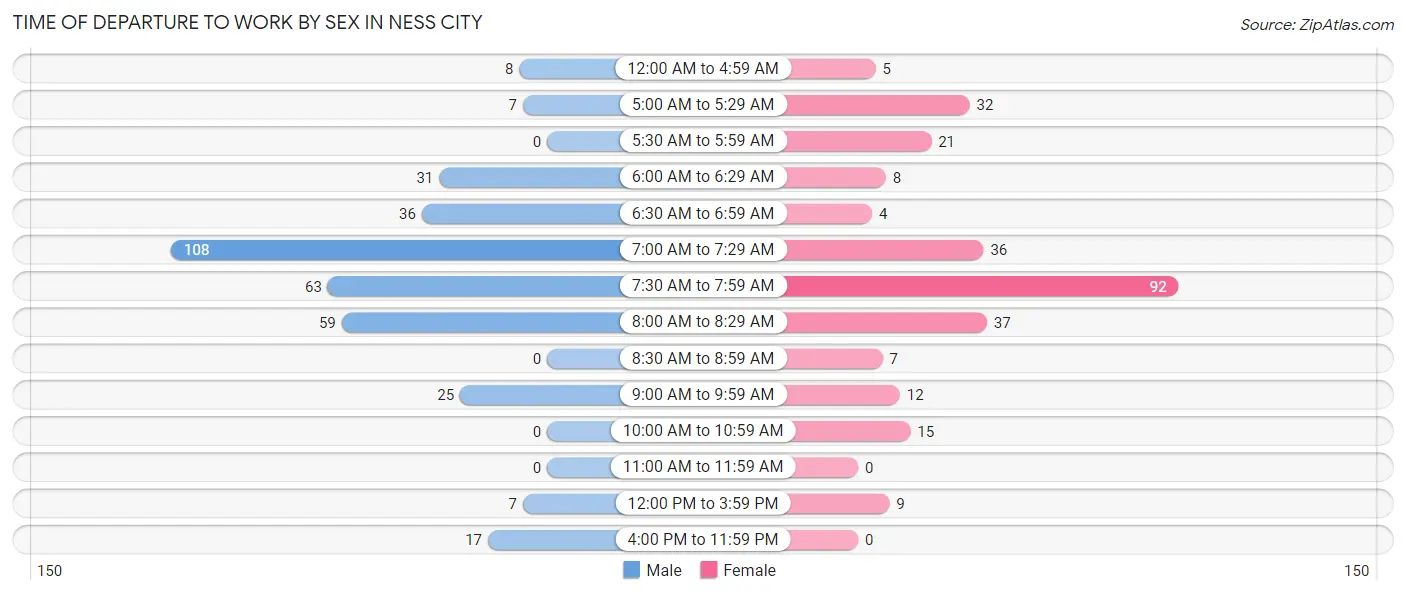
| Time of Departure | Male | Female |
| 12:00 AM to 4:59 AM | 8 (2.2%) | 5 (1.8%) |
| 5:00 AM to 5:29 AM | 7 (1.9%) | 32 (11.5%) |
| 5:30 AM to 5:59 AM | 0 (0.0%) | 21 (7.5%) |
| 6:00 AM to 6:29 AM | 31 (8.6%) | 8 (2.9%) |
| 6:30 AM to 6:59 AM | 36 (10.0%) | 4 (1.4%) |
| 7:00 AM to 7:29 AM | 108 (29.9%) | 36 (13.0%) |
| 7:30 AM to 7:59 AM | 63 (17.4%) | 92 (33.1%) |
| 8:00 AM to 8:29 AM | 59 (16.3%) | 37 (13.3%) |
| 8:30 AM to 8:59 AM | 0 (0.0%) | 7 (2.5%) |
| 9:00 AM to 9:59 AM | 25 (6.9%) | 12 (4.3%) |
| 10:00 AM to 10:59 AM | 0 (0.0%) | 15 (5.4%) |
| 11:00 AM to 11:59 AM | 0 (0.0%) | 0 (0.0%) |
| 12:00 PM to 3:59 PM | 7 (1.9%) | 9 (3.2%) |
| 4:00 PM to 11:59 PM | 17 (4.7%) | 0 (0.0%) |
| Total | 361 (100.0%) | 278 (100.0%) |
Housing Occupancy in Ness City
Occupancy by Ownership in Ness City
Of the total 508 dwellings in Ness City, owner-occupied units account for 425 (83.7%), while renter-occupied units make up 83 (16.3%).
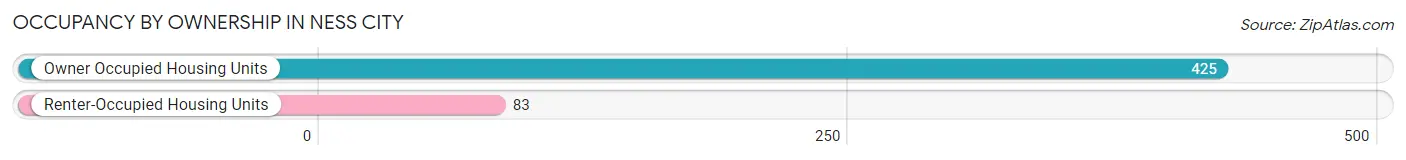
| Occupancy | # Housing Units | % Housing Units |
| Owner Occupied Housing Units | 425 | 83.7% |
| Renter-Occupied Housing Units | 83 | 16.3% |
| Total Occupied Housing Units | 508 | 100.0% |
Occupancy by Household Size in Ness City
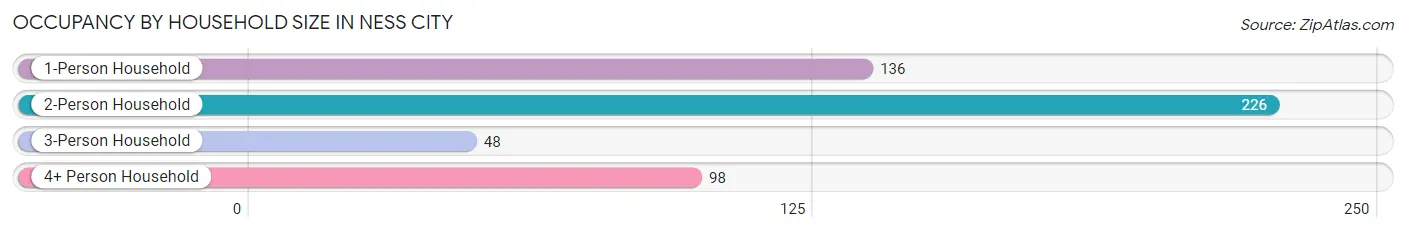
| Household Size | # Housing Units | % Housing Units |
| 1-Person Household | 136 | 26.8% |
| 2-Person Household | 226 | 44.5% |
| 3-Person Household | 48 | 9.5% |
| 4+ Person Household | 98 | 19.3% |
| Total Housing Units | 508 | 100.0% |
Occupancy by Ownership by Household Size in Ness City
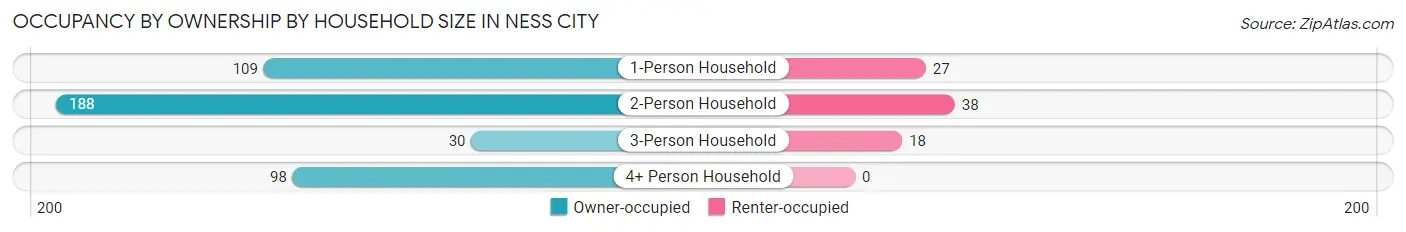
| Household Size | Owner-occupied | Renter-occupied |
| 1-Person Household | 109 (80.1%) | 27 (19.9%) |
| 2-Person Household | 188 (83.2%) | 38 (16.8%) |
| 3-Person Household | 30 (62.5%) | 18 (37.5%) |
| 4+ Person Household | 98 (100.0%) | 0 (0.0%) |
| Total Housing Units | 425 (83.7%) | 83 (16.3%) |
Occupancy by Educational Attainment in Ness City
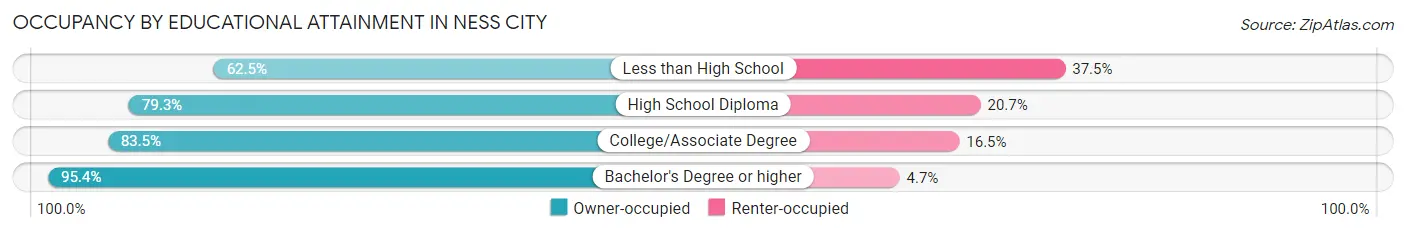
| Household Size | Owner-occupied | Renter-occupied |
| Less than High School | 25 (62.5%) | 15 (37.5%) |
| High School Diploma | 115 (79.3%) | 30 (20.7%) |
| College/Associate Degree | 162 (83.5%) | 32 (16.5%) |
| Bachelor's Degree or higher | 123 (95.4%) | 6 (4.6%) |
Occupancy by Age of Householder in Ness City
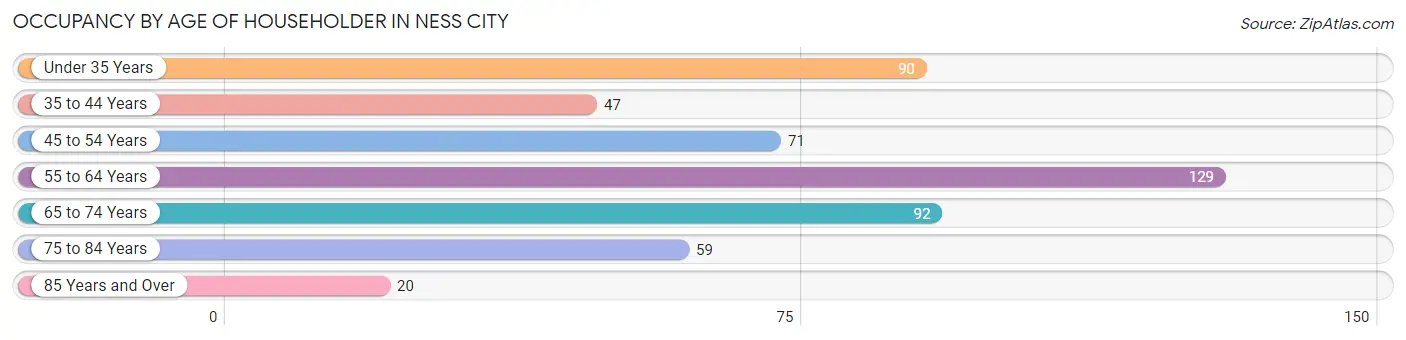
| Age Bracket | # Households | % Households |
| Under 35 Years | 90 | 17.7% |
| 35 to 44 Years | 47 | 9.2% |
| 45 to 54 Years | 71 | 14.0% |
| 55 to 64 Years | 129 | 25.4% |
| 65 to 74 Years | 92 | 18.1% |
| 75 to 84 Years | 59 | 11.6% |
| 85 Years and Over | 20 | 3.9% |
| Total | 508 | 100.0% |
Housing Finances in Ness City
Median Income by Occupancy in Ness City
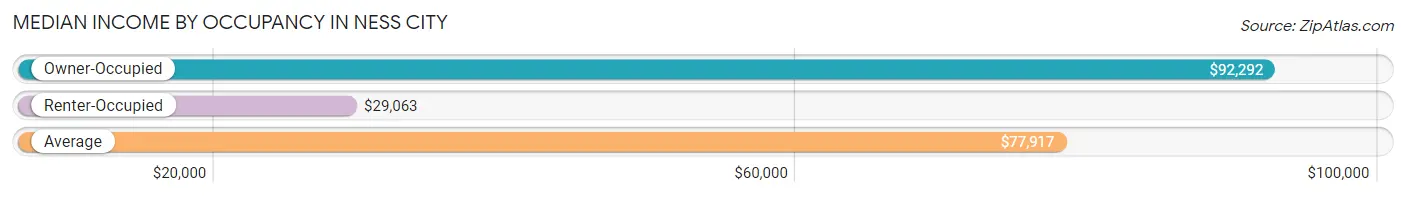
| Occupancy Type | # Households | Median Income |
| Owner-Occupied | 425 (83.7%) | $92,292 |
| Renter-Occupied | 83 (16.3%) | $29,063 |
| Average | 508 (100.0%) | $77,917 |
Occupancy by Householder Income Bracket in Ness City
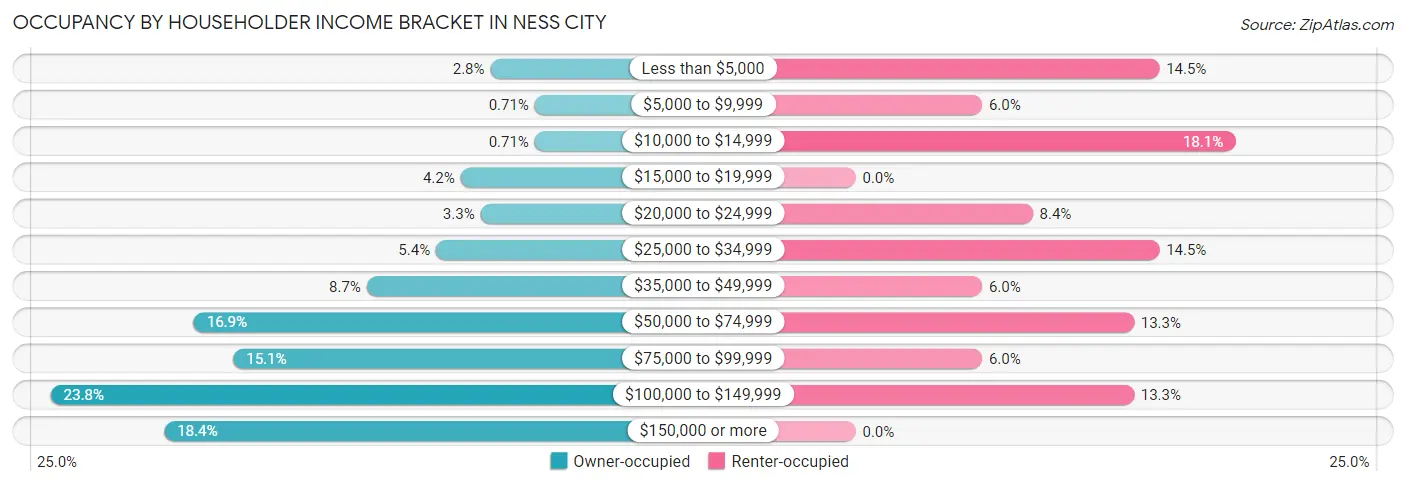
| Income Bracket | Owner-occupied | Renter-occupied |
| Less than $5,000 | 12 (2.8%) | 12 (14.5%) |
| $5,000 to $9,999 | 3 (0.7%) | 5 (6.0%) |
| $10,000 to $14,999 | 3 (0.7%) | 15 (18.1%) |
| $15,000 to $19,999 | 18 (4.2%) | 0 (0.0%) |
| $20,000 to $24,999 | 14 (3.3%) | 7 (8.4%) |
| $25,000 to $34,999 | 23 (5.4%) | 12 (14.5%) |
| $35,000 to $49,999 | 37 (8.7%) | 5 (6.0%) |
| $50,000 to $74,999 | 72 (16.9%) | 11 (13.3%) |
| $75,000 to $99,999 | 64 (15.1%) | 5 (6.0%) |
| $100,000 to $149,999 | 101 (23.8%) | 11 (13.3%) |
| $150,000 or more | 78 (18.3%) | 0 (0.0%) |
| Total | 425 (100.0%) | 83 (100.0%) |
Monthly Housing Cost Tiers in Ness City
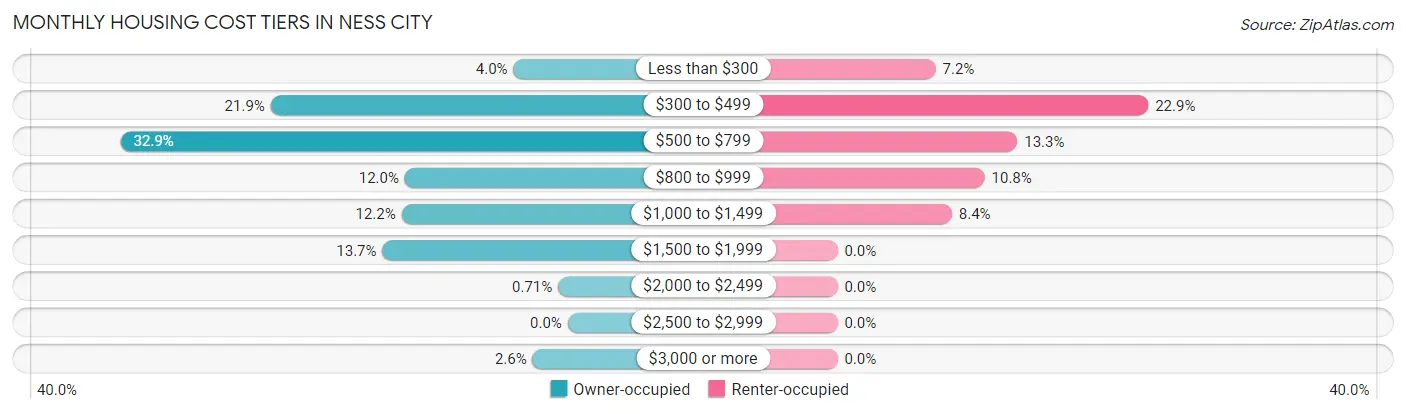
| Monthly Cost | Owner-occupied | Renter-occupied |
| Less than $300 | 17 (4.0%) | 6 (7.2%) |
| $300 to $499 | 93 (21.9%) | 19 (22.9%) |
| $500 to $799 | 140 (32.9%) | 11 (13.3%) |
| $800 to $999 | 51 (12.0%) | 9 (10.8%) |
| $1,000 to $1,499 | 52 (12.2%) | 7 (8.4%) |
| $1,500 to $1,999 | 58 (13.7%) | 0 (0.0%) |
| $2,000 to $2,499 | 3 (0.7%) | 0 (0.0%) |
| $2,500 to $2,999 | 0 (0.0%) | 0 (0.0%) |
| $3,000 or more | 11 (2.6%) | 0 (0.0%) |
| Total | 425 (100.0%) | 83 (100.0%) |
Physical Housing Characteristics in Ness City
Housing Structures in Ness City
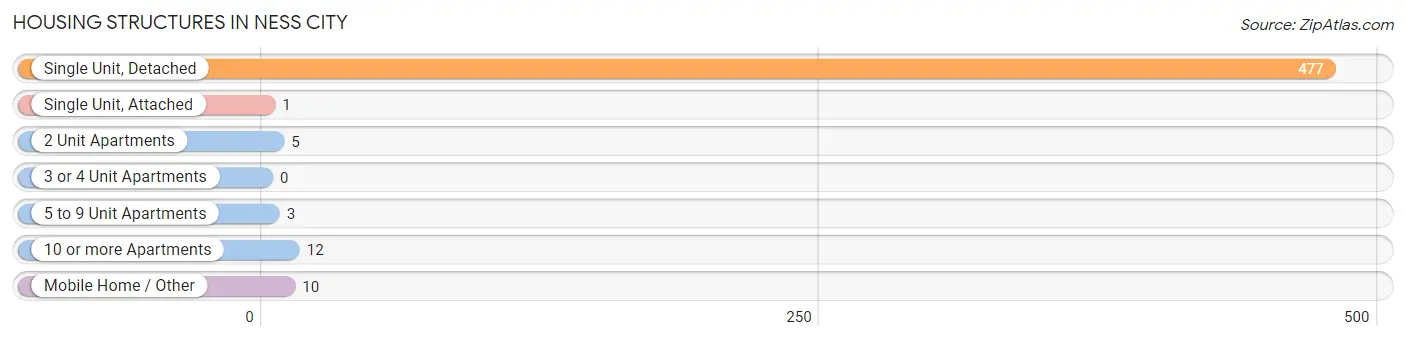
| Structure Type | # Housing Units | % Housing Units |
| Single Unit, Detached | 477 | 93.9% |
| Single Unit, Attached | 1 | 0.2% |
| 2 Unit Apartments | 5 | 1.0% |
| 3 or 4 Unit Apartments | 0 | 0.0% |
| 5 to 9 Unit Apartments | 3 | 0.6% |
| 10 or more Apartments | 12 | 2.4% |
| Mobile Home / Other | 10 | 2.0% |
| Total | 508 | 100.0% |
Housing Structures by Occupancy in Ness City
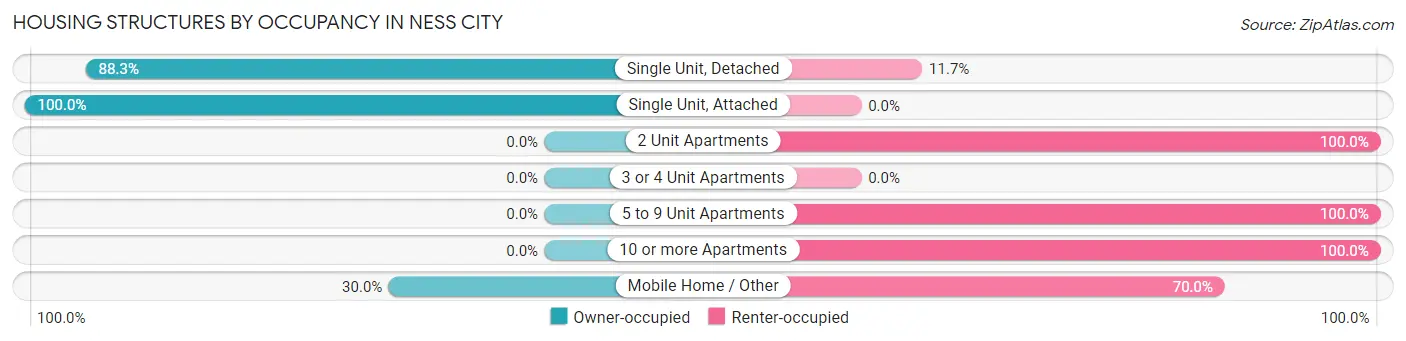
| Structure Type | Owner-occupied | Renter-occupied |
| Single Unit, Detached | 421 (88.3%) | 56 (11.7%) |
| Single Unit, Attached | 1 (100.0%) | 0 (0.0%) |
| 2 Unit Apartments | 0 (0.0%) | 5 (100.0%) |
| 3 or 4 Unit Apartments | 0 (0.0%) | 0 (0.0%) |
| 5 to 9 Unit Apartments | 0 (0.0%) | 3 (100.0%) |
| 10 or more Apartments | 0 (0.0%) | 12 (100.0%) |
| Mobile Home / Other | 3 (30.0%) | 7 (70.0%) |
| Total | 425 (83.7%) | 83 (16.3%) |
Housing Structures by Number of Rooms in Ness City
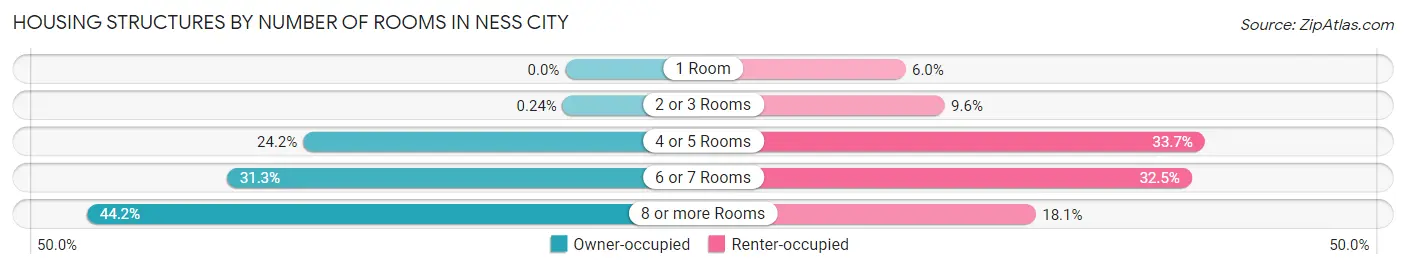
| Number of Rooms | Owner-occupied | Renter-occupied |
| 1 Room | 0 (0.0%) | 5 (6.0%) |
| 2 or 3 Rooms | 1 (0.2%) | 8 (9.6%) |
| 4 or 5 Rooms | 103 (24.2%) | 28 (33.7%) |
| 6 or 7 Rooms | 133 (31.3%) | 27 (32.5%) |
| 8 or more Rooms | 188 (44.2%) | 15 (18.1%) |
| Total | 425 (100.0%) | 83 (100.0%) |
Housing Structure by Heating Type in Ness City

| Heating Type | Owner-occupied | Renter-occupied |
| Utility Gas | 388 (91.3%) | 62 (74.7%) |
| Bottled, Tank, or LP Gas | 0 (0.0%) | 0 (0.0%) |
| Electricity | 23 (5.4%) | 21 (25.3%) |
| Fuel Oil or Kerosene | 0 (0.0%) | 0 (0.0%) |
| Coal or Coke | 0 (0.0%) | 0 (0.0%) |
| All other Fuels | 14 (3.3%) | 0 (0.0%) |
| No Fuel Used | 0 (0.0%) | 0 (0.0%) |
| Total | 425 (100.0%) | 83 (100.0%) |
Household Vehicle Usage in Ness City
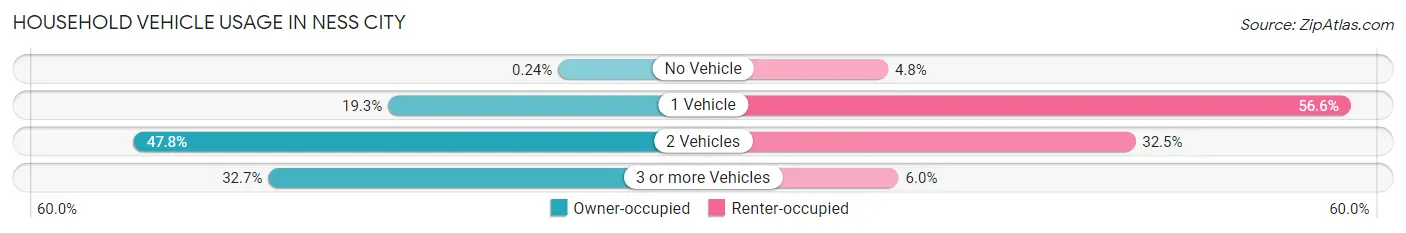
| Vehicles per Household | Owner-occupied | Renter-occupied |
| No Vehicle | 1 (0.2%) | 4 (4.8%) |
| 1 Vehicle | 82 (19.3%) | 47 (56.6%) |
| 2 Vehicles | 203 (47.8%) | 27 (32.5%) |
| 3 or more Vehicles | 139 (32.7%) | 5 (6.0%) |
| Total | 425 (100.0%) | 83 (100.0%) |
Real Estate & Mortgages in Ness City
Real Estate and Mortgage Overview in Ness City
| Characteristic | Without Mortgage | With Mortgage |
| Housing Units | 253 | 172 |
| Median Property Value | $86,400 | $132,000 |
| Median Household Income | $62,679 | $39 |
| Monthly Housing Costs | $527 | $11 |
| Real Estate Taxes | $1,601 | $0 |
Property Value by Mortgage Status in Ness City
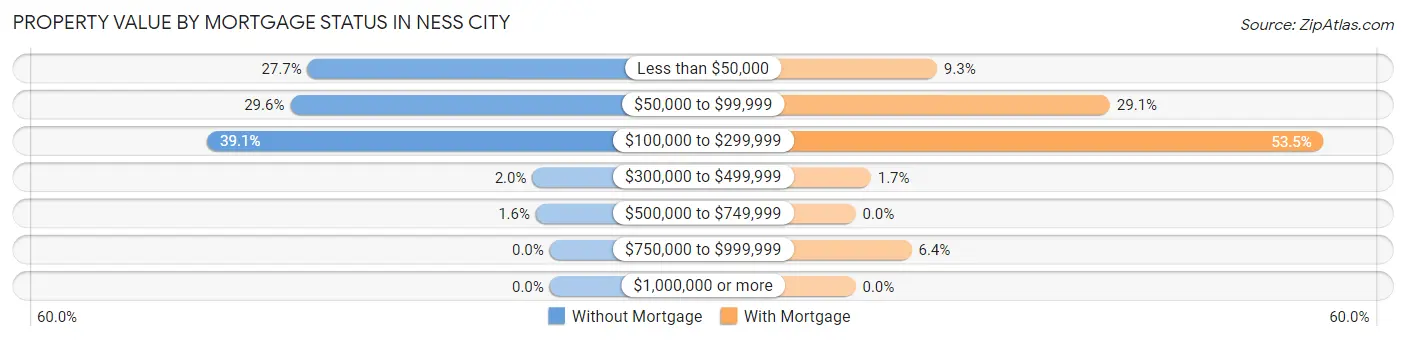
| Property Value | Without Mortgage | With Mortgage |
| Less than $50,000 | 70 (27.7%) | 16 (9.3%) |
| $50,000 to $99,999 | 75 (29.6%) | 50 (29.1%) |
| $100,000 to $299,999 | 99 (39.1%) | 92 (53.5%) |
| $300,000 to $499,999 | 5 (2.0%) | 3 (1.7%) |
| $500,000 to $749,999 | 4 (1.6%) | 0 (0.0%) |
| $750,000 to $999,999 | 0 (0.0%) | 11 (6.4%) |
| $1,000,000 or more | 0 (0.0%) | 0 (0.0%) |
| Total | 253 (100.0%) | 172 (100.0%) |
Household Income by Mortgage Status in Ness City
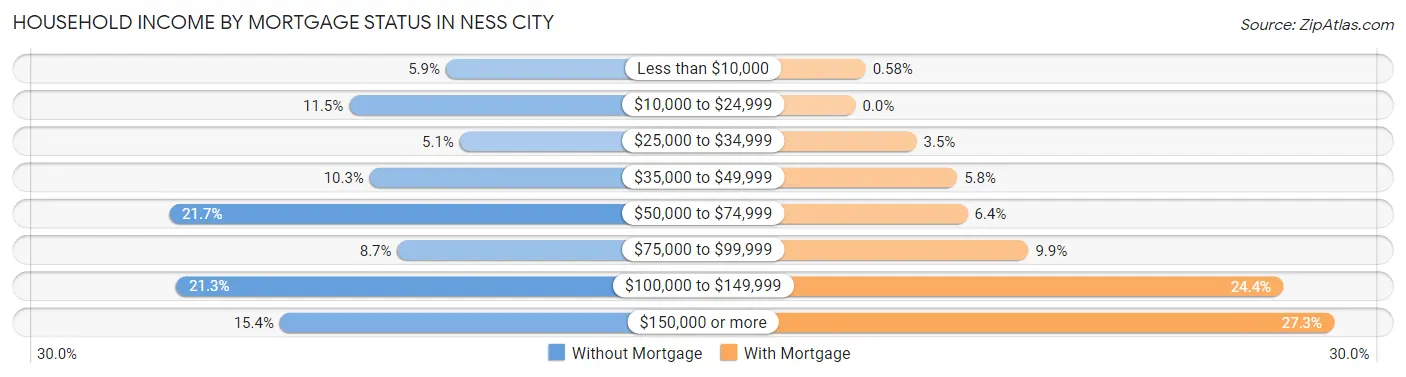
| Household Income | Without Mortgage | With Mortgage |
| Less than $10,000 | 15 (5.9%) | 1 (0.6%) |
| $10,000 to $24,999 | 29 (11.5%) | 0 (0.0%) |
| $25,000 to $34,999 | 13 (5.1%) | 6 (3.5%) |
| $35,000 to $49,999 | 26 (10.3%) | 10 (5.8%) |
| $50,000 to $74,999 | 55 (21.7%) | 11 (6.4%) |
| $75,000 to $99,999 | 22 (8.7%) | 17 (9.9%) |
| $100,000 to $149,999 | 54 (21.3%) | 42 (24.4%) |
| $150,000 or more | 39 (15.4%) | 47 (27.3%) |
| Total | 253 (100.0%) | 172 (100.0%) |
Property Value to Household Income Ratio in Ness City
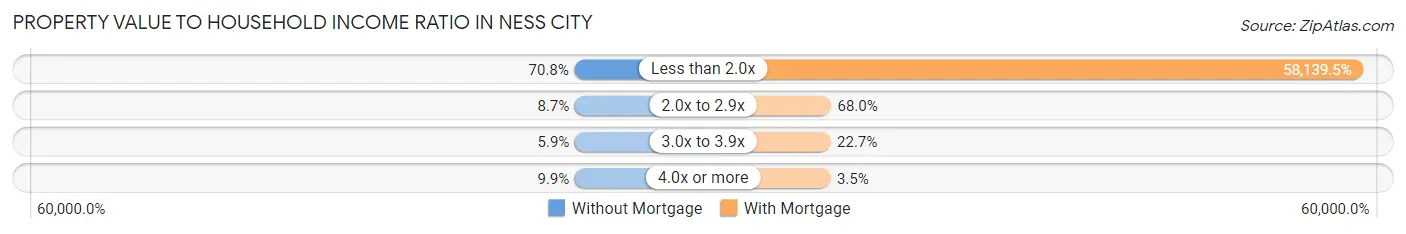
| Value-to-Income Ratio | Without Mortgage | With Mortgage |
| Less than 2.0x | 179 (70.8%) | 100,000 (58,139.5%) |
| 2.0x to 2.9x | 22 (8.7%) | 117 (68.0%) |
| 3.0x to 3.9x | 15 (5.9%) | 39 (22.7%) |
| 4.0x or more | 25 (9.9%) | 6 (3.5%) |
| Total | 253 (100.0%) | 172 (100.0%) |
Real Estate Taxes by Mortgage Status in Ness City
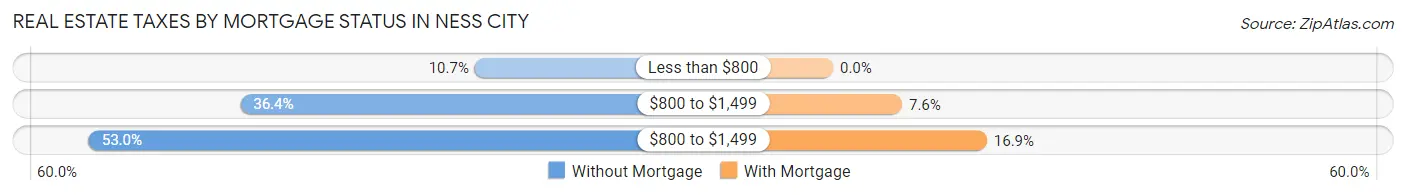
| Property Taxes | Without Mortgage | With Mortgage |
| Less than $800 | 27 (10.7%) | 0 (0.0%) |
| $800 to $1,499 | 92 (36.4%) | 13 (7.6%) |
| $800 to $1,499 | 134 (53.0%) | 29 (16.9%) |
| Total | 253 (100.0%) | 172 (100.0%) |
Health & Disability in Ness City
Health Insurance Coverage by Age in Ness City
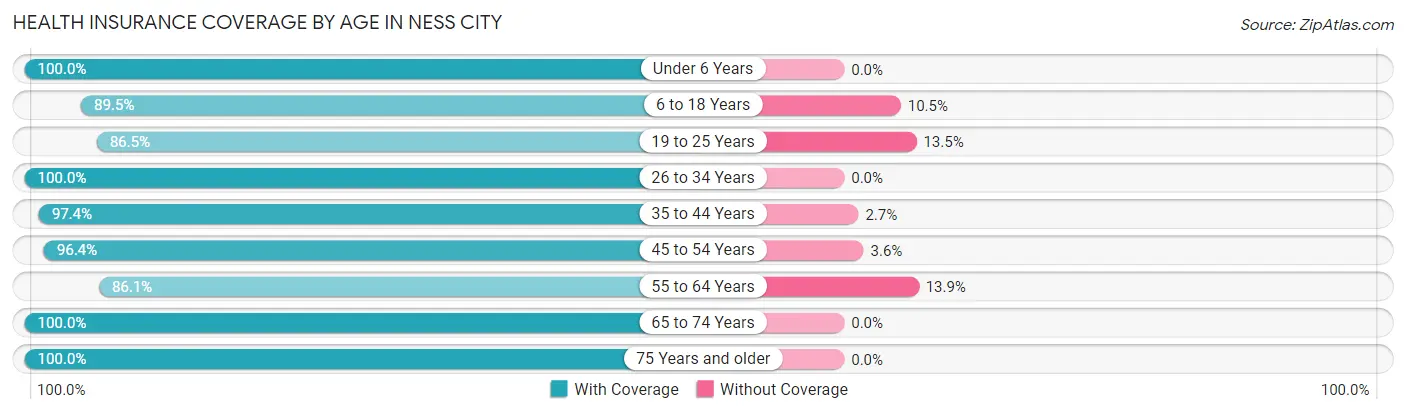
| Age Bracket | With Coverage | Without Coverage |
| Under 6 Years | 84 (100.0%) | 0 (0.0%) |
| 6 to 18 Years | 187 (89.5%) | 22 (10.5%) |
| 19 to 25 Years | 90 (86.5%) | 14 (13.5%) |
| 26 to 34 Years | 82 (100.0%) | 0 (0.0%) |
| 35 to 44 Years | 110 (97.4%) | 3 (2.6%) |
| 45 to 54 Years | 134 (96.4%) | 5 (3.6%) |
| 55 to 64 Years | 205 (86.1%) | 33 (13.9%) |
| 65 to 74 Years | 135 (100.0%) | 0 (0.0%) |
| 75 Years and older | 105 (100.0%) | 0 (0.0%) |
| Total | 1,132 (93.6%) | 77 (6.4%) |
Health Insurance Coverage by Citizenship Status in Ness City
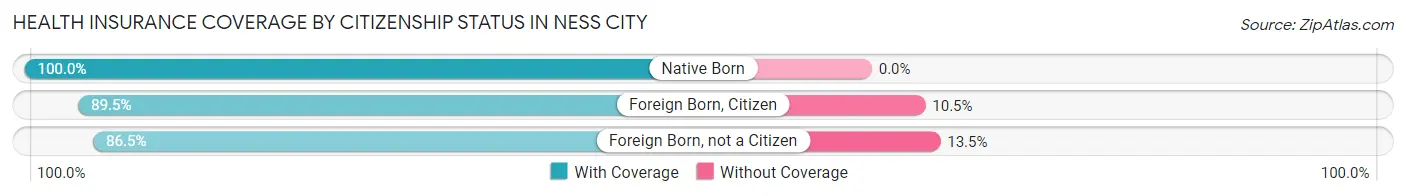
| Citizenship Status | With Coverage | Without Coverage |
| Native Born | 84 (100.0%) | 0 (0.0%) |
| Foreign Born, Citizen | 187 (89.5%) | 22 (10.5%) |
| Foreign Born, not a Citizen | 90 (86.5%) | 14 (13.5%) |
Health Insurance Coverage by Household Income in Ness City
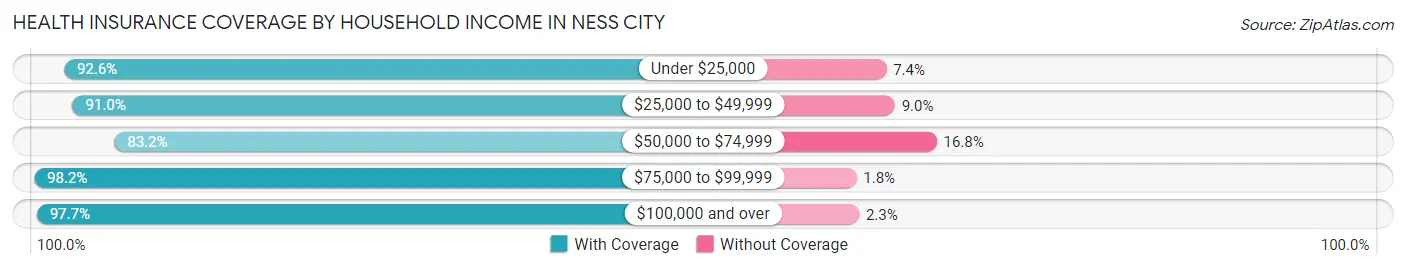
| Household Income | With Coverage | Without Coverage |
| Under $25,000 | 113 (92.6%) | 9 (7.4%) |
| $25,000 to $49,999 | 152 (91.0%) | 15 (9.0%) |
| $50,000 to $74,999 | 188 (83.2%) | 38 (16.8%) |
| $75,000 to $99,999 | 165 (98.2%) | 3 (1.8%) |
| $100,000 and over | 514 (97.7%) | 12 (2.3%) |
Public vs Private Health Insurance Coverage by Age in Ness City
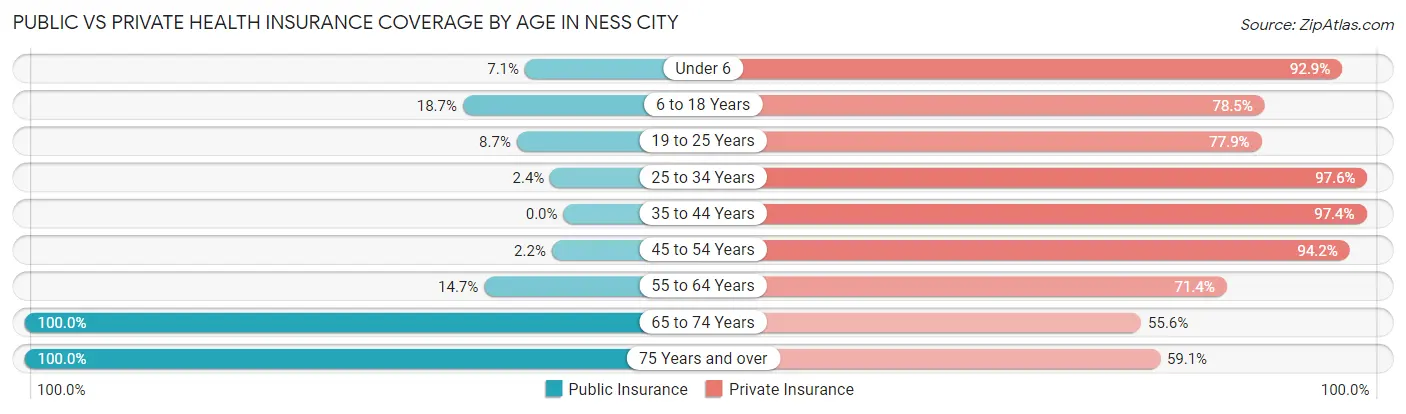
| Age Bracket | Public Insurance | Private Insurance |
| Under 6 | 6 (7.1%) | 78 (92.9%) |
| 6 to 18 Years | 39 (18.7%) | 164 (78.5%) |
| 19 to 25 Years | 9 (8.6%) | 81 (77.9%) |
| 25 to 34 Years | 2 (2.4%) | 80 (97.6%) |
| 35 to 44 Years | 0 (0.0%) | 110 (97.4%) |
| 45 to 54 Years | 3 (2.2%) | 131 (94.2%) |
| 55 to 64 Years | 35 (14.7%) | 170 (71.4%) |
| 65 to 74 Years | 135 (100.0%) | 75 (55.6%) |
| 75 Years and over | 105 (100.0%) | 62 (59.1%) |
| Total | 334 (27.6%) | 951 (78.7%) |
Disability Status by Sex by Age in Ness City
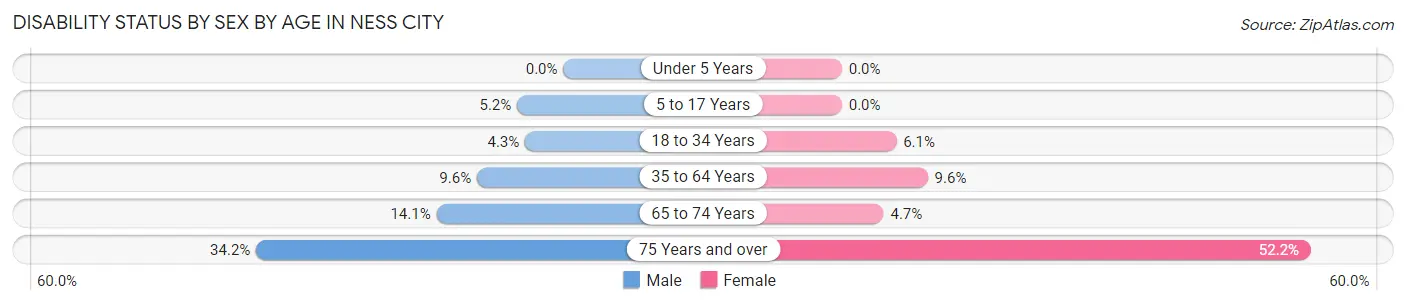
| Age Bracket | Male | Female |
| Under 5 Years | 0 (0.0%) | 0 (0.0%) |
| 5 to 17 Years | 7 (5.1%) | 0 (0.0%) |
| 18 to 34 Years | 4 (4.3%) | 6 (6.1%) |
| 35 to 64 Years | 23 (9.6%) | 24 (9.6%) |
| 65 to 74 Years | 13 (14.1%) | 2 (4.6%) |
| 75 Years and over | 13 (34.2%) | 35 (52.2%) |
Disability Class by Sex by Age in Ness City
Disability Class: Hearing Difficulty
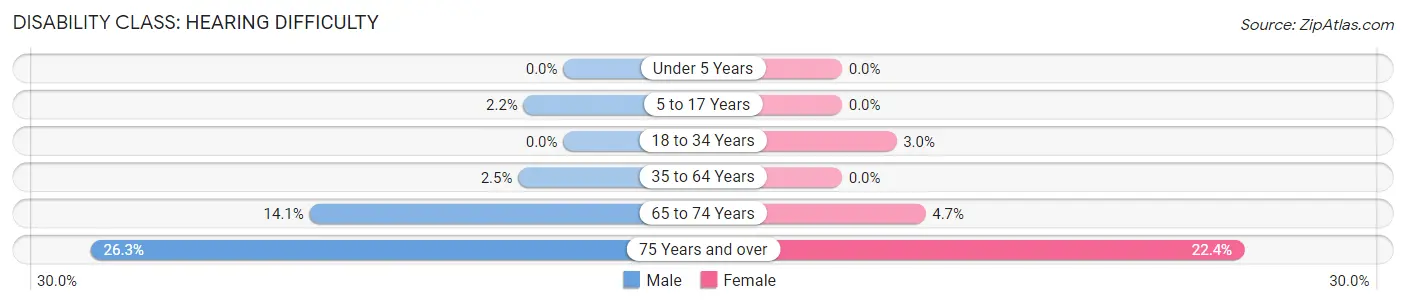
| Age Bracket | Male | Female |
| Under 5 Years | 0 (0.0%) | 0 (0.0%) |
| 5 to 17 Years | 3 (2.2%) | 0 (0.0%) |
| 18 to 34 Years | 0 (0.0%) | 3 (3.0%) |
| 35 to 64 Years | 6 (2.5%) | 0 (0.0%) |
| 65 to 74 Years | 13 (14.1%) | 2 (4.6%) |
| 75 Years and over | 10 (26.3%) | 15 (22.4%) |
Disability Class: Vision Difficulty
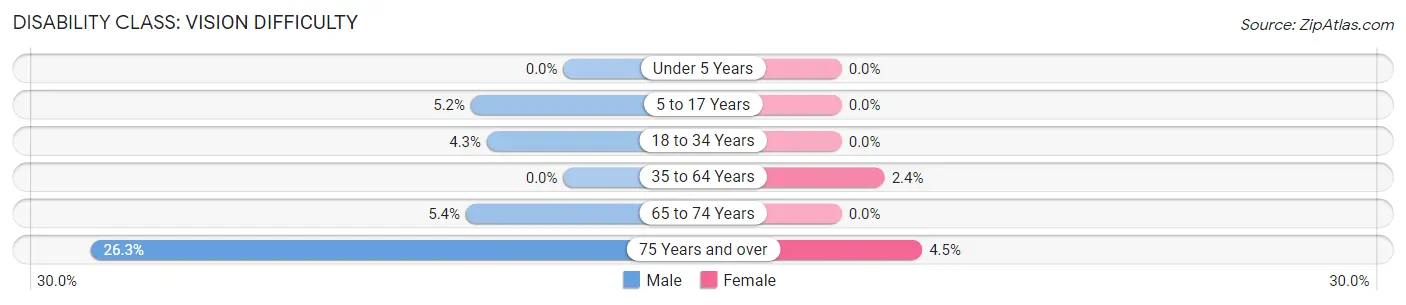
| Age Bracket | Male | Female |
| Under 5 Years | 0 (0.0%) | 0 (0.0%) |
| 5 to 17 Years | 7 (5.1%) | 0 (0.0%) |
| 18 to 34 Years | 4 (4.3%) | 0 (0.0%) |
| 35 to 64 Years | 0 (0.0%) | 6 (2.4%) |
| 65 to 74 Years | 5 (5.4%) | 0 (0.0%) |
| 75 Years and over | 10 (26.3%) | 3 (4.5%) |
Disability Class: Cognitive Difficulty
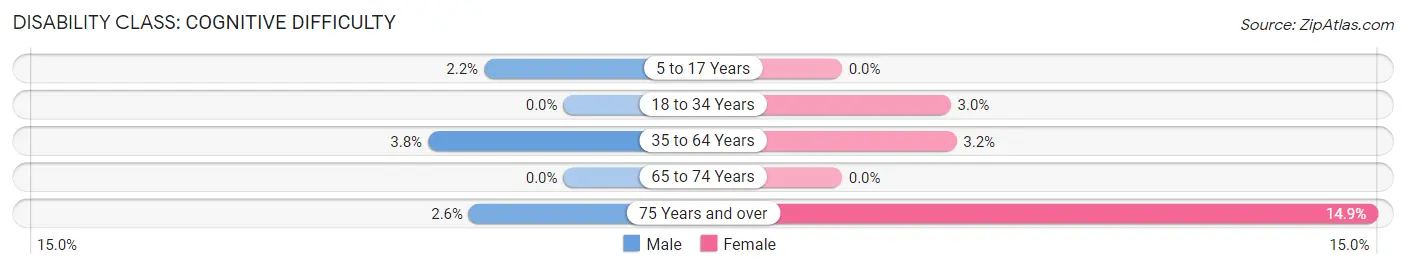
| Age Bracket | Male | Female |
| 5 to 17 Years | 3 (2.2%) | 0 (0.0%) |
| 18 to 34 Years | 0 (0.0%) | 3 (3.0%) |
| 35 to 64 Years | 9 (3.8%) | 8 (3.2%) |
| 65 to 74 Years | 0 (0.0%) | 0 (0.0%) |
| 75 Years and over | 1 (2.6%) | 10 (14.9%) |
Disability Class: Ambulatory Difficulty
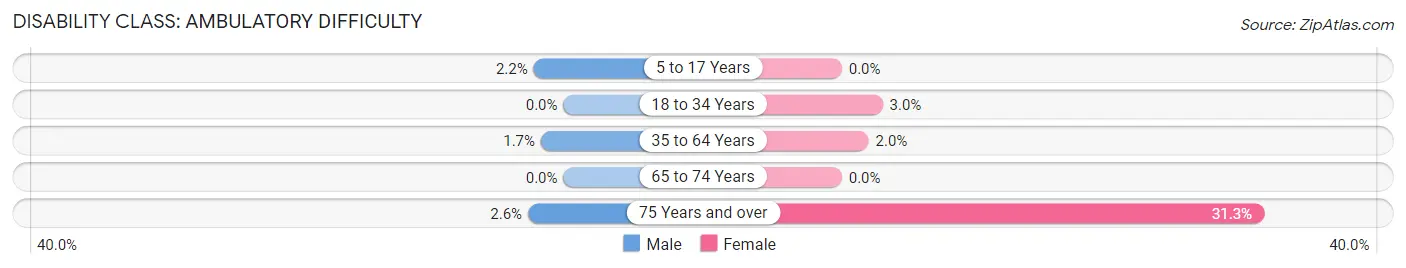
| Age Bracket | Male | Female |
| 5 to 17 Years | 3 (2.2%) | 0 (0.0%) |
| 18 to 34 Years | 0 (0.0%) | 3 (3.0%) |
| 35 to 64 Years | 4 (1.7%) | 5 (2.0%) |
| 65 to 74 Years | 0 (0.0%) | 0 (0.0%) |
| 75 Years and over | 1 (2.6%) | 21 (31.3%) |
Disability Class: Self-Care Difficulty
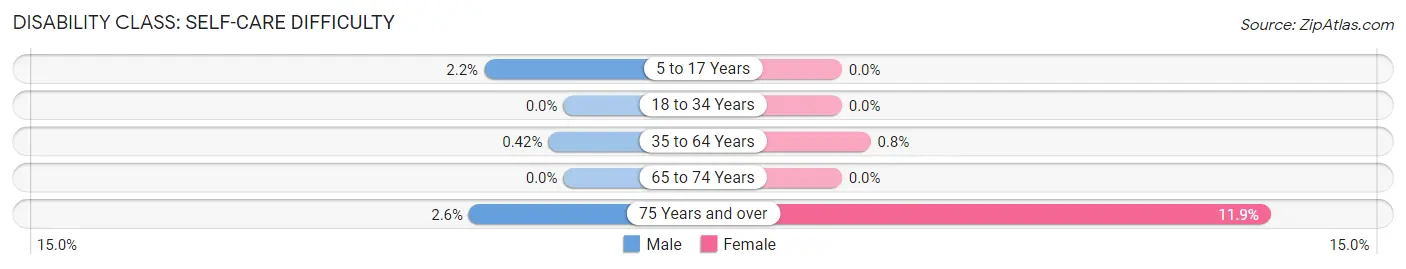
| Age Bracket | Male | Female |
| 5 to 17 Years | 3 (2.2%) | 0 (0.0%) |
| 18 to 34 Years | 0 (0.0%) | 0 (0.0%) |
| 35 to 64 Years | 1 (0.4%) | 2 (0.8%) |
| 65 to 74 Years | 0 (0.0%) | 0 (0.0%) |
| 75 Years and over | 1 (2.6%) | 8 (11.9%) |
Technology Access in Ness City
Computing Device Access in Ness City
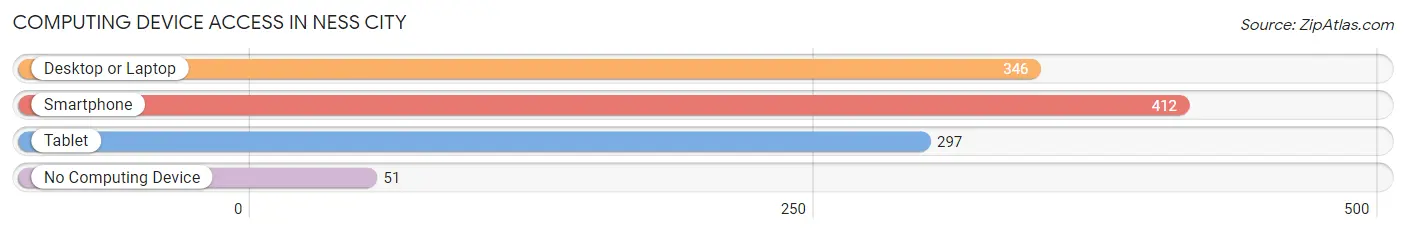
| Device Type | # Households | % Households |
| Desktop or Laptop | 346 | 68.1% |
| Smartphone | 412 | 81.1% |
| Tablet | 297 | 58.5% |
| No Computing Device | 51 | 10.0% |
| Total | 508 | 100.0% |
Internet Access in Ness City
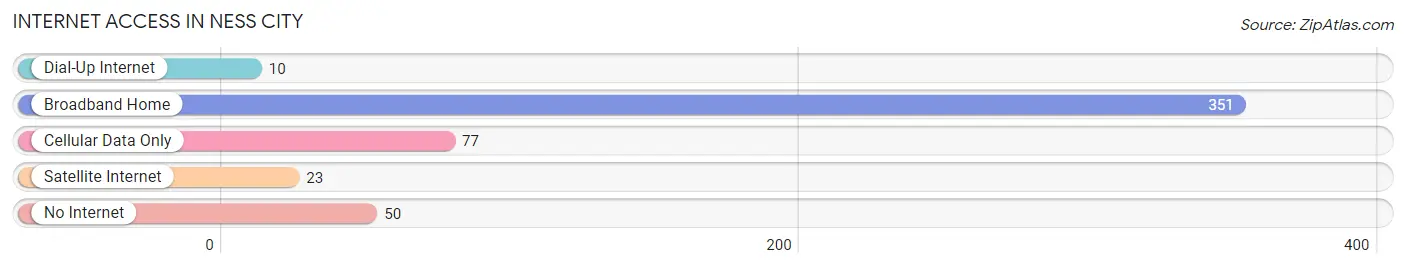
| Internet Type | # Households | % Households |
| Dial-Up Internet | 10 | 2.0% |
| Broadband Home | 351 | 69.1% |
| Cellular Data Only | 77 | 15.2% |
| Satellite Internet | 23 | 4.5% |
| No Internet | 50 | 9.8% |
| Total | 508 | 100.0% |
Ness City Summary
Ness City is a small city located in western Kansas, in the county of Ness. It is situated on the banks of the Arkansas River, and is the county seat of Ness County. The city has a population of 1,845 people, according to the 2010 census.
Geography
Ness City is located in western Kansas, in the county of Ness. It is situated on the banks of the Arkansas River, and is the county seat of Ness County. The city is located at an elevation of 2,845 feet (867 m). The city is located in the High Plains region of the Great Plains, and is part of the Great Bend-Hays Micropolitan Statistical Area.
The city has a total area of 1.2 square miles (3.2 km2), all of which is land. The city is located in the Central Flyway, and is a popular destination for birdwatchers.
Climate
Ness City has a semi-arid climate, with hot summers and cold winters. The average annual temperature is 54.3 °F (12.4 °C). The average annual precipitation is 20.3 inches (51.6 cm).
Demographics
As of the 2010 census, there were 1,845 people, 745 households, and 486 families residing in the city. The population density was 1,539.2 people per square mile (593.3/km2). There were 845 housing units at an average density of 705.8 per square mile (272.3/km2). The racial makeup of the city was 95.2% White, 0.2% African American, 0.7% Native American, 0.2% Asian, 0.1% Pacific Islander, 2.2% from other races, and 1.6% from two or more races. Hispanic or Latino of any race were 4.2% of the population.
Economy
Ness City is a small city with a limited economy. The city is home to several small businesses, including a grocery store, a hardware store, a restaurant, and a few other small businesses. The city is also home to a few manufacturing companies, including a plastics manufacturer and a metal fabrication company. The city is also home to a few agricultural businesses, including a dairy farm and a feedlot.
The city is served by the Ness City Unified School District, which includes an elementary school, a middle school, and a high school. The city is also home to a branch of the Ness County Library.
Conclusion
Ness City is a small city located in western Kansas, in the county of Ness. It is situated on the banks of the Arkansas River, and is the county seat of Ness County. The city has a population of 1,845 people, according to the 2010 census. The city has a semi-arid climate, with hot summers and cold winters. The city is home to several small businesses, including a grocery store, a hardware store, a restaurant, and a few other small businesses. The city is also home to a few manufacturing companies, including a plastics manufacturer and a metal fabrication company. The city is also home to a few agricultural businesses, including a dairy farm and a feedlot. The city is served by the Ness City Unified School District, which includes an elementary school, a middle school, and a high school. The city is also home to a branch of the Ness County Library.
Common Questions
What is Per Capita Income in Ness City?
Per Capita income in Ness City is $44,670.
What is the Median Family Income in Ness City?
Median Family Income in Ness City is $105,060.
What is the Median Household income in Ness City?
Median Household Income in Ness City is $77,917.
What is Income or Wage Gap in Ness City?
Income or Wage Gap in Ness City is 56.3%.
Women in Ness City earn 43.7 cents for every dollar earned by a man.
What is Inequality or Gini Index in Ness City?
Inequality or Gini Index in Ness City is 0.50.
What is the Total Population of Ness City?
Total Population of Ness City is 1,243.
What is the Total Male Population of Ness City?
Total Male Population of Ness City is 645.
What is the Total Female Population of Ness City?
Total Female Population of Ness City is 598.
What is the Ratio of Males per 100 Females in Ness City?
There are 107.86 Males per 100 Females in Ness City.
What is the Ratio of Females per 100 Males in Ness City?
There are 92.71 Females per 100 Males in Ness City.
What is the Median Population Age in Ness City?
Median Population Age in Ness City is 46.9 Years.
What is the Average Family Size in Ness City
Average Family Size in Ness City is 3.0 People.
What is the Average Household Size in Ness City
Average Household Size in Ness City is 2.4 People.
How Large is the Labor Force in Ness City?
There are 691 People in the Labor Forcein in Ness City.
What is the Percentage of People in the Labor Force in Ness City?
68.3% of People are in the Labor Force in Ness City.
What is the Unemployment Rate in Ness City?
Unemployment Rate in Ness City is 0.4%.