Zip Codes with the Highest Percentage of Households with Income Above $100,000 in Overland Park, KS
RELATED REPORTS & OPTIONS
Household Income | $100k+
Overland Park
Compare Zip Codes
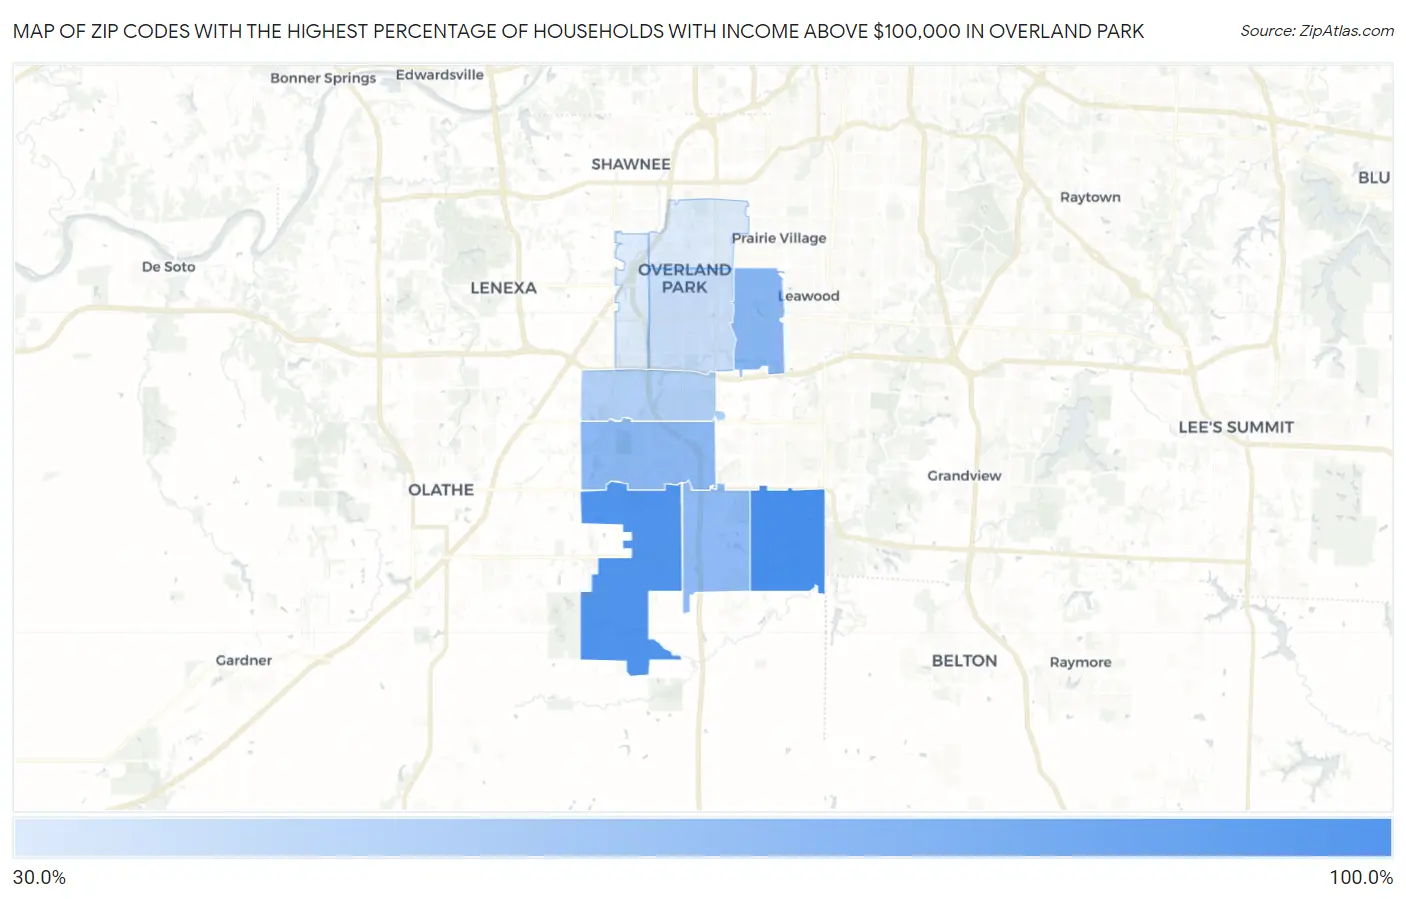
Map of Zip Codes with the Highest Percentage of Households with Income Above $100,000 in Overland Park
31.0%
81.1%
Zip Codes with the Highest Percentage of Households with Income Above $100,000 in Overland Park, KS
| Zip Code | Households with Income > $100k | vs State | vs National | |
| 1. | 66224 | 81.1% | 33.0%(+48.1)#2 | 37.3%(+43.8)#306 |
| 2. | 66221 | 77.2% | 33.0%(+44.2)#5 | 37.3%(+39.9)#455 |
| 3. | 66207 | 57.3% | 33.0%(+24.3)#26 | 37.3%(+20.0)#2,919 |
| 4. | 66213 | 57.1% | 33.0%(+24.1)#28 | 37.3%(+19.8)#2,948 |
| 5. | 66223 | 55.5% | 33.0%(+22.5)#35 | 37.3%(+18.2)#3,321 |
| 6. | 66210 | 44.1% | 33.0%(+11.1)#75 | 37.3%(+6.80)#6,963 |
| 7. | 66212 | 37.3% | 33.0%(+4.30)#151 | 37.3%(=0.000)#10,370 |
| 8. | 66214 | 31.2% | 33.0%(-1.80)#243 | 37.3%(-6.10)#14,479 |
| 9. | 66204 | 31.0% | 33.0%(-2.00)#249 | 37.3%(-6.30)#14,642 |
1
Common Questions
What are the Top 5 Zip Codes with the Highest Percentage of Households with Income Above $100,000 in Overland Park, KS?
Top 5 Zip Codes with the Highest Percentage of Households with Income Above $100,000 in Overland Park, KS are:
What zip code has the Highest Percentage of Households with Income Above $100,000 in Overland Park, KS?
66224 has the Highest Percentage of Households with Income Above $100,000 in Overland Park, KS with 81.1%.
What is the Percentage of Households with Income Above $100,000 in Overland Park, KS?
Percentage of Households with Income Above $100,000 in Overland Park is 50.4%.
What is the Percentage of Households with Income Above $100,000 in Kansas?
Percentage of Households with Income Above $100,000 in Kansas is 33.0%.
What is the Percentage of Households with Income Above $100,000 in the United States?
Percentage of Households with Income Above $100,000 in the United States is 37.3%.