Zip Codes with the Highest Percentage of Households with Income Above $100,000 in Wichita, KS
RELATED REPORTS & OPTIONS
Household Income | $100k+
Wichita
Compare Zip Codes
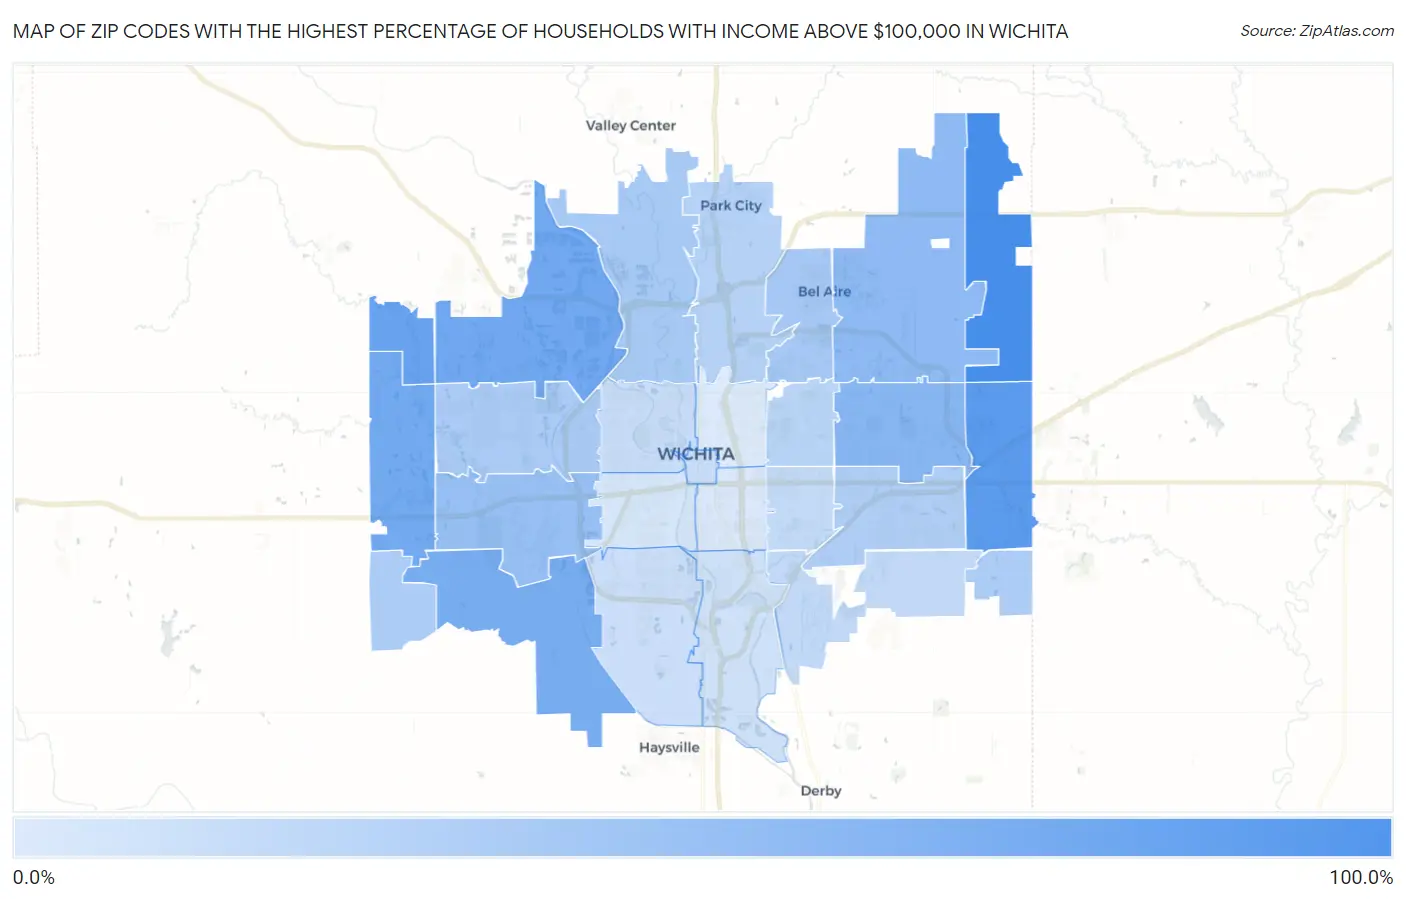
Map of Zip Codes with the Highest Percentage of Households with Income Above $100,000 in Wichita
8.0%
81.1%
Zip Codes with the Highest Percentage of Households with Income Above $100,000 in Wichita, KS
| Zip Code | Households with Income > $100k | vs State | vs National | |
| 1. | 67228 | 81.1% | 33.0%(+48.1)#3 | 37.3%(+43.8)#308 |
| 2. | 67230 | 70.6% | 33.0%(+37.6)#10 | 37.3%(+33.3)#908 |
| 3. | 67223 | 61.9% | 33.0%(+28.9)#18 | 37.3%(+24.6)#2,028 |
| 4. | 67205 | 57.3% | 33.0%(+24.3)#25 | 37.3%(+20.0)#2,915 |
| 5. | 67235 | 55.9% | 33.0%(+22.9)#30 | 37.3%(+18.6)#3,209 |
| 6. | 67215 | 53.0% | 33.0%(+20.0)#42 | 37.3%(+15.7)#3,971 |
| 7. | 67206 | 44.9% | 33.0%(+11.9)#70 | 37.3%(+7.60)#6,656 |
| 8. | 67226 | 41.9% | 33.0%(+8.90)#99 | 37.3%(+4.60)#7,929 |
| 9. | 67209 | 37.5% | 33.0%(+4.50)#146 | 37.3%(+0.200)#10,265 |
| 10. | 67220 | 31.0% | 33.0%(-2.00)#251 | 37.3%(-6.30)#14,645 |
| 11. | 67204 | 29.3% | 33.0%(-3.70)#275 | 37.3%(-8.00)#16,005 |
| 12. | 67212 | 28.9% | 33.0%(-4.10)#284 | 37.3%(-8.40)#16,307 |
| 13. | 67232 | 28.1% | 33.0%(-4.90)#304 | 37.3%(-9.20)#17,090 |
| 14. | 67227 | 27.7% | 33.0%(-5.30)#308 | 37.3%(-9.60)#17,449 |
| 15. | 67207 | 27.1% | 33.0%(-5.90)#320 | 37.3%(-10.2)#17,903 |
| 16. | 67219 | 23.7% | 33.0%(-9.30)#396 | 37.3%(-13.6)#20,923 |
| 17. | 67208 | 22.1% | 33.0%(-10.9)#429 | 37.3%(-15.2)#22,310 |
| 18. | 67210 | 19.1% | 33.0%(-13.9)#511 | 37.3%(-18.2)#24,757 |
| 19. | 67218 | 18.2% | 33.0%(-14.8)#523 | 37.3%(-19.1)#25,397 |
| 20. | 67203 | 16.0% | 33.0%(-17.0)#568 | 37.3%(-21.3)#26,924 |
| 21. | 67202 | 15.6% | 33.0%(-17.4)#575 | 37.3%(-21.7)#27,198 |
| 22. | 67217 | 15.0% | 33.0%(-18.0)#587 | 37.3%(-22.3)#27,528 |
| 23. | 67216 | 13.0% | 33.0%(-20.0)#609 | 37.3%(-24.3)#28,576 |
| 24. | 67213 | 10.2% | 33.0%(-22.8)#638 | 37.3%(-27.1)#29,746 |
| 25. | 67211 | 8.7% | 33.0%(-24.3)#651 | 37.3%(-28.6)#30,228 |
| 26. | 67214 | 8.0% | 33.0%(-25.0)#656 | 37.3%(-29.3)#30,436 |
1
Common Questions
What are the Top 10 Zip Codes with the Highest Percentage of Households with Income Above $100,000 in Wichita, KS?
Top 10 Zip Codes with the Highest Percentage of Households with Income Above $100,000 in Wichita, KS are:
What zip code has the Highest Percentage of Households with Income Above $100,000 in Wichita, KS?
67228 has the Highest Percentage of Households with Income Above $100,000 in Wichita, KS with 81.1%.
What is the Percentage of Households with Income Above $100,000 in Wichita, KS?
Percentage of Households with Income Above $100,000 in Wichita is 26.8%.
What is the Percentage of Households with Income Above $100,000 in Kansas?
Percentage of Households with Income Above $100,000 in Kansas is 33.0%.
What is the Percentage of Households with Income Above $100,000 in the United States?
Percentage of Households with Income Above $100,000 in the United States is 37.3%.