Zip Codes with the Highest Percentage of Households with Income Above $100,000 in Mission, KS
RELATED REPORTS & OPTIONS
Household Income | $100k+
Mission
Compare Zip Codes
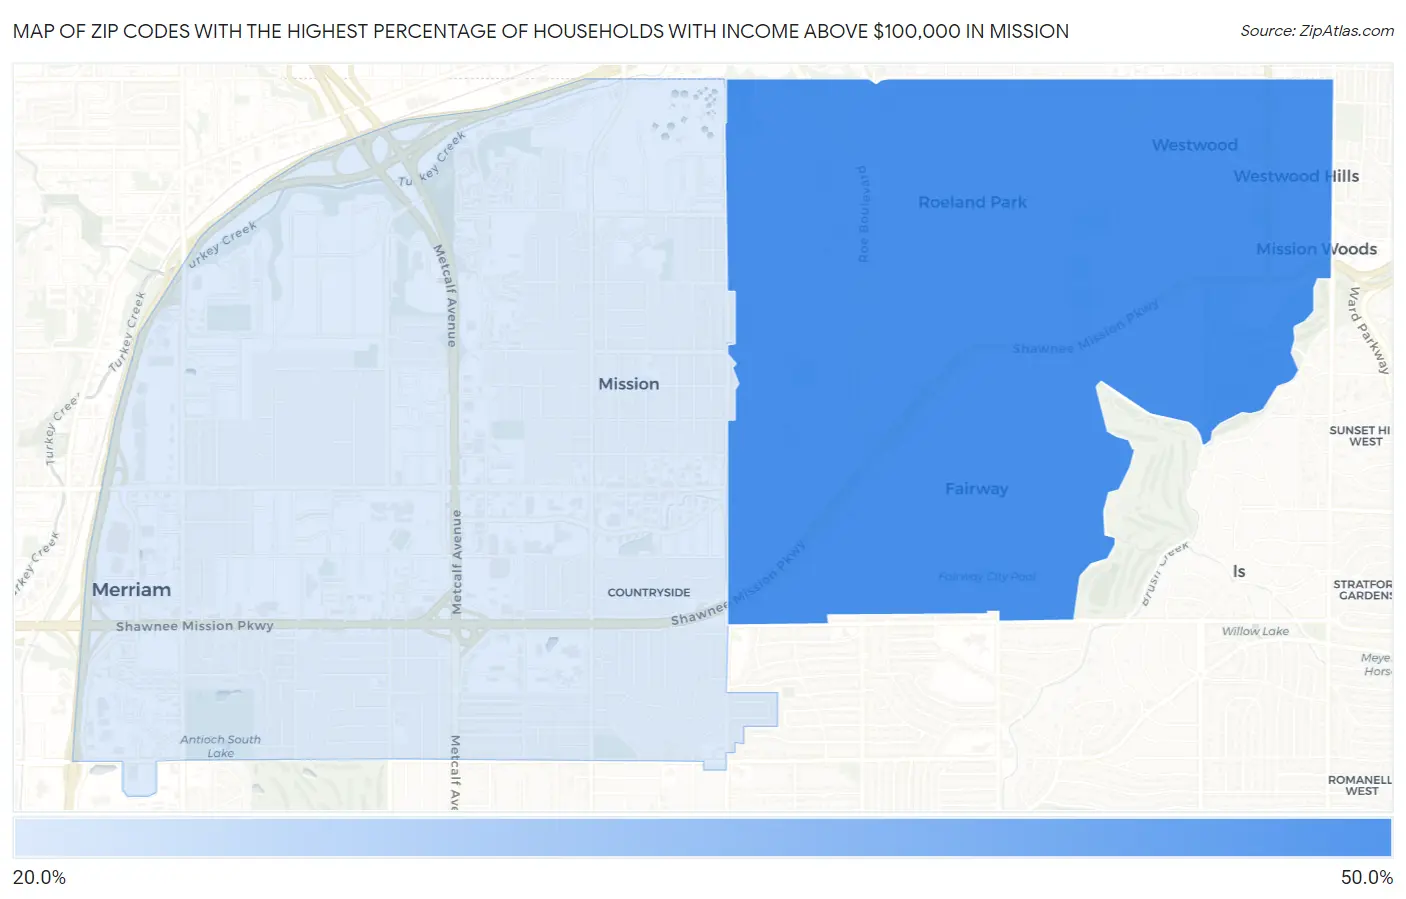
Map of Zip Codes with the Highest Percentage of Households with Income Above $100,000 in Mission
29.3%
49.5%
Zip Codes with the Highest Percentage of Households with Income Above $100,000 in Mission, KS
| Zip Code | Households with Income > $100k | vs State | vs National | |
| 1. | 66205 | 49.5% | 33.0%(+16.5)#54 | 37.3%(+12.2)#5,021 |
| 2. | 66202 | 29.3% | 33.0%(-3.70)#276 | 37.3%(-8.00)#16,009 |
1
Common Questions
What are the Top Zip Codes with the Highest Percentage of Households with Income Above $100,000 in Mission, KS?
Top Zip Codes with the Highest Percentage of Households with Income Above $100,000 in Mission, KS are:
What zip code has the Highest Percentage of Households with Income Above $100,000 in Mission, KS?
66205 has the Highest Percentage of Households with Income Above $100,000 in Mission, KS with 49.5%.
What is the Percentage of Households with Income Above $100,000 in Mission, KS?
Percentage of Households with Income Above $100,000 in Mission is 32.6%.
What is the Percentage of Households with Income Above $100,000 in Kansas?
Percentage of Households with Income Above $100,000 in Kansas is 33.0%.
What is the Percentage of Households with Income Above $100,000 in the United States?
Percentage of Households with Income Above $100,000 in the United States is 37.3%.