Zip Codes with the Highest Percentage of Households with Income Above $100,000 in Lenexa, KS
RELATED REPORTS & OPTIONS
Household Income | $100k+
Lenexa
Compare Zip Codes
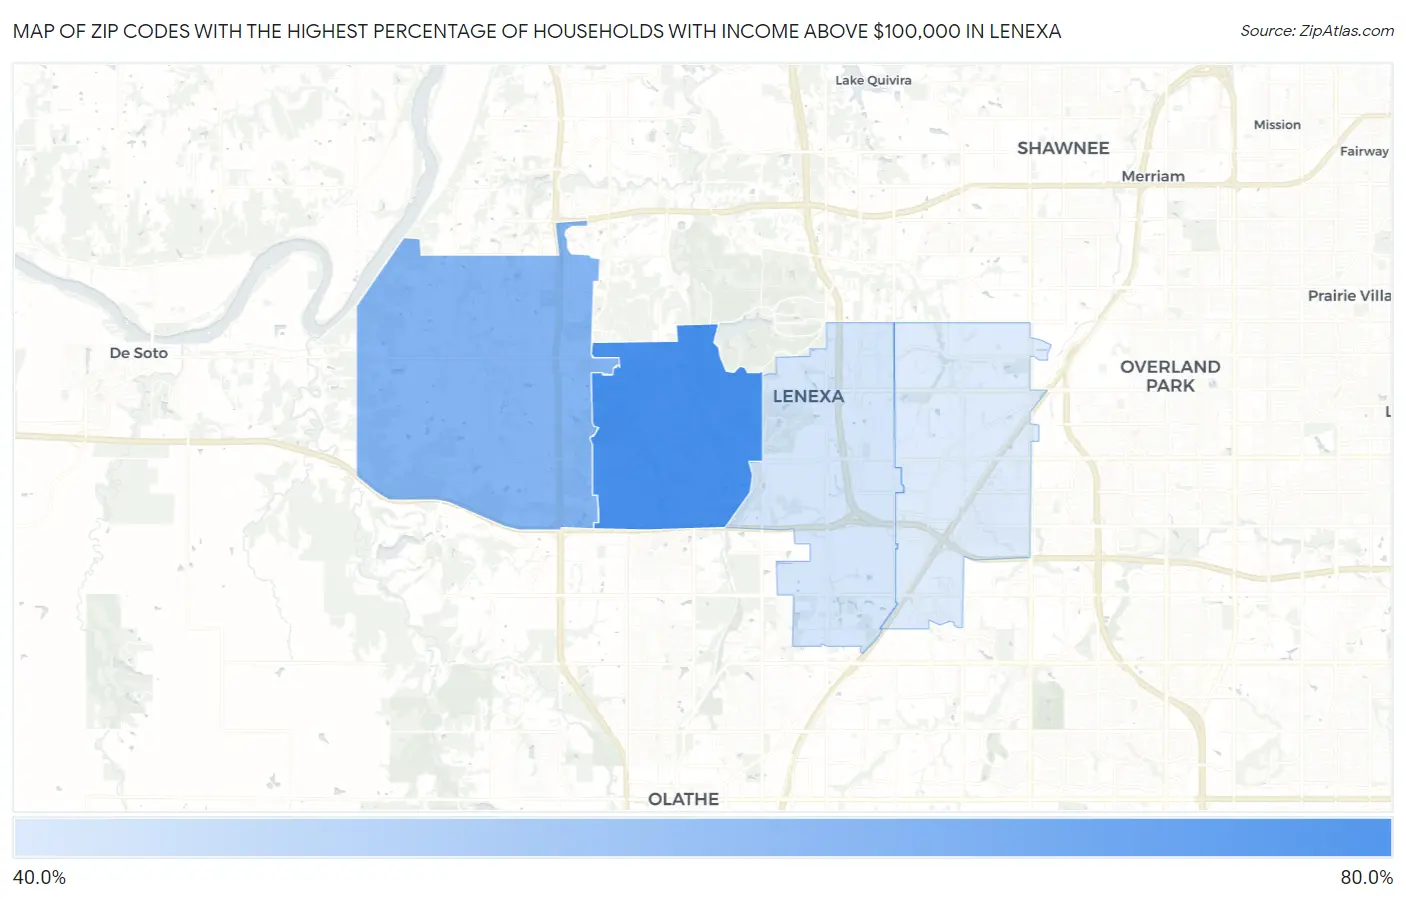
Map of Zip Codes with the Highest Percentage of Households with Income Above $100,000 in Lenexa
42.5%
79.5%
Zip Codes with the Highest Percentage of Households with Income Above $100,000 in Lenexa, KS
| Zip Code | Households with Income > $100k | vs State | vs National | |
| 1. | 66220 | 79.5% | 33.0%(+46.5)#4 | 37.3%(+42.2)#362 |
| 2. | 66227 | 63.8% | 33.0%(+30.8)#13 | 37.3%(+26.5)#1,717 |
| 3. | 66219 | 44.4% | 33.0%(+11.4)#72 | 37.3%(+7.10)#6,857 |
| 4. | 66215 | 42.5% | 33.0%(+9.50)#90 | 37.3%(+5.20)#7,669 |
1
Common Questions
What are the Top 3 Zip Codes with the Highest Percentage of Households with Income Above $100,000 in Lenexa, KS?
Top 3 Zip Codes with the Highest Percentage of Households with Income Above $100,000 in Lenexa, KS are:
What zip code has the Highest Percentage of Households with Income Above $100,000 in Lenexa, KS?
66220 has the Highest Percentage of Households with Income Above $100,000 in Lenexa, KS with 79.5%.
What is the Percentage of Households with Income Above $100,000 in Lenexa, KS?
Percentage of Households with Income Above $100,000 in Lenexa is 50.7%.
What is the Percentage of Households with Income Above $100,000 in Kansas?
Percentage of Households with Income Above $100,000 in Kansas is 33.0%.
What is the Percentage of Households with Income Above $100,000 in the United States?
Percentage of Households with Income Above $100,000 in the United States is 37.3%.