Zip Codes with the Highest Percentage of Households with Income Above $100,000 in Topeka, KS
RELATED REPORTS & OPTIONS
Household Income | $100k+
Topeka
Compare Zip Codes
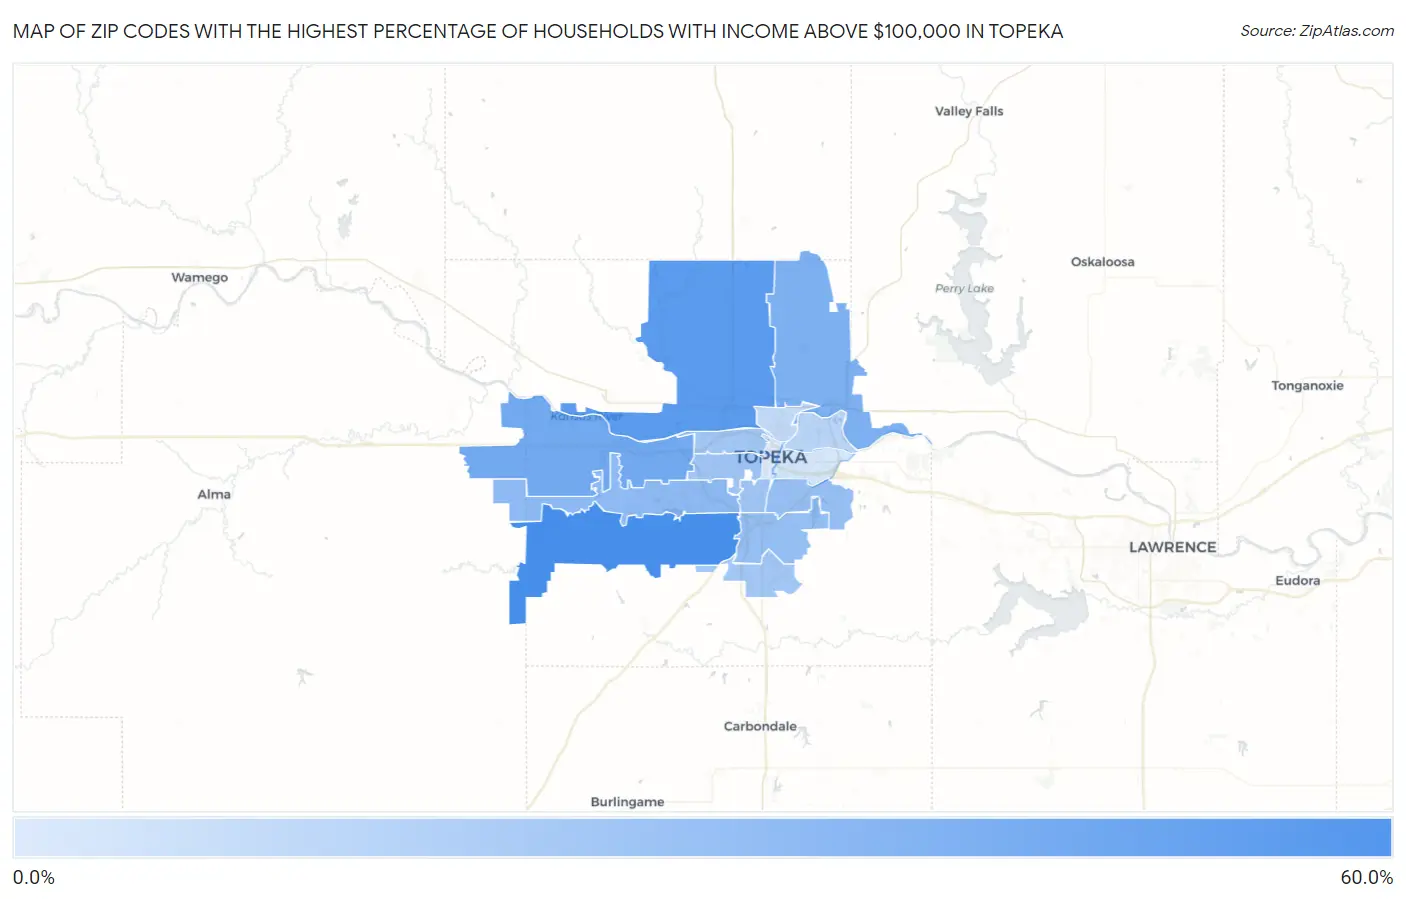
Map of Zip Codes with the Highest Percentage of Households with Income Above $100,000 in Topeka
4.8%
58.5%
Zip Codes with the Highest Percentage of Households with Income Above $100,000 in Topeka, KS
| Zip Code | Households with Income > $100k | vs State | vs National | |
| 1. | 66610 | 58.5% | 33.0%(+25.5)#23 | 37.3%(+21.2)#2,663 |
| 2. | 66618 | 51.1% | 33.0%(+18.1)#47 | 37.3%(+13.8)#4,515 |
| 3. | 66615 | 40.8% | 33.0%(+7.80)#113 | 37.3%(+3.50)#8,525 |
| 4. | 66617 | 37.1% | 33.0%(+4.10)#152 | 37.3%(-0.200)#10,492 |
| 5. | 66614 | 29.9% | 33.0%(-3.10)#266 | 37.3%(-7.40)#15,513 |
| 6. | 66609 | 27.3% | 33.0%(-5.70)#312 | 37.3%(-10.00)#17,725 |
| 7. | 66605 | 27.0% | 33.0%(-6.00)#321 | 37.3%(-10.3)#17,992 |
| 8. | 66611 | 23.8% | 33.0%(-9.20)#393 | 37.3%(-13.5)#20,832 |
| 9. | 66604 | 23.3% | 33.0%(-9.70)#410 | 37.3%(-14.0)#21,314 |
| 10. | 66619 | 22.6% | 33.0%(-10.4)#421 | 37.3%(-14.7)#21,924 |
| 11. | 66606 | 22.5% | 33.0%(-10.5)#422 | 37.3%(-14.8)#21,985 |
| 12. | 66616 | 15.3% | 33.0%(-17.7)#580 | 37.3%(-22.0)#27,376 |
| 13. | 66608 | 12.9% | 33.0%(-20.1)#612 | 37.3%(-24.4)#28,633 |
| 14. | 66607 | 6.5% | 33.0%(-26.5)#665 | 37.3%(-30.8)#30,770 |
| 15. | 66612 | 5.3% | 33.0%(-27.7)#669 | 37.3%(-32.0)#30,997 |
| 16. | 66603 | 4.8% | 33.0%(-28.2)#671 | 37.3%(-32.5)#31,093 |
1
Common Questions
What are the Top 10 Zip Codes with the Highest Percentage of Households with Income Above $100,000 in Topeka, KS?
Top 10 Zip Codes with the Highest Percentage of Households with Income Above $100,000 in Topeka, KS are:
What zip code has the Highest Percentage of Households with Income Above $100,000 in Topeka, KS?
66610 has the Highest Percentage of Households with Income Above $100,000 in Topeka, KS with 58.5%.
What is the Percentage of Households with Income Above $100,000 in Topeka, KS?
Percentage of Households with Income Above $100,000 in Topeka is 22.5%.
What is the Percentage of Households with Income Above $100,000 in Kansas?
Percentage of Households with Income Above $100,000 in Kansas is 33.0%.
What is the Percentage of Households with Income Above $100,000 in the United States?
Percentage of Households with Income Above $100,000 in the United States is 37.3%.