Scottish Male Disability
COMPARE
Scottish
Select to Compare
Male Disability
Scottish Male Disability
12.8%
DISABILITY | MALES
0.0/ 100
METRIC RATING
286th/ 347
METRIC RANK
Scottish Male Disability Correlation Chart
The statistical analysis conducted on geographies consisting of 566,868,484 people shows a significant positive correlation between the proportion of Scottish and percentage of males with a disability in the United States with a correlation coefficient (R) of 0.632 and weighted average of 12.8%. On average, for every 1% (one percent) increase in Scottish within a typical geography, there is an increase of 0.75% in percentage of males with a disability.
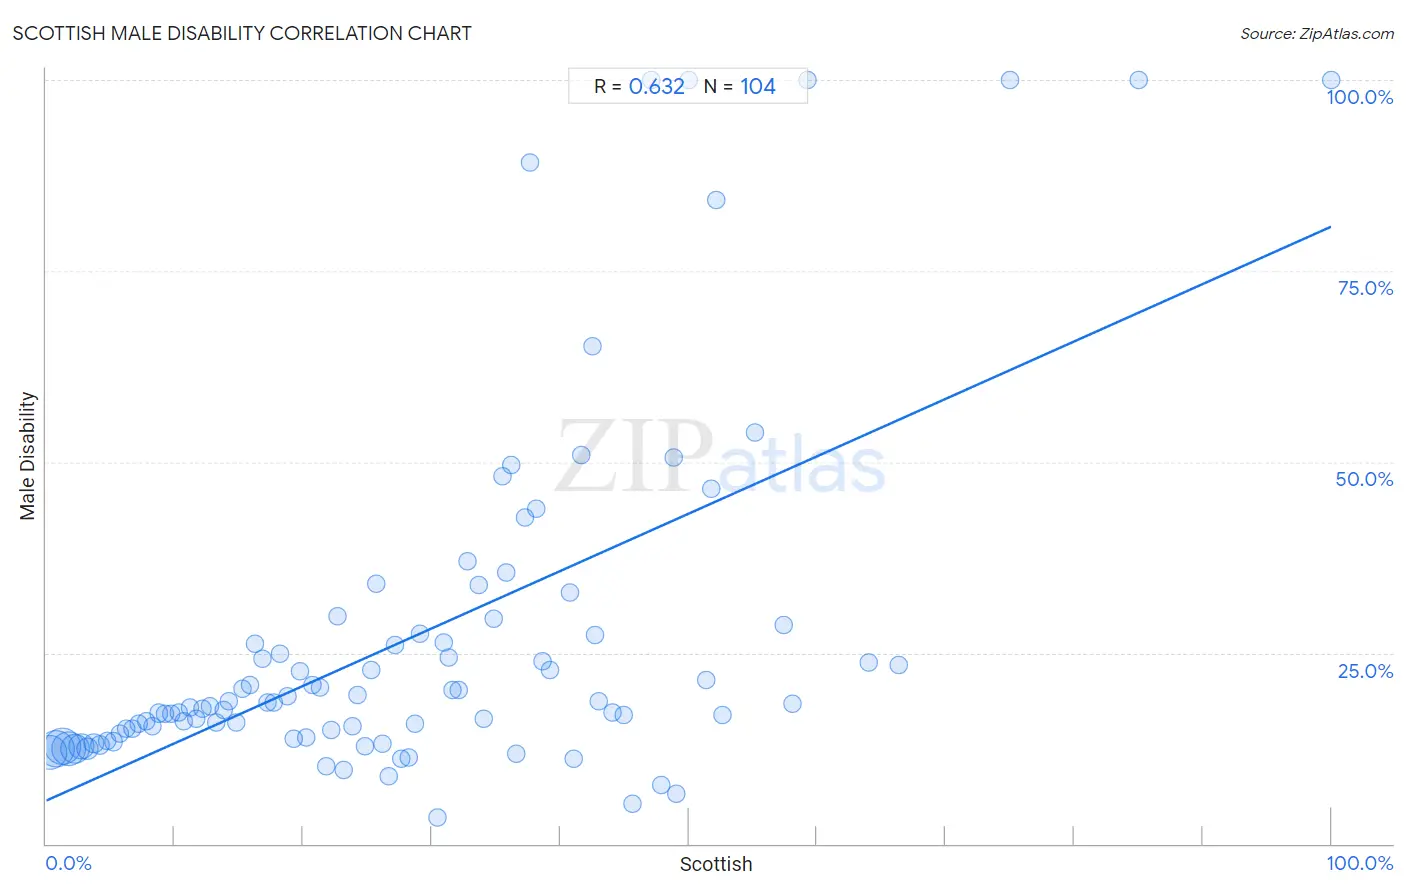
It is essential to understand that the correlation between the percentage of Scottish and percentage of males with a disability does not imply a direct cause-and-effect relationship. It remains uncertain whether the presence of Scottish influences an upward or downward trend in the level of percentage of males with a disability within an area, or if Scottish simply ended up residing in those areas with higher or lower levels of percentage of males with a disability due to other factors.
Demographics Similar to Scottish by Male Disability
In terms of male disability, the demographic groups most similar to Scottish are Welsh (12.7%, a difference of 0.050%), Spanish (12.7%, a difference of 0.060%), Cape Verdean (12.8%, a difference of 0.070%), Yup'ik (12.8%, a difference of 0.26%), and German (12.7%, a difference of 0.32%).
| Demographics | Rating | Rank | Male Disability |
| Slovaks | 0.0 /100 | #279 | Tragic 12.7% |
| Dutch | 0.0 /100 | #280 | Tragic 12.7% |
| Sioux | 0.0 /100 | #281 | Tragic 12.7% |
| Irish | 0.0 /100 | #282 | Tragic 12.7% |
| Germans | 0.0 /100 | #283 | Tragic 12.7% |
| Spanish | 0.0 /100 | #284 | Tragic 12.7% |
| Welsh | 0.0 /100 | #285 | Tragic 12.7% |
| Scottish | 0.0 /100 | #286 | Tragic 12.8% |
| Cape Verdeans | 0.0 /100 | #287 | Tragic 12.8% |
| Yup'ik | 0.0 /100 | #288 | Tragic 12.8% |
| Immigrants from Cabo Verde | 0.0 /100 | #289 | Tragic 12.8% |
| Pima | 0.0 /100 | #290 | Tragic 12.8% |
| Whites/Caucasians | 0.0 /100 | #291 | Tragic 12.8% |
| English | 0.0 /100 | #292 | Tragic 12.8% |
| Yaqui | 0.0 /100 | #293 | Tragic 12.9% |
Scottish Male Disability Correlation Summary
| Measurement | Scottish Data | Male Disability Data |
| Minimum | 0.27% | 3.4% |
| Maximum | 100.0% | 100.0% |
| Range | 99.7% | 96.6% |
| Mean | 28.4% | 27.0% |
| Median | 25.9% | 18.4% |
| Interquartile 25% (IQ1) | 13.0% | 14.2% |
| Interquartile 75% (IQ3) | 40.9% | 27.4% |
| Interquartile Range (IQR) | 27.9% | 13.2% |
| Standard Deviation (Sample) | 19.4% | 23.1% |
| Standard Deviation (Population) | 19.3% | 23.0% |
Correlation Details
| Scottish Percentile | Sample Size | Male Disability |
[ 0.0% - 0.5% ] 0.27% | 94,996,947 | 12.0% |
[ 0.5% - 1.0% ] 0.76% | 108,277,937 | 12.4% |
[ 1.0% - 1.5% ] 1.26% | 108,163,883 | 12.7% |
[ 1.5% - 2.0% ] 1.73% | 94,496,599 | 12.4% |
[ 2.0% - 2.5% ] 2.23% | 64,737,238 | 12.5% |
[ 2.5% - 3.0% ] 2.74% | 41,677,726 | 12.8% |
[ 3.0% - 3.5% ] 3.23% | 22,108,479 | 12.5% |
[ 3.5% - 4.0% ] 3.72% | 12,948,659 | 13.2% |
[ 4.0% - 4.5% ] 4.21% | 7,750,880 | 12.9% |
[ 4.5% - 5.0% ] 4.72% | 4,083,914 | 13.5% |
[ 5.0% - 5.5% ] 5.22% | 2,495,537 | 13.4% |
[ 5.5% - 6.0% ] 5.71% | 1,510,984 | 14.5% |
[ 6.0% - 6.5% ] 6.22% | 875,015 | 15.0% |
[ 6.5% - 7.0% ] 6.72% | 630,688 | 15.1% |
[ 7.0% - 7.5% ] 7.23% | 467,592 | 15.7% |
[ 7.5% - 8.0% ] 7.74% | 291,197 | 16.0% |
[ 8.0% - 8.5% ] 8.23% | 339,831 | 15.4% |
[ 8.5% - 9.0% ] 8.78% | 180,840 | 17.1% |
[ 9.0% - 9.5% ] 9.22% | 136,937 | 17.1% |
[ 9.5% - 10.0% ] 9.73% | 106,234 | 17.0% |
[ 10.0% - 10.5% ] 10.26% | 76,460 | 17.3% |
[ 10.5% - 11.0% ] 10.73% | 92,377 | 16.0% |
[ 11.0% - 11.5% ] 11.22% | 67,080 | 17.8% |
[ 11.5% - 12.0% ] 11.70% | 43,266 | 16.4% |
[ 12.0% - 12.5% ] 12.21% | 47,406 | 17.7% |
[ 12.5% - 13.0% ] 12.71% | 41,905 | 18.0% |
[ 13.0% - 13.5% ] 13.22% | 21,732 | 15.8% |
[ 13.5% - 14.0% ] 13.79% | 19,749 | 17.5% |
[ 14.0% - 14.5% ] 14.22% | 19,255 | 18.6% |
[ 14.5% - 15.0% ] 14.81% | 28,570 | 15.8% |
[ 15.0% - 15.5% ] 15.25% | 11,405 | 20.3% |
[ 15.5% - 16.0% ] 15.83% | 17,761 | 20.8% |
[ 16.0% - 16.5% ] 16.23% | 4,670 | 26.2% |
[ 16.5% - 17.0% ] 16.79% | 4,480 | 24.3% |
[ 17.0% - 17.5% ] 17.21% | 5,520 | 18.5% |
[ 17.5% - 18.0% ] 17.68% | 11,228 | 18.5% |
[ 18.0% - 18.5% ] 18.20% | 7,087 | 24.9% |
[ 18.5% - 19.0% ] 18.74% | 8,190 | 19.4% |
[ 19.0% - 19.5% ] 19.26% | 3,862 | 13.7% |
[ 19.5% - 20.0% ] 19.75% | 9,764 | 22.6% |
[ 20.0% - 20.5% ] 20.19% | 2,457 | 14.0% |
[ 20.5% - 21.0% ] 20.75% | 5,947 | 20.8% |
[ 21.0% - 21.5% ] 21.30% | 1,549 | 20.5% |
[ 21.5% - 22.0% ] 21.82% | 4,491 | 10.2% |
[ 22.0% - 22.5% ] 22.22% | 819 | 14.9% |
[ 22.5% - 23.0% ] 22.69% | 3,059 | 29.8% |
[ 23.0% - 23.5% ] 23.20% | 1,539 | 9.7% |
[ 23.5% - 24.0% ] 23.83% | 2,379 | 15.3% |
[ 24.0% - 24.5% ] 24.25% | 367 | 19.4% |
[ 24.5% - 25.0% ] 24.84% | 479 | 12.7% |
[ 25.0% - 25.5% ] 25.31% | 2,276 | 22.7% |
[ 25.5% - 26.0% ] 25.71% | 1,945 | 34.0% |
[ 26.0% - 26.5% ] 26.13% | 727 | 13.1% |
[ 26.5% - 27.0% ] 26.69% | 2,008 | 8.8% |
[ 27.0% - 27.5% ] 27.11% | 343 | 26.0% |
[ 27.5% - 28.0% ] 27.65% | 698 | 11.2% |
[ 28.0% - 28.5% ] 28.23% | 921 | 11.4% |
[ 28.5% - 29.0% ] 28.68% | 1,231 | 15.6% |
[ 29.0% - 29.5% ] 29.07% | 853 | 27.5% |
[ 30.0% - 30.5% ] 30.43% | 115 | 3.4% |
[ 30.5% - 31.0% ] 30.91% | 110 | 26.3% |
[ 31.0% - 31.5% ] 31.30% | 1,882 | 24.5% |
[ 31.5% - 32.0% ] 31.62% | 1,559 | 20.1% |
[ 32.0% - 32.5% ] 32.09% | 748 | 20.1% |
[ 32.5% - 33.0% ] 32.79% | 305 | 37.0% |
[ 33.5% - 34.0% ] 33.64% | 217 | 33.9% |
[ 34.0% - 34.5% ] 34.04% | 1,137 | 16.4% |
[ 34.5% - 35.0% ] 34.84% | 1,346 | 29.4% |
[ 35.0% - 35.5% ] 35.50% | 231 | 48.1% |
[ 35.5% - 36.0% ] 35.80% | 176 | 35.5% |
[ 36.0% - 36.5% ] 36.18% | 246 | 49.6% |
[ 36.5% - 37.0% ] 36.56% | 279 | 11.8% |
[ 37.0% - 37.5% ] 37.27% | 322 | 42.8% |
[ 37.5% - 38.0% ] 37.66% | 154 | 89.2% |
[ 38.0% - 38.5% ] 38.14% | 388 | 43.9% |
[ 38.5% - 39.0% ] 38.61% | 101 | 23.9% |
[ 39.0% - 39.5% ] 39.16% | 143 | 22.8% |
[ 40.5% - 41.0% ] 40.76% | 238 | 32.9% |
[ 41.0% - 41.5% ] 41.01% | 278 | 11.1% |
[ 41.5% - 42.0% ] 41.59% | 226 | 50.9% |
[ 42.0% - 42.5% ] 42.50% | 80 | 65.2% |
[ 42.5% - 43.0% ] 42.67% | 675 | 27.4% |
[ 43.0% - 43.5% ] 43.02% | 172 | 18.6% |
[ 44.0% - 44.5% ] 44.07% | 59 | 17.2% |
[ 44.5% - 45.0% ] 44.92% | 492 | 16.9% |
[ 45.5% - 46.0% ] 45.59% | 465 | 5.3% |
[ 47.0% - 47.5% ] 47.06% | 17 | 100.0% |
[ 47.5% - 48.0% ] 47.83% | 46 | 7.7% |
[ 48.5% - 49.0% ] 48.87% | 354 | 50.6% |
[ 49.0% - 49.5% ] 49.00% | 451 | 6.5% |
[ 50.0% - 50.5% ] 50.00% | 218 | 100.0% |
[ 51.0% - 51.5% ] 51.38% | 654 | 21.5% |
[ 51.5% - 52.0% ] 51.72% | 174 | 46.5% |
[ 52.0% - 52.5% ] 52.17% | 69 | 84.2% |
[ 52.5% - 53.0% ] 52.66% | 188 | 16.9% |
[ 55.0% - 55.5% ] 55.15% | 136 | 53.8% |
[ 57.0% - 57.5% ] 57.42% | 472 | 28.7% |
[ 58.0% - 58.5% ] 58.05% | 174 | 18.3% |
[ 59.0% - 59.5% ] 59.26% | 54 | 100.0% |
[ 64.0% - 64.5% ] 64.00% | 75 | 23.8% |
[ 66.0% - 66.5% ] 66.33% | 196 | 23.3% |
[ 75.0% - 75.5% ] 75.00% | 32 | 100.0% |
[ 85.0% - 85.5% ] 85.00% | 40 | 100.0% |
[ 99.5% - 100.0% ] 100.00% | 18 | 100.0% |