Scottish Disability Age 5 to 17
COMPARE
Scottish
Select to Compare
Disability Age 5 to 17
Scottish Disability Age 5 to 17
6.1%
DISABILITY | AGE 5 TO 17
0.0/ 100
METRIC RATING
281st/ 347
METRIC RANK
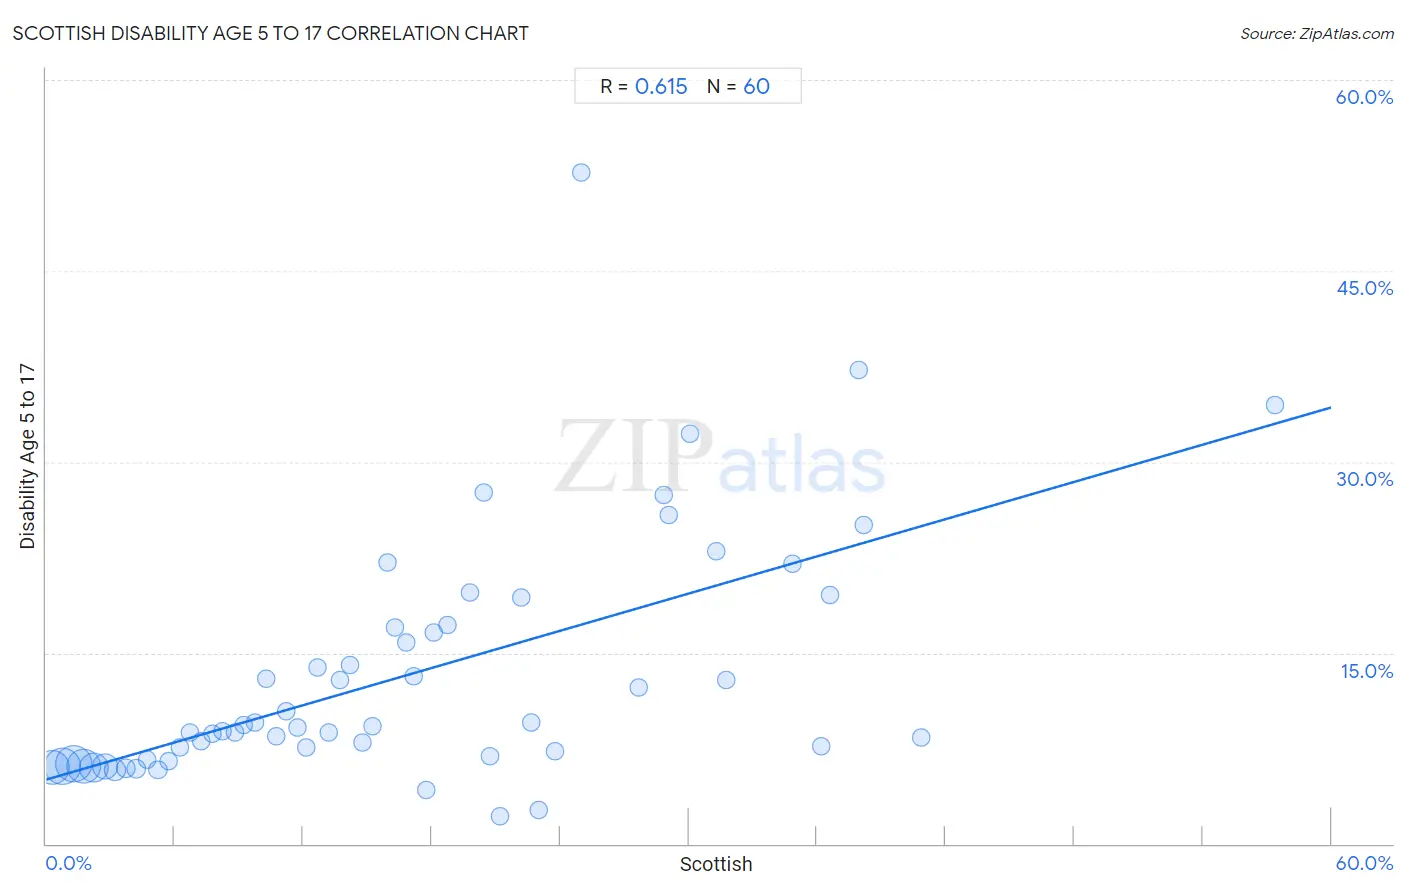
Scottish Disability Age 5 to 17 Correlation Chart
The statistical analysis conducted on geographies consisting of 553,365,795 people shows a significant positive correlation between the proportion of Scottish and percentage of population with a disability between the ages 5 and 17 in the United States with a correlation coefficient (R) of 0.615 and weighted average of 6.1%. On average, for every 1% (one percent) increase in Scottish within a typical geography, there is an increase of 0.49% in percentage of population with a disability between the ages 5 and 17.
It is essential to understand that the correlation between the percentage of Scottish and percentage of population with a disability between the ages 5 and 17 does not imply a direct cause-and-effect relationship. It remains uncertain whether the presence of Scottish influences an upward or downward trend in the level of percentage of population with a disability between the ages 5 and 17 within an area, or if Scottish simply ended up residing in those areas with higher or lower levels of percentage of population with a disability between the ages 5 and 17 due to other factors.
Demographics Similar to Scottish by Disability Age 5 to 17
In terms of disability age 5 to 17, the demographic groups most similar to Scottish are Portuguese (6.1%, a difference of 0.25%), German (6.1%, a difference of 0.25%), Immigrants from Jamaica (6.1%, a difference of 0.39%), Ugandan (6.2%, a difference of 0.41%), and Subsaharan African (6.2%, a difference of 0.44%).
| Demographics | Rating | Rank | Disability Age 5 to 17 |
| Cheyenne | 0.2 /100 | #274 | Tragic 6.0% |
| Dutch | 0.2 /100 | #275 | Tragic 6.0% |
| Japanese | 0.1 /100 | #276 | Tragic 6.1% |
| Puget Sound Salish | 0.1 /100 | #277 | Tragic 6.1% |
| Immigrants from Liberia | 0.1 /100 | #278 | Tragic 6.1% |
| Immigrants from Jamaica | 0.1 /100 | #279 | Tragic 6.1% |
| Portuguese | 0.1 /100 | #280 | Tragic 6.1% |
| Scottish | 0.0 /100 | #281 | Tragic 6.1% |
| Germans | 0.0 /100 | #282 | Tragic 6.1% |
| Ugandans | 0.0 /100 | #283 | Tragic 6.2% |
| Sub-Saharan Africans | 0.0 /100 | #284 | Tragic 6.2% |
| English | 0.0 /100 | #285 | Tragic 6.2% |
| Colville | 0.0 /100 | #286 | Tragic 6.2% |
| Pima | 0.0 /100 | #287 | Tragic 6.2% |
| Jamaicans | 0.0 /100 | #288 | Tragic 6.2% |
Scottish Disability Age 5 to 17 Correlation Summary
| Measurement | Scottish Data | Disability Age 5 to 17 Data |
| Minimum | 0.27% | 2.1% |
| Maximum | 57.4% | 52.7% |
| Range | 57.1% | 50.6% |
| Mean | 17.0% | 13.3% |
| Median | 15.0% | 9.1% |
| Interquartile 25% (IQ1) | 7.5% | 6.8% |
| Interquartile 75% (IQ3) | 23.4% | 17.1% |
| Interquartile Range (IQR) | 15.9% | 10.3% |
| Standard Deviation (Sample) | 12.1% | 9.6% |
| Standard Deviation (Population) | 12.0% | 9.5% |
Correlation Details
| Scottish Percentile | Sample Size | Disability Age 5 to 17 |
[ 0.0% - 0.5% ] 0.27% | 93,334,741 | 6.0% |
[ 0.5% - 1.0% ] 0.76% | 106,094,240 | 6.1% |
[ 1.0% - 1.5% ] 1.26% | 106,390,966 | 6.3% |
[ 1.5% - 2.0% ] 1.73% | 92,832,157 | 6.1% |
[ 2.0% - 2.5% ] 2.23% | 63,304,493 | 6.0% |
[ 2.5% - 3.0% ] 2.74% | 40,682,286 | 6.0% |
[ 3.0% - 3.5% ] 3.23% | 21,323,737 | 5.8% |
[ 3.5% - 4.0% ] 3.71% | 12,120,559 | 5.9% |
[ 4.0% - 4.5% ] 4.21% | 7,320,943 | 5.9% |
[ 4.5% - 5.0% ] 4.72% | 3,705,028 | 6.6% |
[ 5.0% - 5.5% ] 5.22% | 2,203,916 | 5.8% |
[ 5.5% - 6.0% ] 5.71% | 1,325,622 | 6.5% |
[ 6.0% - 6.5% ] 6.22% | 714,377 | 7.5% |
[ 6.5% - 7.0% ] 6.71% | 536,457 | 8.7% |
[ 7.0% - 7.5% ] 7.23% | 373,887 | 8.1% |
[ 7.5% - 8.0% ] 7.74% | 216,647 | 8.6% |
[ 8.0% - 8.5% ] 8.24% | 254,305 | 8.8% |
[ 8.5% - 9.0% ] 8.80% | 136,477 | 8.7% |
[ 9.0% - 9.5% ] 9.23% | 95,040 | 9.4% |
[ 9.5% - 10.0% ] 9.73% | 73,819 | 9.6% |
[ 10.0% - 10.5% ] 10.26% | 44,851 | 13.0% |
[ 10.5% - 11.0% ] 10.74% | 64,378 | 8.4% |
[ 11.0% - 11.5% ] 11.22% | 42,831 | 10.4% |
[ 11.5% - 12.0% ] 11.71% | 23,434 | 9.1% |
[ 12.0% - 12.5% ] 12.16% | 31,813 | 7.6% |
[ 12.5% - 13.0% ] 12.67% | 27,819 | 13.8% |
[ 13.0% - 13.5% ] 13.20% | 7,838 | 8.7% |
[ 13.5% - 14.0% ] 13.71% | 6,937 | 12.8% |
[ 14.0% - 14.5% ] 14.20% | 11,872 | 14.0% |
[ 14.5% - 15.0% ] 14.77% | 14,309 | 8.0% |
[ 15.0% - 15.5% ] 15.24% | 3,543 | 9.2% |
[ 15.5% - 16.0% ] 15.92% | 8,745 | 22.1% |
[ 16.0% - 16.5% ] 16.29% | 1,793 | 16.9% |
[ 16.5% - 17.0% ] 16.81% | 3,403 | 15.8% |
[ 17.0% - 17.5% ] 17.18% | 1,618 | 13.2% |
[ 17.5% - 18.0% ] 17.74% | 5,417 | 4.2% |
[ 18.0% - 18.5% ] 18.08% | 1,648 | 16.6% |
[ 18.5% - 19.0% ] 18.74% | 6,414 | 17.2% |
[ 19.5% - 20.0% ] 19.80% | 5,105 | 19.7% |
[ 20.0% - 20.5% ] 20.41% | 196 | 27.6% |
[ 20.5% - 21.0% ] 20.73% | 4,785 | 6.9% |
[ 21.0% - 21.5% ] 21.18% | 373 | 2.1% |
[ 22.0% - 22.5% ] 22.19% | 329 | 19.4% |
[ 22.5% - 23.0% ] 22.64% | 106 | 9.5% |
[ 23.0% - 23.5% ] 23.02% | 443 | 2.7% |
[ 23.5% - 24.0% ] 23.73% | 788 | 7.3% |
[ 25.0% - 25.5% ] 25.00% | 136 | 52.7% |
[ 27.5% - 28.0% ] 27.64% | 123 | 12.2% |
[ 28.5% - 29.0% ] 28.82% | 340 | 27.4% |
[ 29.0% - 29.5% ] 29.06% | 702 | 25.9% |
[ 30.0% - 30.5% ] 30.08% | 369 | 32.3% |
[ 31.0% - 31.5% ] 31.31% | 1,581 | 22.9% |
[ 31.5% - 32.0% ] 31.78% | 214 | 12.9% |
[ 34.5% - 35.0% ] 34.84% | 442 | 22.0% |
[ 36.0% - 36.5% ] 36.21% | 116 | 7.7% |
[ 36.5% - 37.0% ] 36.57% | 216 | 19.6% |
[ 37.5% - 38.0% ] 37.93% | 406 | 37.2% |
[ 38.0% - 38.5% ] 38.17% | 241 | 25.0% |
[ 40.5% - 41.0% ] 40.86% | 93 | 8.3% |
[ 57.0% - 57.5% ] 57.40% | 331 | 34.5% |