Scottish Wage/Income Gap
COMPARE
Scottish
Select to Compare
Wage/Income Gap
Scottish Wage/Income Gap
29.1%
WAGE/INCOME GAP
0.0/ 100
METRIC RATING
329th/ 347
METRIC RANK
Scottish Wage/Income Gap Correlation Chart
The statistical analysis conducted on geographies consisting of 564,295,282 people shows a slight positive correlation between the proportion of Scottish and wage/income gap percentage in the United States with a correlation coefficient (R) of 0.099 and weighted average of 29.1%. On average, for every 1% (one percent) increase in Scottish within a typical geography, there is an increase of 0.095% in wage/income gap percentage.
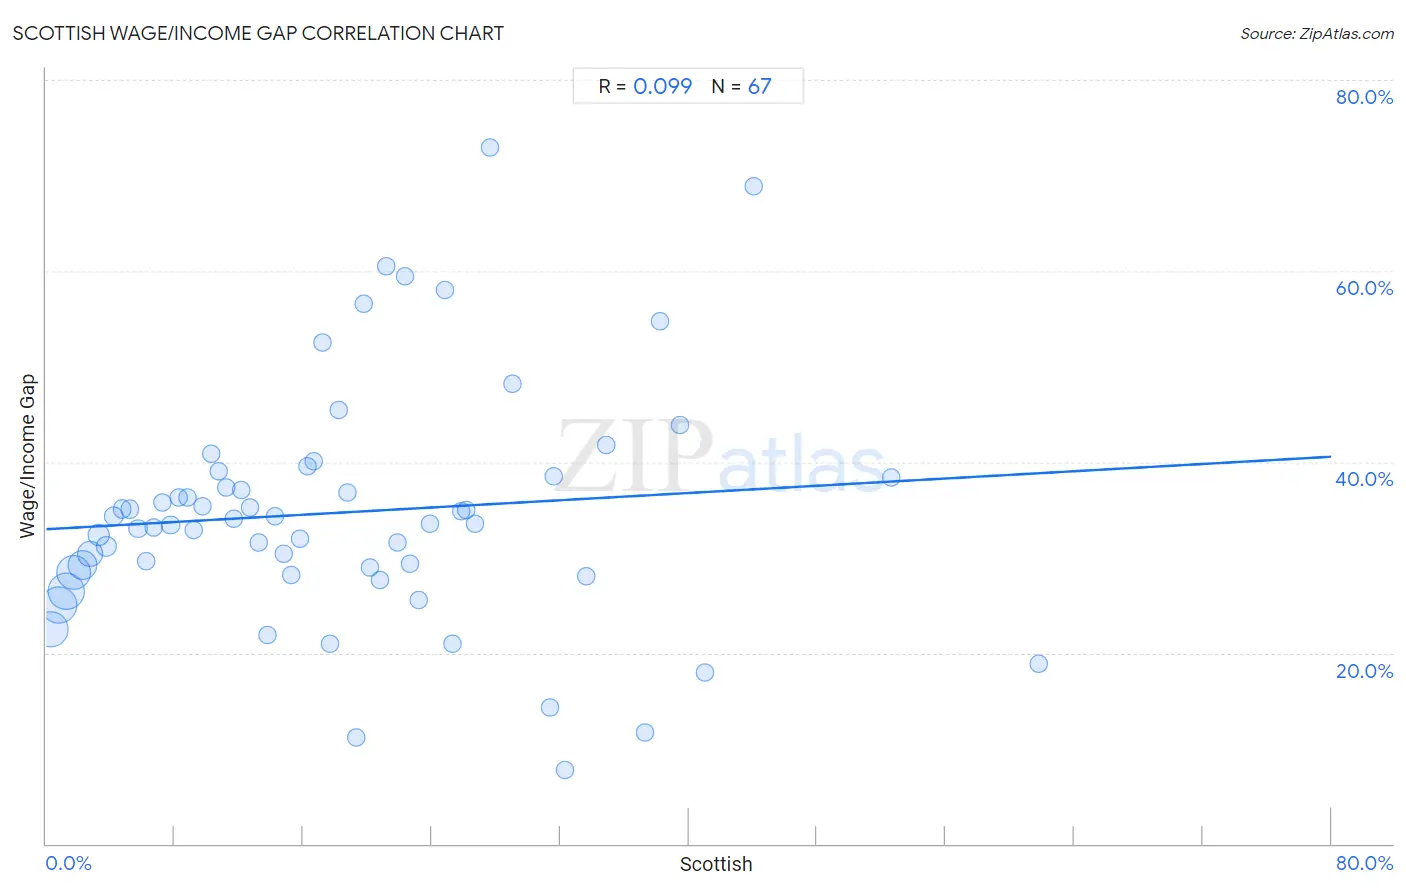
It is essential to understand that the correlation between the percentage of Scottish and wage/income gap percentage does not imply a direct cause-and-effect relationship. It remains uncertain whether the presence of Scottish influences an upward or downward trend in the level of wage/income gap percentage within an area, or if Scottish simply ended up residing in those areas with higher or lower levels of wage/income gap percentage due to other factors.
Demographics Similar to Scottish by Wage/Income Gap
In terms of wage/income gap, the demographic groups most similar to Scottish are German (29.2%, a difference of 0.10%), Scandinavian (29.1%, a difference of 0.14%), Czech (29.2%, a difference of 0.15%), Immigrants from Iran (29.1%, a difference of 0.20%), and Immigrants from Belgium (29.0%, a difference of 0.31%).
| Demographics | Rating | Rank | Wage/Income Gap |
| Immigrants from Singapore | 0.1 /100 | #322 | Tragic 28.9% |
| Norwegians | 0.1 /100 | #323 | Tragic 29.0% |
| Croatians | 0.0 /100 | #324 | Tragic 29.0% |
| Hungarians | 0.0 /100 | #325 | Tragic 29.0% |
| Immigrants from Belgium | 0.0 /100 | #326 | Tragic 29.0% |
| Immigrants from Iran | 0.0 /100 | #327 | Tragic 29.1% |
| Scandinavians | 0.0 /100 | #328 | Tragic 29.1% |
| Scottish | 0.0 /100 | #329 | Tragic 29.1% |
| Germans | 0.0 /100 | #330 | Tragic 29.2% |
| Czechs | 0.0 /100 | #331 | Tragic 29.2% |
| Immigrants from South Central Asia | 0.0 /100 | #332 | Tragic 29.3% |
| Europeans | 0.0 /100 | #333 | Tragic 29.4% |
| Swedes | 0.0 /100 | #334 | Tragic 29.4% |
| Immigrants from Taiwan | 0.0 /100 | #335 | Tragic 29.5% |
| English | 0.0 /100 | #336 | Tragic 29.5% |
Scottish Wage/Income Gap Correlation Summary
| Measurement | Scottish Data | Wage/Income Gap Data |
| Minimum | 0.27% | 7.8% |
| Maximum | 61.8% | 73.0% |
| Range | 61.5% | 65.2% |
| Mean | 18.5% | 34.7% |
| Median | 16.7% | 33.5% |
| Interquartile 25% (IQ1) | 8.2% | 28.4% |
| Interquartile 75% (IQ3) | 25.8% | 38.5% |
| Interquartile Range (IQR) | 17.6% | 10.1% |
| Standard Deviation (Sample) | 13.0% | 12.5% |
| Standard Deviation (Population) | 12.9% | 12.4% |
Correlation Details
| Scottish Percentile | Sample Size | Wage/Income Gap |
[ 0.0% - 0.5% ] 0.27% | 94,731,488 | 22.5% |
[ 0.5% - 1.0% ] 0.76% | 107,859,425 | 24.9% |
[ 1.0% - 1.5% ] 1.26% | 107,793,614 | 26.4% |
[ 1.5% - 2.0% ] 1.73% | 94,283,996 | 28.4% |
[ 2.0% - 2.5% ] 2.23% | 64,541,682 | 29.2% |
[ 2.5% - 3.0% ] 2.74% | 41,488,888 | 30.4% |
[ 3.0% - 3.5% ] 3.23% | 21,976,409 | 32.4% |
[ 3.5% - 4.0% ] 3.72% | 12,797,762 | 31.2% |
[ 4.0% - 4.5% ] 4.21% | 7,641,966 | 34.3% |
[ 4.5% - 5.0% ] 4.72% | 4,019,806 | 35.1% |
[ 5.0% - 5.5% ] 5.22% | 2,435,768 | 35.1% |
[ 5.5% - 6.0% ] 5.71% | 1,448,605 | 33.0% |
[ 6.0% - 6.5% ] 6.22% | 831,553 | 29.6% |
[ 6.5% - 7.0% ] 6.71% | 597,464 | 33.1% |
[ 7.0% - 7.5% ] 7.23% | 455,334 | 35.7% |
[ 7.5% - 8.0% ] 7.74% | 264,456 | 33.3% |
[ 8.0% - 8.5% ] 8.23% | 310,146 | 36.3% |
[ 8.5% - 9.0% ] 8.79% | 160,641 | 36.2% |
[ 9.0% - 9.5% ] 9.21% | 129,139 | 32.8% |
[ 9.5% - 10.0% ] 9.73% | 86,349 | 35.4% |
[ 10.0% - 10.5% ] 10.26% | 63,667 | 40.8% |
[ 10.5% - 11.0% ] 10.73% | 76,687 | 39.0% |
[ 11.0% - 11.5% ] 11.20% | 57,518 | 37.3% |
[ 11.5% - 12.0% ] 11.71% | 37,956 | 34.0% |
[ 12.0% - 12.5% ] 12.17% | 37,444 | 37.0% |
[ 12.5% - 13.0% ] 12.71% | 33,880 | 35.3% |
[ 13.0% - 13.5% ] 13.19% | 13,456 | 31.5% |
[ 13.5% - 14.0% ] 13.79% | 13,757 | 21.9% |
[ 14.0% - 14.5% ] 14.22% | 14,441 | 34.3% |
[ 14.5% - 15.0% ] 14.77% | 14,911 | 30.4% |
[ 15.0% - 15.5% ] 15.25% | 4,871 | 28.2% |
[ 15.5% - 16.0% ] 15.82% | 13,948 | 32.0% |
[ 16.0% - 16.5% ] 16.29% | 1,940 | 39.5% |
[ 16.5% - 17.0% ] 16.67% | 966 | 40.0% |
[ 17.0% - 17.5% ] 17.19% | 2,286 | 52.5% |
[ 17.5% - 18.0% ] 17.67% | 9,763 | 20.9% |
[ 18.0% - 18.5% ] 18.20% | 5,067 | 45.5% |
[ 18.5% - 19.0% ] 18.74% | 6,969 | 36.8% |
[ 19.0% - 19.5% ] 19.30% | 1,233 | 11.2% |
[ 19.5% - 20.0% ] 19.77% | 5,317 | 56.6% |
[ 20.0% - 20.5% ] 20.12% | 1,471 | 28.9% |
[ 20.5% - 21.0% ] 20.75% | 5,870 | 27.7% |
[ 21.0% - 21.5% ] 21.16% | 567 | 60.5% |
[ 21.5% - 22.0% ] 21.83% | 4,265 | 31.6% |
[ 22.0% - 22.5% ] 22.32% | 466 | 59.5% |
[ 22.5% - 23.0% ] 22.64% | 106 | 29.4% |
[ 23.0% - 23.5% ] 23.21% | 1,008 | 25.5% |
[ 23.5% - 24.0% ] 23.88% | 779 | 33.5% |
[ 24.5% - 25.0% ] 24.81% | 262 | 58.0% |
[ 25.0% - 25.5% ] 25.27% | 1,298 | 20.9% |
[ 25.5% - 26.0% ] 25.81% | 62 | 34.9% |
[ 26.0% - 26.5% ] 26.15% | 631 | 34.9% |
[ 26.5% - 27.0% ] 26.69% | 2,008 | 33.5% |
[ 27.5% - 28.0% ] 27.65% | 680 | 73.0% |
[ 29.0% - 29.5% ] 29.06% | 702 | 48.2% |
[ 31.0% - 31.5% ] 31.34% | 1,101 | 14.3% |
[ 31.5% - 32.0% ] 31.60% | 1,405 | 38.5% |
[ 32.0% - 32.5% ] 32.26% | 62 | 7.8% |
[ 33.5% - 34.0% ] 33.64% | 217 | 28.0% |
[ 34.5% - 35.0% ] 34.84% | 442 | 41.8% |
[ 37.0% - 37.5% ] 37.27% | 322 | 11.6% |
[ 38.0% - 38.5% ] 38.17% | 241 | 54.7% |
[ 39.0% - 39.5% ] 39.47% | 228 | 43.9% |
[ 41.0% - 41.5% ] 41.01% | 278 | 17.9% |
[ 44.0% - 44.5% ] 44.07% | 59 | 68.8% |
[ 52.5% - 53.0% ] 52.59% | 116 | 38.3% |
[ 61.5% - 62.0% ] 61.76% | 68 | 18.8% |