Paiute vs Immigrants from Fiji Female Disability
COMPARE
Paiute
Immigrants from Fiji
Female Disability
Female Disability Comparison
Paiute
Immigrants from Fiji
14.0%
FEMALE DISABILITY
0.0/ 100
METRIC RATING
318th/ 347
METRIC RANK
12.3%
FEMALE DISABILITY
38.2/ 100
METRIC RATING
179th/ 347
METRIC RANK
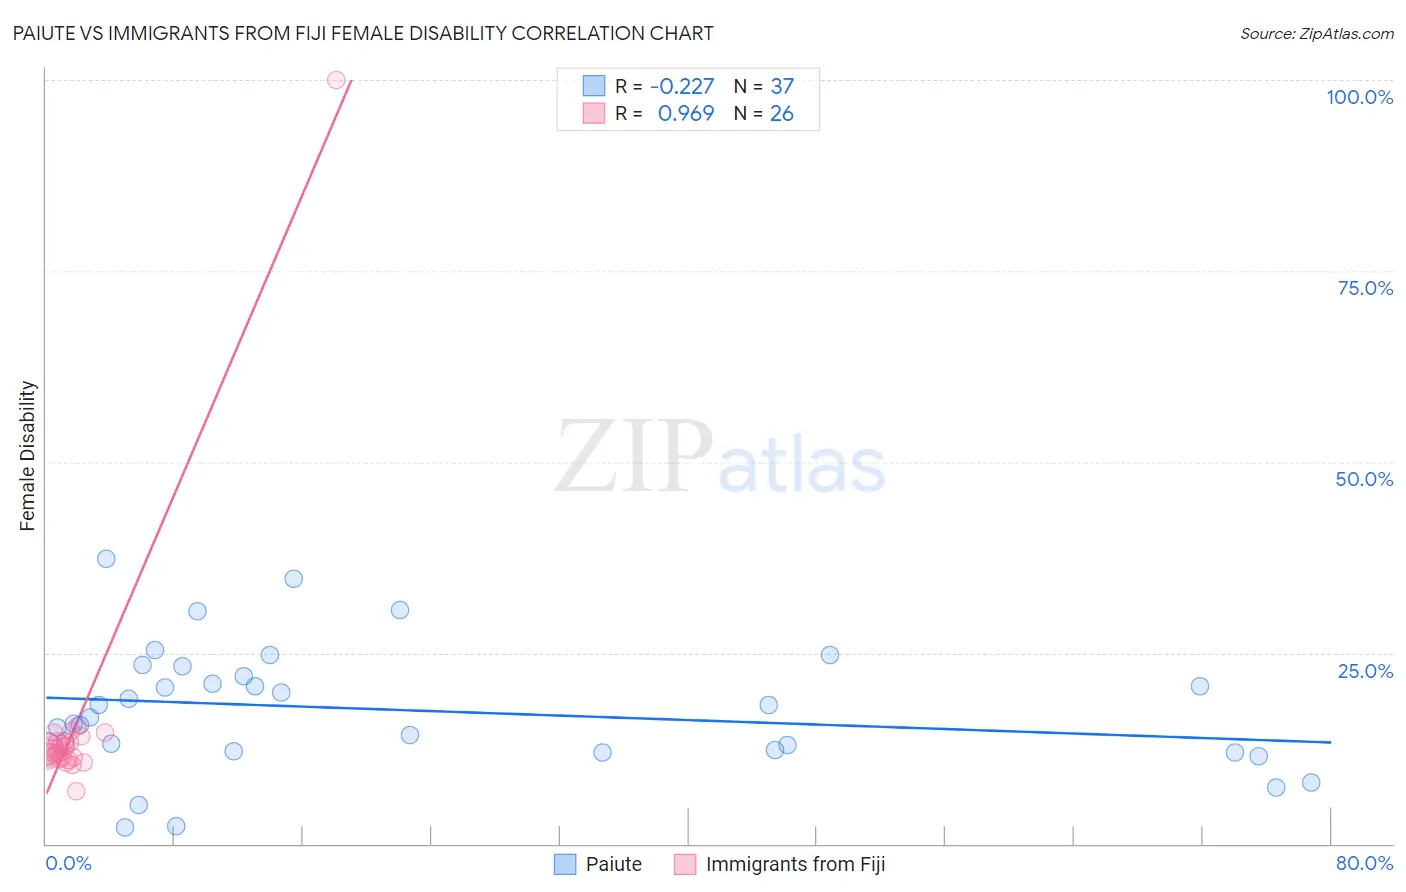
Paiute vs Immigrants from Fiji Female Disability Correlation Chart
The statistical analysis conducted on geographies consisting of 58,394,614 people shows a weak negative correlation between the proportion of Paiute and percentage of females with a disability in the United States with a correlation coefficient (R) of -0.227 and weighted average of 14.0%. Similarly, the statistical analysis conducted on geographies consisting of 93,754,243 people shows a perfect positive correlation between the proportion of Immigrants from Fiji and percentage of females with a disability in the United States with a correlation coefficient (R) of 0.969 and weighted average of 12.3%, a difference of 14.3%.
Female Disability Correlation Summary
| Measurement | Paiute | Immigrants from Fiji |
| Minimum | 2.1% | 6.9% |
| Maximum | 37.3% | 100.0% |
| Range | 35.2% | 93.1% |
| Mean | 17.5% | 15.6% |
| Median | 16.5% | 12.0% |
| Interquartile 25% (IQ1) | 12.2% | 11.2% |
| Interquartile 75% (IQ3) | 22.6% | 13.4% |
| Interquartile Range (IQR) | 10.3% | 2.2% |
| Standard Deviation (Sample) | 8.2% | 17.3% |
| Standard Deviation (Population) | 8.1% | 17.0% |
Similar Demographics by Female Disability
Demographics Similar to Paiute by Female Disability
In terms of female disability, the demographic groups most similar to Paiute are Chippewa (14.0%, a difference of 0.11%), Spanish American (14.0%, a difference of 0.22%), Iroquois (14.0%, a difference of 0.29%), Alaskan Athabascan (13.9%, a difference of 0.58%), and American (14.1%, a difference of 0.63%).
| Demographics | Rating | Rank | Female Disability |
| Hopi | 0.0 /100 | #311 | Tragic 13.7% |
| Delaware | 0.0 /100 | #312 | Tragic 13.8% |
| Blackfeet | 0.0 /100 | #313 | Tragic 13.8% |
| Puget Sound Salish | 0.0 /100 | #314 | Tragic 13.8% |
| Alaskan Athabascans | 0.0 /100 | #315 | Tragic 13.9% |
| Spanish Americans | 0.0 /100 | #316 | Tragic 14.0% |
| Chippewa | 0.0 /100 | #317 | Tragic 14.0% |
| Paiute | 0.0 /100 | #318 | Tragic 14.0% |
| Iroquois | 0.0 /100 | #319 | Tragic 14.0% |
| Americans | 0.0 /100 | #320 | Tragic 14.1% |
| Potawatomi | 0.0 /100 | #321 | Tragic 14.1% |
| Pueblo | 0.0 /100 | #322 | Tragic 14.1% |
| Blacks/African Americans | 0.0 /100 | #323 | Tragic 14.1% |
| Natives/Alaskans | 0.0 /100 | #324 | Tragic 14.1% |
| Navajo | 0.0 /100 | #325 | Tragic 14.2% |
Demographics Similar to Immigrants from Fiji by Female Disability
In terms of female disability, the demographic groups most similar to Immigrants from Fiji are Albanian (12.3%, a difference of 0.010%), Immigrants from Canada (12.3%, a difference of 0.040%), Norwegian (12.3%, a difference of 0.050%), Cuban (12.3%, a difference of 0.070%), and Iraqi (12.3%, a difference of 0.090%).
| Demographics | Rating | Rank | Female Disability |
| Haitians | 51.9 /100 | #172 | Average 12.2% |
| Immigrants | Mexico | 50.8 /100 | #173 | Average 12.2% |
| Immigrants | England | 50.0 /100 | #174 | Average 12.2% |
| Immigrants | St. Vincent and the Grenadines | 49.7 /100 | #175 | Average 12.2% |
| Immigrants | Guyana | 43.1 /100 | #176 | Average 12.2% |
| Immigrants | Ghana | 42.5 /100 | #177 | Average 12.2% |
| Immigrants | Western Europe | 40.9 /100 | #178 | Average 12.2% |
| Immigrants | Fiji | 38.2 /100 | #179 | Fair 12.3% |
| Albanians | 37.9 /100 | #180 | Fair 12.3% |
| Immigrants | Canada | 37.2 /100 | #181 | Fair 12.3% |
| Norwegians | 36.9 /100 | #182 | Fair 12.3% |
| Cubans | 36.5 /100 | #183 | Fair 12.3% |
| Iraqis | 36.0 /100 | #184 | Fair 12.3% |
| Immigrants | Uzbekistan | 33.9 /100 | #185 | Fair 12.3% |
| Austrians | 33.3 /100 | #186 | Fair 12.3% |