Paiute GED/Equivalency
COMPARE
Paiute
Select to Compare
GED/Equivalency
Paiute GED/Equivalency
82.0%
GED/EQUIVALENCY
0.0/ 100
METRIC RATING
292nd/ 347
METRIC RANK
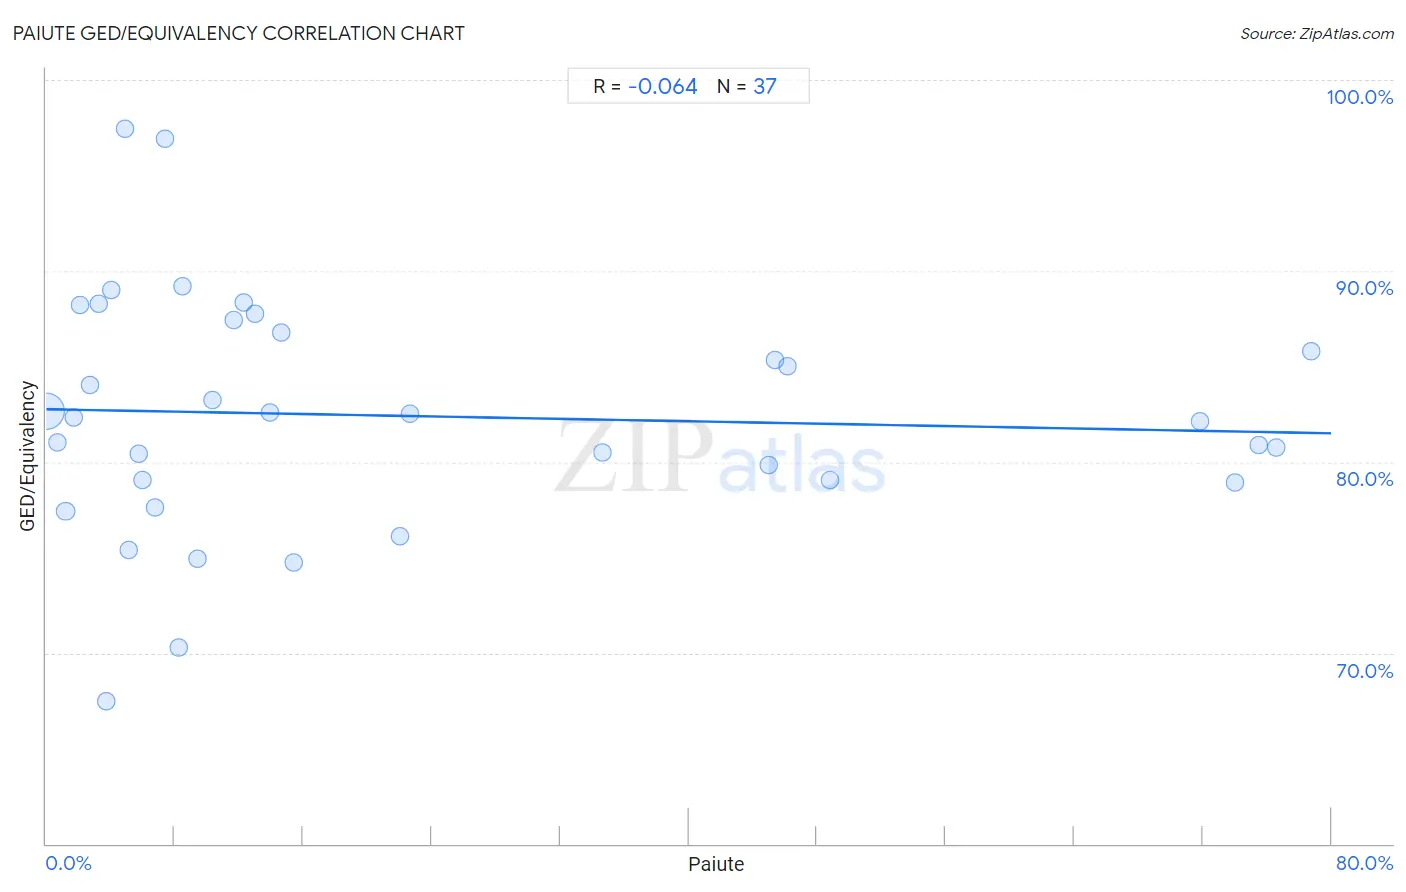
Paiute GED/Equivalency Correlation Chart
The statistical analysis conducted on geographies consisting of 58,404,221 people shows a slight negative correlation between the proportion of Paiute and percentage of population with at least ged/equivalency education in the United States with a correlation coefficient (R) of -0.064 and weighted average of 82.0%. On average, for every 1% (one percent) increase in Paiute within a typical geography, there is a decrease of 0.016% in percentage of population with at least ged/equivalency education.
It is essential to understand that the correlation between the percentage of Paiute and percentage of population with at least ged/equivalency education does not imply a direct cause-and-effect relationship. It remains uncertain whether the presence of Paiute influences an upward or downward trend in the level of percentage of population with at least ged/equivalency education within an area, or if Paiute simply ended up residing in those areas with higher or lower levels of percentage of population with at least ged/equivalency education due to other factors.
Demographics Similar to Paiute by GED/Equivalency
In terms of ged/equivalency, the demographic groups most similar to Paiute are British West Indian (82.0%, a difference of 0.010%), Immigrants from St. Vincent and the Grenadines (82.0%, a difference of 0.030%), Cuban (82.0%, a difference of 0.040%), Haitian (82.1%, a difference of 0.060%), and Nepalese (81.9%, a difference of 0.090%).
| Demographics | Rating | Rank | GED/Equivalency |
| Cajuns | 0.0 /100 | #285 | Tragic 82.4% |
| Immigrants from West Indies | 0.0 /100 | #286 | Tragic 82.4% |
| Japanese | 0.0 /100 | #287 | Tragic 82.4% |
| Pueblo | 0.0 /100 | #288 | Tragic 82.3% |
| Immigrants from Cambodia | 0.0 /100 | #289 | Tragic 82.2% |
| Haitians | 0.0 /100 | #290 | Tragic 82.1% |
| Cubans | 0.0 /100 | #291 | Tragic 82.0% |
| Paiute | 0.0 /100 | #292 | Tragic 82.0% |
| British West Indians | 0.0 /100 | #293 | Tragic 82.0% |
| Immigrants from St. Vincent and the Grenadines | 0.0 /100 | #294 | Tragic 82.0% |
| Nepalese | 0.0 /100 | #295 | Tragic 81.9% |
| Vietnamese | 0.0 /100 | #296 | Tragic 81.9% |
| Immigrants from Bangladesh | 0.0 /100 | #297 | Tragic 81.9% |
| Ute | 0.0 /100 | #298 | Tragic 81.8% |
| Ecuadorians | 0.0 /100 | #299 | Tragic 81.7% |
Paiute GED/Equivalency Correlation Summary
| Measurement | Paiute Data | GED/Equivalency Data |
| Minimum | 0.030% | 67.5% |
| Maximum | 78.7% | 97.4% |
| Range | 78.7% | 29.9% |
| Mean | 22.0% | 82.4% |
| Median | 10.3% | 82.3% |
| Interquartile 25% (IQ1) | 4.5% | 79.0% |
| Interquartile 75% (IQ3) | 39.8% | 87.1% |
| Interquartile Range (IQR) | 35.3% | 8.1% |
| Standard Deviation (Sample) | 25.3% | 6.3% |
| Standard Deviation (Population) | 24.9% | 6.2% |
Correlation Details
| Paiute Percentile | Sample Size | GED/Equivalency |
[ 0.0% - 0.5% ] 0.030% | 57,651,657 | 82.6% |
[ 0.5% - 1.0% ] 0.68% | 501,259 | 81.0% |
[ 1.0% - 1.5% ] 1.21% | 145,165 | 77.4% |
[ 1.5% - 2.0% ] 1.75% | 29,125 | 82.3% |
[ 2.0% - 2.5% ] 2.12% | 8,780 | 88.2% |
[ 2.5% - 3.0% ] 2.74% | 9,328 | 84.1% |
[ 3.0% - 3.5% ] 3.28% | 579 | 88.3% |
[ 3.5% - 4.0% ] 3.76% | 1,916 | 67.5% |
[ 4.0% - 4.5% ] 4.04% | 15,901 | 89.0% |
[ 4.5% - 5.0% ] 4.92% | 1,565 | 97.4% |
[ 5.0% - 5.5% ] 5.12% | 6,295 | 75.4% |
[ 5.5% - 6.0% ] 5.74% | 1,133 | 80.4% |
[ 6.0% - 6.5% ] 6.02% | 3,108 | 79.0% |
[ 6.5% - 7.0% ] 6.80% | 8,472 | 77.6% |
[ 7.0% - 7.5% ] 7.39% | 1,705 | 96.9% |
[ 8.0% - 8.5% ] 8.24% | 728 | 70.3% |
[ 8.5% - 9.0% ] 8.52% | 775 | 89.2% |
[ 9.0% - 9.5% ] 9.38% | 1,886 | 74.9% |
[ 10.0% - 10.5% ] 10.35% | 3,034 | 83.3% |
[ 11.5% - 12.0% ] 11.70% | 778 | 87.5% |
[ 12.0% - 12.5% ] 12.31% | 1,649 | 88.3% |
[ 12.5% - 13.0% ] 12.99% | 1,563 | 87.7% |
[ 13.5% - 14.0% ] 13.90% | 374 | 82.6% |
[ 14.5% - 15.0% ] 14.63% | 1,032 | 86.8% |
[ 15.0% - 15.5% ] 15.43% | 363 | 74.7% |
[ 22.0% - 22.5% ] 22.05% | 254 | 76.1% |
[ 22.5% - 23.0% ] 22.68% | 313 | 82.5% |
[ 34.5% - 35.0% ] 34.61% | 393 | 80.5% |
[ 44.5% - 45.0% ] 44.98% | 887 | 79.8% |
[ 45.0% - 45.5% ] 45.35% | 172 | 85.3% |
[ 46.0% - 46.5% ] 46.15% | 169 | 85.0% |
[ 48.5% - 49.0% ] 48.76% | 1,007 | 79.1% |
[ 71.5% - 72.0% ] 71.85% | 135 | 82.1% |
[ 73.5% - 74.0% ] 74.00% | 896 | 78.9% |
[ 75.0% - 75.5% ] 75.46% | 1,084 | 80.9% |
[ 76.5% - 77.0% ] 76.59% | 393 | 80.8% |
[ 78.5% - 79.0% ] 78.74% | 348 | 85.8% |