Paiute vs Russian Female Disability
COMPARE
Paiute
Russian
Female Disability
Female Disability Comparison
Paiute
Russians
14.0%
FEMALE DISABILITY
0.0/ 100
METRIC RATING
318th/ 347
METRIC RANK
11.8%
FEMALE DISABILITY
96.5/ 100
METRIC RATING
124th/ 347
METRIC RANK
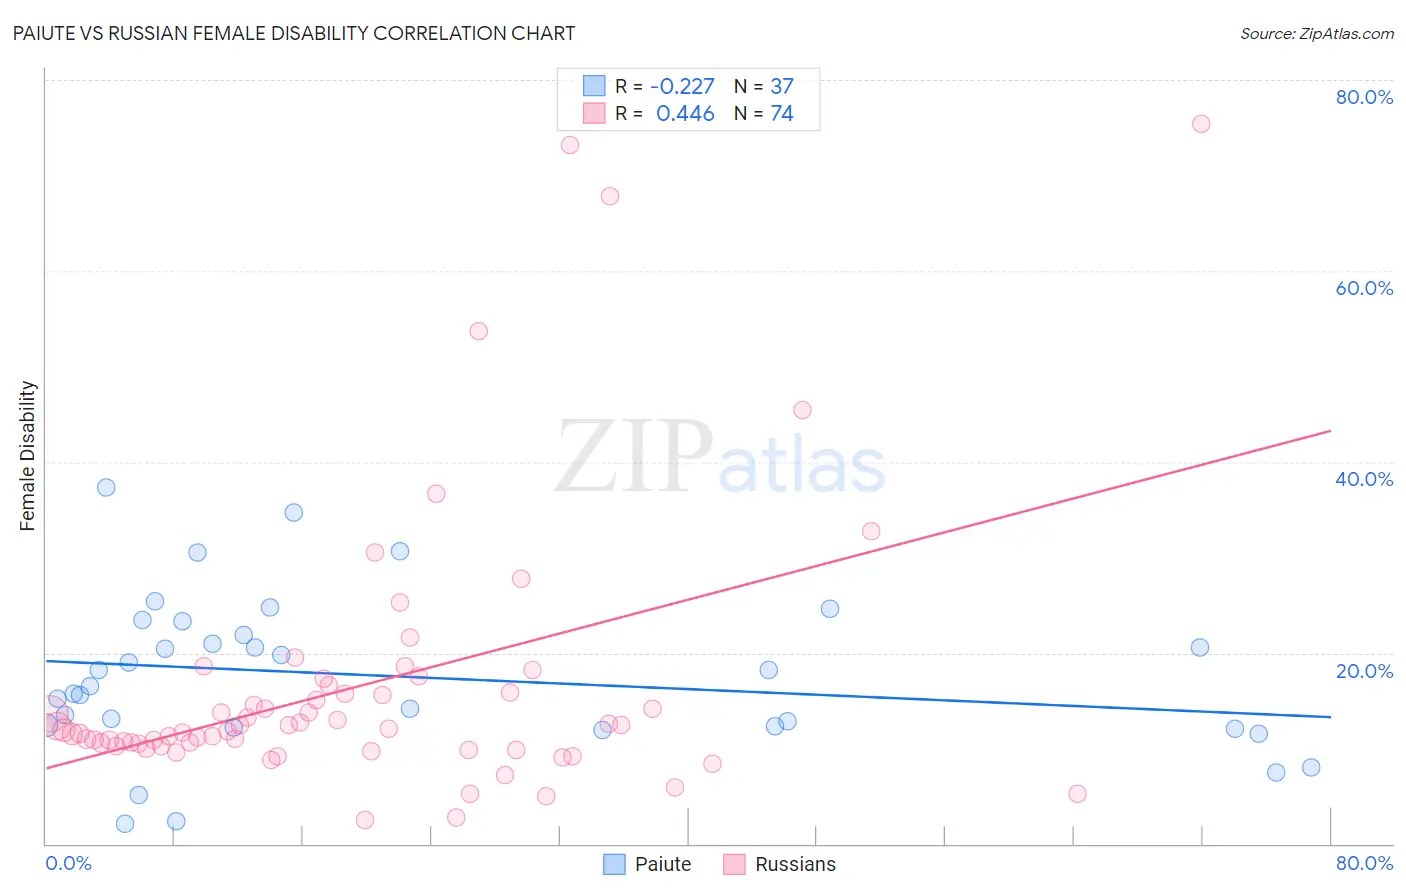
Paiute vs Russian Female Disability Correlation Chart
The statistical analysis conducted on geographies consisting of 58,394,614 people shows a weak negative correlation between the proportion of Paiute and percentage of females with a disability in the United States with a correlation coefficient (R) of -0.227 and weighted average of 14.0%. Similarly, the statistical analysis conducted on geographies consisting of 512,105,615 people shows a moderate positive correlation between the proportion of Russians and percentage of females with a disability in the United States with a correlation coefficient (R) of 0.446 and weighted average of 11.8%, a difference of 18.6%.
Female Disability Correlation Summary
| Measurement | Paiute | Russian |
| Minimum | 2.1% | 2.5% |
| Maximum | 37.3% | 75.4% |
| Range | 35.2% | 73.0% |
| Mean | 17.5% | 16.5% |
| Median | 16.5% | 12.0% |
| Interquartile 25% (IQ1) | 12.2% | 10.3% |
| Interquartile 75% (IQ3) | 22.6% | 15.8% |
| Interquartile Range (IQR) | 10.3% | 5.5% |
| Standard Deviation (Sample) | 8.2% | 14.3% |
| Standard Deviation (Population) | 8.1% | 14.2% |
Similar Demographics by Female Disability
Demographics Similar to Paiute by Female Disability
In terms of female disability, the demographic groups most similar to Paiute are Chippewa (14.0%, a difference of 0.11%), Spanish American (14.0%, a difference of 0.22%), Iroquois (14.0%, a difference of 0.29%), Alaskan Athabascan (13.9%, a difference of 0.58%), and American (14.1%, a difference of 0.63%).
| Demographics | Rating | Rank | Female Disability |
| Hopi | 0.0 /100 | #311 | Tragic 13.7% |
| Delaware | 0.0 /100 | #312 | Tragic 13.8% |
| Blackfeet | 0.0 /100 | #313 | Tragic 13.8% |
| Puget Sound Salish | 0.0 /100 | #314 | Tragic 13.8% |
| Alaskan Athabascans | 0.0 /100 | #315 | Tragic 13.9% |
| Spanish Americans | 0.0 /100 | #316 | Tragic 14.0% |
| Chippewa | 0.0 /100 | #317 | Tragic 14.0% |
| Paiute | 0.0 /100 | #318 | Tragic 14.0% |
| Iroquois | 0.0 /100 | #319 | Tragic 14.0% |
| Americans | 0.0 /100 | #320 | Tragic 14.1% |
| Potawatomi | 0.0 /100 | #321 | Tragic 14.1% |
| Pueblo | 0.0 /100 | #322 | Tragic 14.1% |
| Blacks/African Americans | 0.0 /100 | #323 | Tragic 14.1% |
| Natives/Alaskans | 0.0 /100 | #324 | Tragic 14.1% |
| Navajo | 0.0 /100 | #325 | Tragic 14.2% |
Demographics Similar to Russians by Female Disability
In terms of female disability, the demographic groups most similar to Russians are Immigrants from Italy (11.8%, a difference of 0.030%), Immigrants from Croatia (11.8%, a difference of 0.050%), Immigrants from Europe (11.8%, a difference of 0.090%), Immigrants from North Macedonia (11.8%, a difference of 0.10%), and Immigrants from Netherlands (11.8%, a difference of 0.11%).
| Demographics | Rating | Rank | Female Disability |
| Immigrants | Eastern Europe | 97.2 /100 | #117 | Exceptional 11.8% |
| Immigrants | Nigeria | 97.2 /100 | #118 | Exceptional 11.8% |
| Immigrants | Uganda | 97.2 /100 | #119 | Exceptional 11.8% |
| Immigrants | Kazakhstan | 97.0 /100 | #120 | Exceptional 11.8% |
| Immigrants | Netherlands | 96.9 /100 | #121 | Exceptional 11.8% |
| Immigrants | North Macedonia | 96.8 /100 | #122 | Exceptional 11.8% |
| Immigrants | Croatia | 96.7 /100 | #123 | Exceptional 11.8% |
| Russians | 96.5 /100 | #124 | Exceptional 11.8% |
| Immigrants | Italy | 96.4 /100 | #125 | Exceptional 11.8% |
| Immigrants | Europe | 96.2 /100 | #126 | Exceptional 11.8% |
| South American Indians | 95.8 /100 | #127 | Exceptional 11.8% |
| Immigrants | Latvia | 95.6 /100 | #128 | Exceptional 11.8% |
| Macedonians | 95.5 /100 | #129 | Exceptional 11.8% |
| Nicaraguans | 95.2 /100 | #130 | Exceptional 11.9% |
| Arabs | 95.1 /100 | #131 | Exceptional 11.9% |