Ottawa Disability Age 5 to 17
COMPARE
Ottawa
Select to Compare
Disability Age 5 to 17
Ottawa Disability Age 5 to 17
6.8%
DISABILITY | AGE 5 TO 17
0.0/ 100
METRIC RATING
335th/ 347
METRIC RANK
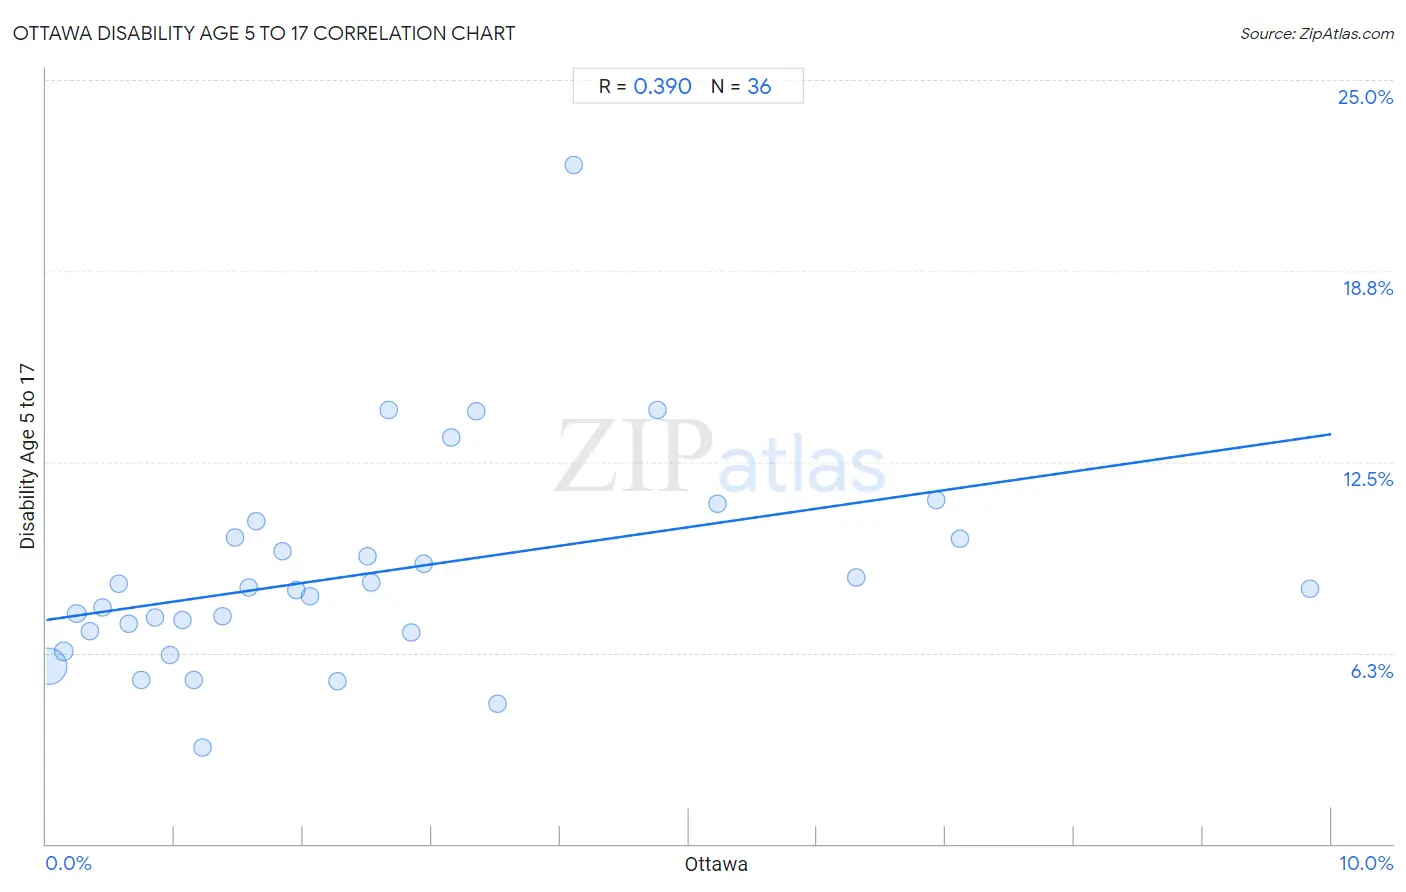
Ottawa Disability Age 5 to 17 Correlation Chart
The statistical analysis conducted on geographies consisting of 49,831,425 people shows a mild positive correlation between the proportion of Ottawa and percentage of population with a disability between the ages 5 and 17 in the United States with a correlation coefficient (R) of 0.390 and weighted average of 6.8%. On average, for every 1% (one percent) increase in Ottawa within a typical geography, there is an increase of 0.61% in percentage of population with a disability between the ages 5 and 17.
It is essential to understand that the correlation between the percentage of Ottawa and percentage of population with a disability between the ages 5 and 17 does not imply a direct cause-and-effect relationship. It remains uncertain whether the presence of Ottawa influences an upward or downward trend in the level of percentage of population with a disability between the ages 5 and 17 within an area, or if Ottawa simply ended up residing in those areas with higher or lower levels of percentage of population with a disability between the ages 5 and 17 due to other factors.
Demographics Similar to Ottawa by Disability Age 5 to 17
In terms of disability age 5 to 17, the demographic groups most similar to Ottawa are Chickasaw (6.8%, a difference of 0.50%), Seminole (6.8%, a difference of 0.70%), Black/African American (6.8%, a difference of 0.75%), Creek (6.9%, a difference of 0.93%), and Iroquois (6.9%, a difference of 1.2%).
| Demographics | Rating | Rank | Disability Age 5 to 17 |
| Pennsylvania Germans | 0.0 /100 | #328 | Tragic 6.6% |
| Blackfeet | 0.0 /100 | #329 | Tragic 6.6% |
| Dutch West Indians | 0.0 /100 | #330 | Tragic 6.7% |
| French Canadians | 0.0 /100 | #331 | Tragic 6.7% |
| Immigrants from the Azores | 0.0 /100 | #332 | Tragic 6.7% |
| Blacks/African Americans | 0.0 /100 | #333 | Tragic 6.8% |
| Seminole | 0.0 /100 | #334 | Tragic 6.8% |
| Ottawa | 0.0 /100 | #335 | Tragic 6.8% |
| Chickasaw | 0.0 /100 | #336 | Tragic 6.8% |
| Creek | 0.0 /100 | #337 | Tragic 6.9% |
| Iroquois | 0.0 /100 | #338 | Tragic 6.9% |
| Choctaw | 0.0 /100 | #339 | Tragic 6.9% |
| Cherokee | 0.0 /100 | #340 | Tragic 6.9% |
| Cape Verdeans | 0.0 /100 | #341 | Tragic 7.0% |
| Chippewa | 0.0 /100 | #342 | Tragic 7.1% |
Ottawa Disability Age 5 to 17 Correlation Summary
| Measurement | Ottawa Data | Disability Age 5 to 17 Data |
| Minimum | 0.015% | 3.1% |
| Maximum | 9.8% | 22.2% |
| Range | 9.8% | 19.1% |
| Mean | 2.5% | 8.8% |
| Median | 1.9% | 8.3% |
| Interquartile 25% (IQ1) | 0.90% | 6.9% |
| Interquartile 75% (IQ3) | 3.2% | 10.0% |
| Interquartile Range (IQR) | 2.3% | 3.1% |
| Standard Deviation (Sample) | 2.3% | 3.5% |
| Standard Deviation (Population) | 2.2% | 3.5% |
Correlation Details
| Ottawa Percentile | Sample Size | Disability Age 5 to 17 |
[ 0.0% - 0.5% ] 0.015% | 45,055,347 | 5.8% |
[ 0.0% - 0.5% ] 0.14% | 2,779,280 | 6.3% |
[ 0.0% - 0.5% ] 0.24% | 883,197 | 7.5% |
[ 0.0% - 0.5% ] 0.34% | 461,617 | 6.9% |
[ 0.0% - 0.5% ] 0.43% | 161,467 | 7.7% |
[ 0.5% - 1.0% ] 0.57% | 62,065 | 8.5% |
[ 0.5% - 1.0% ] 0.64% | 94,358 | 7.2% |
[ 0.5% - 1.0% ] 0.74% | 112,768 | 5.4% |
[ 0.5% - 1.0% ] 0.85% | 31,641 | 7.4% |
[ 0.5% - 1.0% ] 0.96% | 7,507 | 6.2% |
[ 1.0% - 1.5% ] 1.06% | 14,002 | 7.3% |
[ 1.0% - 1.5% ] 1.15% | 40,270 | 5.4% |
[ 1.0% - 1.5% ] 1.22% | 4,101 | 3.1% |
[ 1.0% - 1.5% ] 1.37% | 27,530 | 7.4% |
[ 1.0% - 1.5% ] 1.47% | 5,390 | 10.0% |
[ 1.5% - 2.0% ] 1.58% | 17,033 | 8.4% |
[ 1.5% - 2.0% ] 1.63% | 4,663 | 10.6% |
[ 1.5% - 2.0% ] 1.84% | 7,814 | 9.6% |
[ 1.5% - 2.0% ] 1.94% | 15,708 | 8.3% |
[ 2.0% - 2.5% ] 2.05% | 1,512 | 8.1% |
[ 2.0% - 2.5% ] 2.27% | 11,209 | 5.3% |
[ 2.0% - 2.5% ] 2.50% | 6,248 | 9.4% |
[ 2.5% - 3.0% ] 2.53% | 474 | 8.5% |
[ 2.5% - 3.0% ] 2.67% | 1,274 | 14.2% |
[ 2.5% - 3.0% ] 2.84% | 423 | 6.9% |
[ 2.5% - 3.0% ] 2.93% | 5,148 | 9.2% |
[ 3.0% - 3.5% ] 3.15% | 6,894 | 13.3% |
[ 3.0% - 3.5% ] 3.35% | 1,105 | 14.2% |
[ 3.5% - 4.0% ] 3.51% | 1,710 | 4.6% |
[ 4.0% - 4.5% ] 4.10% | 390 | 22.2% |
[ 4.5% - 5.0% ] 4.76% | 4,857 | 14.2% |
[ 5.0% - 5.5% ] 5.22% | 862 | 11.1% |
[ 6.0% - 6.5% ] 6.30% | 1,031 | 8.7% |
[ 6.5% - 7.0% ] 6.93% | 1,415 | 11.2% |
[ 7.0% - 7.5% ] 7.11% | 759 | 10.0% |
[ 9.5% - 10.0% ] 9.83% | 356 | 8.3% |