Immigrants from Bulgaria Disability Age 5 to 17
COMPARE
Immigrants from Bulgaria
Select to Compare
Disability Age 5 to 17
Immigrants from Bulgaria Disability Age 5 to 17
5.4%
DISABILITY | AGE 5 TO 17
94.0/ 100
METRIC RATING
130th/ 347
METRIC RANK
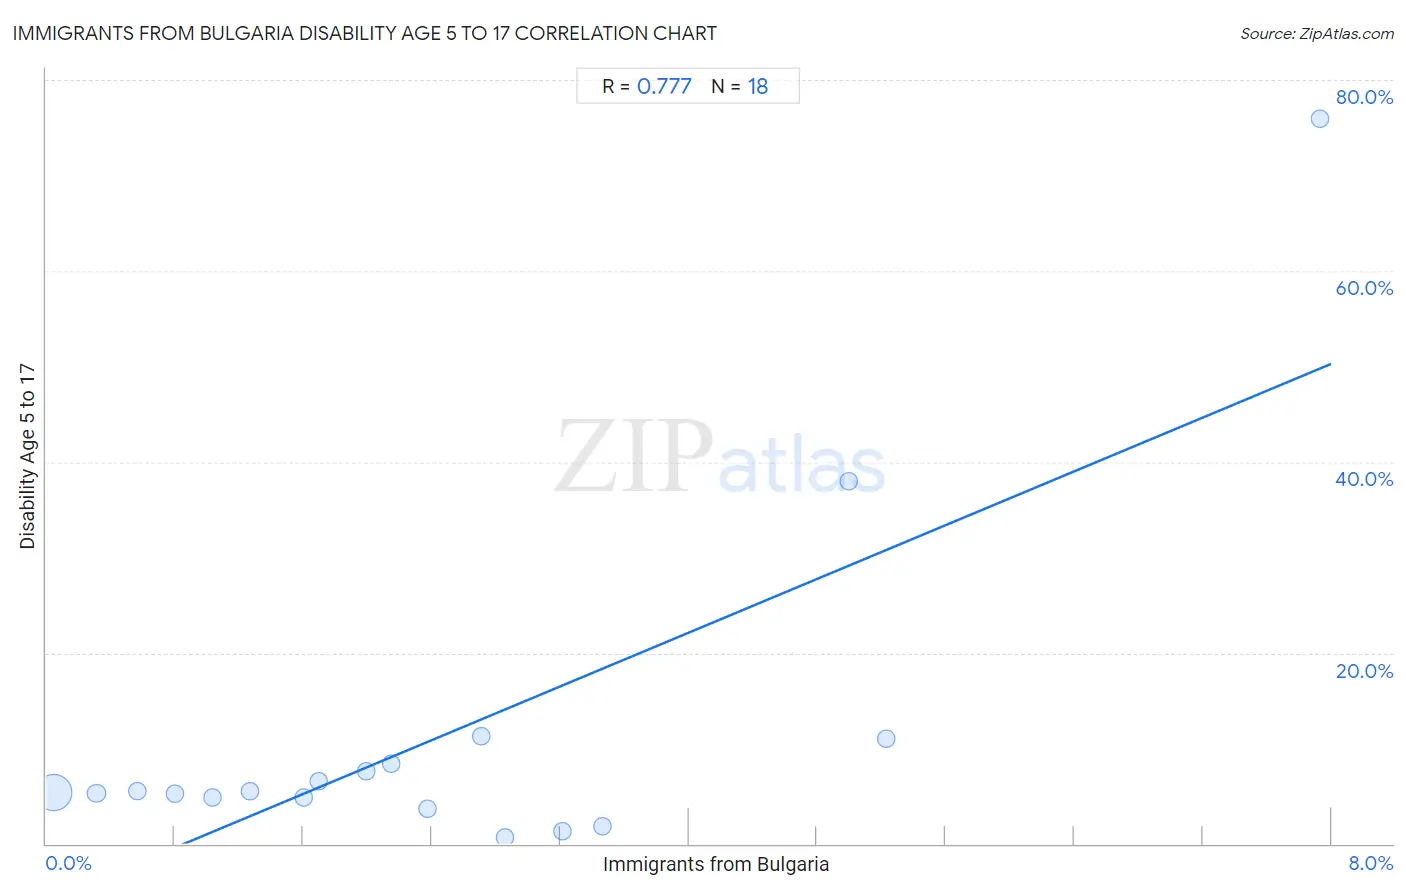
Immigrants from Bulgaria Disability Age 5 to 17 Correlation Chart
The statistical analysis conducted on geographies consisting of 171,828,354 people shows a strong positive correlation between the proportion of Immigrants from Bulgaria and percentage of population with a disability between the ages 5 and 17 in the United States with a correlation coefficient (R) of 0.777 and weighted average of 5.4%. On average, for every 1% (one percent) increase in Immigrants from Bulgaria within a typical geography, there is an increase of 7.0% in percentage of population with a disability between the ages 5 and 17.
It is essential to understand that the correlation between the percentage of Immigrants from Bulgaria and percentage of population with a disability between the ages 5 and 17 does not imply a direct cause-and-effect relationship. It remains uncertain whether the presence of Immigrants from Bulgaria influences an upward or downward trend in the level of percentage of population with a disability between the ages 5 and 17 within an area, or if Immigrants from Bulgaria simply ended up residing in those areas with higher or lower levels of percentage of population with a disability between the ages 5 and 17 due to other factors.
Demographics Similar to Immigrants from Bulgaria by Disability Age 5 to 17
In terms of disability age 5 to 17, the demographic groups most similar to Immigrants from Bulgaria are Romanian (5.4%, a difference of 0.020%), Immigrants from Venezuela (5.4%, a difference of 0.11%), New Zealander (5.4%, a difference of 0.23%), Latvian (5.4%, a difference of 0.23%), and Arab (5.4%, a difference of 0.23%).
| Demographics | Rating | Rank | Disability Age 5 to 17 |
| Immigrants from Ethiopia | 95.5 /100 | #123 | Exceptional 5.4% |
| Crow | 95.0 /100 | #124 | Exceptional 5.4% |
| Immigrants from Chile | 95.0 /100 | #125 | Exceptional 5.4% |
| New Zealanders | 95.0 /100 | #126 | Exceptional 5.4% |
| Latvians | 95.0 /100 | #127 | Exceptional 5.4% |
| Immigrants from Venezuela | 94.5 /100 | #128 | Exceptional 5.4% |
| Romanians | 94.1 /100 | #129 | Exceptional 5.4% |
| Immigrants from Bulgaria | 94.0 /100 | #130 | Exceptional 5.4% |
| Arabs | 92.9 /100 | #131 | Exceptional 5.4% |
| Immigrants from Colombia | 92.9 /100 | #132 | Exceptional 5.4% |
| Venezuelans | 92.7 /100 | #133 | Exceptional 5.4% |
| Yuman | 92.3 /100 | #134 | Exceptional 5.4% |
| Immigrants from Belize | 91.7 /100 | #135 | Exceptional 5.4% |
| Immigrants from Denmark | 91.4 /100 | #136 | Exceptional 5.4% |
| Navajo | 90.9 /100 | #137 | Exceptional 5.4% |
Immigrants from Bulgaria Disability Age 5 to 17 Correlation Summary
| Measurement | Immigrants from Bulgaria Data | Disability Age 5 to 17 Data |
| Minimum | 0.050% | 0.67% |
| Maximum | 7.9% | 76.0% |
| Range | 7.9% | 75.3% |
| Mean | 2.5% | 11.3% |
| Median | 2.1% | 5.4% |
| Interquartile 25% (IQ1) | 1.0% | 4.8% |
| Interquartile 75% (IQ3) | 3.2% | 8.4% |
| Interquartile Range (IQR) | 2.2% | 3.6% |
| Standard Deviation (Sample) | 2.0% | 18.1% |
| Standard Deviation (Population) | 1.9% | 17.6% |
Correlation Details
| Immigrants from Bulgaria Percentile | Sample Size | Disability Age 5 to 17 |
[ 0.0% - 0.5% ] 0.050% | 160,971,685 | 5.4% |
[ 0.0% - 0.5% ] 0.31% | 7,064,408 | 5.3% |
[ 0.5% - 1.0% ] 0.56% | 1,914,573 | 5.5% |
[ 0.5% - 1.0% ] 0.80% | 816,227 | 5.2% |
[ 1.0% - 1.5% ] 1.04% | 412,743 | 4.8% |
[ 1.0% - 1.5% ] 1.27% | 270,669 | 5.5% |
[ 1.5% - 2.0% ] 1.60% | 145,795 | 4.8% |
[ 1.5% - 2.0% ] 1.70% | 94,604 | 6.6% |
[ 1.5% - 2.0% ] 1.99% | 3,864 | 7.5% |
[ 2.0% - 2.5% ] 2.15% | 36,279 | 8.4% |
[ 2.0% - 2.5% ] 2.38% | 71,461 | 3.7% |
[ 2.5% - 3.0% ] 2.71% | 6,978 | 11.3% |
[ 2.5% - 3.0% ] 2.85% | 2,627 | 0.67% |
[ 3.0% - 3.5% ] 3.21% | 623 | 1.3% |
[ 3.0% - 3.5% ] 3.46% | 9,960 | 1.8% |
[ 4.5% - 5.0% ] 5.00% | 2,160 | 37.9% |
[ 5.0% - 5.5% ] 5.23% | 3,042 | 11.0% |
[ 7.5% - 8.0% ] 7.93% | 656 | 76.0% |