Pima Disability Age 5 to 17
COMPARE
Pima
Select to Compare
Disability Age 5 to 17
Pima Disability Age 5 to 17
6.2%
DISABILITY | AGE 5 TO 17
0.0/ 100
METRIC RATING
287th/ 347
METRIC RANK
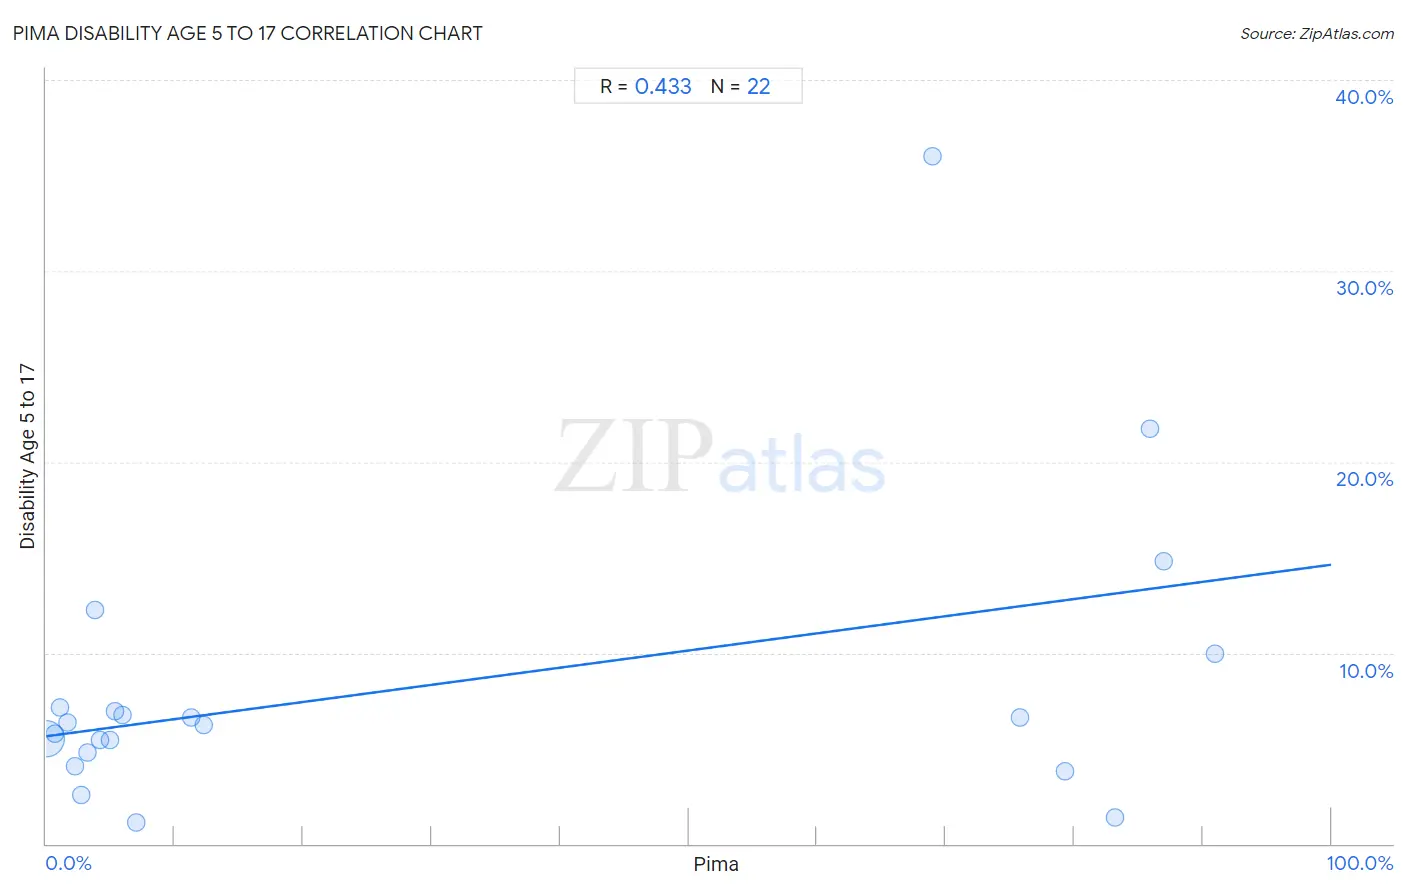
Pima Disability Age 5 to 17 Correlation Chart
The statistical analysis conducted on geographies consisting of 61,420,168 people shows a moderate positive correlation between the proportion of Pima and percentage of population with a disability between the ages 5 and 17 in the United States with a correlation coefficient (R) of 0.433 and weighted average of 6.2%. On average, for every 1% (one percent) increase in Pima within a typical geography, there is an increase of 0.090% in percentage of population with a disability between the ages 5 and 17.
It is essential to understand that the correlation between the percentage of Pima and percentage of population with a disability between the ages 5 and 17 does not imply a direct cause-and-effect relationship. It remains uncertain whether the presence of Pima influences an upward or downward trend in the level of percentage of population with a disability between the ages 5 and 17 within an area, or if Pima simply ended up residing in those areas with higher or lower levels of percentage of population with a disability between the ages 5 and 17 due to other factors.
Demographics Similar to Pima by Disability Age 5 to 17
In terms of disability age 5 to 17, the demographic groups most similar to Pima are Colville (6.2%, a difference of 0.19%), Subsaharan African (6.2%, a difference of 0.23%), English (6.2%, a difference of 0.23%), Ugandan (6.2%, a difference of 0.26%), and Jamaican (6.2%, a difference of 0.26%).
| Demographics | Rating | Rank | Disability Age 5 to 17 |
| Portuguese | 0.1 /100 | #280 | Tragic 6.1% |
| Scottish | 0.0 /100 | #281 | Tragic 6.1% |
| Germans | 0.0 /100 | #282 | Tragic 6.1% |
| Ugandans | 0.0 /100 | #283 | Tragic 6.2% |
| Sub-Saharan Africans | 0.0 /100 | #284 | Tragic 6.2% |
| English | 0.0 /100 | #285 | Tragic 6.2% |
| Colville | 0.0 /100 | #286 | Tragic 6.2% |
| Pima | 0.0 /100 | #287 | Tragic 6.2% |
| Jamaicans | 0.0 /100 | #288 | Tragic 6.2% |
| Yaqui | 0.0 /100 | #289 | Tragic 6.2% |
| Immigrants from Congo | 0.0 /100 | #290 | Tragic 6.2% |
| Whites/Caucasians | 0.0 /100 | #291 | Tragic 6.2% |
| Immigrants from Senegal | 0.0 /100 | #292 | Tragic 6.2% |
| Central American Indians | 0.0 /100 | #293 | Tragic 6.2% |
| Irish | 0.0 /100 | #294 | Tragic 6.2% |
Pima Disability Age 5 to 17 Correlation Summary
| Measurement | Pima Data | Disability Age 5 to 17 Data |
| Minimum | 0.038% | 1.1% |
| Maximum | 90.9% | 36.0% |
| Range | 90.9% | 34.9% |
| Mean | 29.0% | 8.2% |
| Median | 5.6% | 6.3% |
| Interquartile 25% (IQ1) | 2.8% | 4.8% |
| Interquartile 75% (IQ3) | 75.8% | 7.1% |
| Interquartile Range (IQR) | 73.0% | 2.3% |
| Standard Deviation (Sample) | 37.1% | 7.7% |
| Standard Deviation (Population) | 36.3% | 7.5% |
Correlation Details
| Pima Percentile | Sample Size | Disability Age 5 to 17 |
[ 0.0% - 0.5% ] 0.038% | 60,444,870 | 5.5% |
[ 0.5% - 1.0% ] 0.71% | 529,754 | 5.8% |
[ 1.0% - 1.5% ] 1.10% | 221,635 | 7.1% |
[ 1.5% - 2.0% ] 1.66% | 66,702 | 6.3% |
[ 2.0% - 2.5% ] 2.23% | 50,086 | 4.0% |
[ 2.5% - 3.0% ] 2.76% | 5,078 | 2.6% |
[ 3.0% - 3.5% ] 3.24% | 2,963 | 4.8% |
[ 3.5% - 4.0% ] 3.77% | 3,426 | 12.2% |
[ 4.0% - 4.5% ] 4.15% | 5,836 | 5.4% |
[ 4.5% - 5.0% ] 4.99% | 51,096 | 5.4% |
[ 5.0% - 5.5% ] 5.31% | 866 | 6.9% |
[ 5.5% - 6.0% ] 5.92% | 2,027 | 6.7% |
[ 7.0% - 7.5% ] 7.01% | 1,370 | 1.1% |
[ 11.0% - 11.5% ] 11.29% | 17,659 | 6.6% |
[ 12.0% - 12.5% ] 12.28% | 1,270 | 6.2% |
[ 68.5% - 69.0% ] 68.98% | 332 | 36.0% |
[ 75.5% - 76.0% ] 75.80% | 1,835 | 6.6% |
[ 79.0% - 79.5% ] 79.26% | 4,538 | 3.8% |
[ 83.0% - 83.5% ] 83.14% | 4,139 | 1.4% |
[ 85.5% - 86.0% ] 85.85% | 615 | 21.8% |
[ 86.5% - 87.0% ] 86.98% | 3,265 | 14.8% |
[ 90.5% - 91.0% ] 90.94% | 806 | 10.0% |