Immigrants from Jamaica Disability Age 5 to 17
COMPARE
Immigrants from Jamaica
Select to Compare
Disability Age 5 to 17
Immigrants from Jamaica Disability Age 5 to 17
6.1%
DISABILITY | AGE 5 TO 17
0.1/ 100
METRIC RATING
279th/ 347
METRIC RANK
Immigrants from Jamaica Disability Age 5 to 17 Correlation Chart
The statistical analysis conducted on geographies consisting of 299,987,065 people shows a poor positive correlation between the proportion of Immigrants from Jamaica and percentage of population with a disability between the ages 5 and 17 in the United States with a correlation coefficient (R) of 0.141 and weighted average of 6.1%. On average, for every 1% (one percent) increase in Immigrants from Jamaica within a typical geography, there is an increase of 0.082% in percentage of population with a disability between the ages 5 and 17.
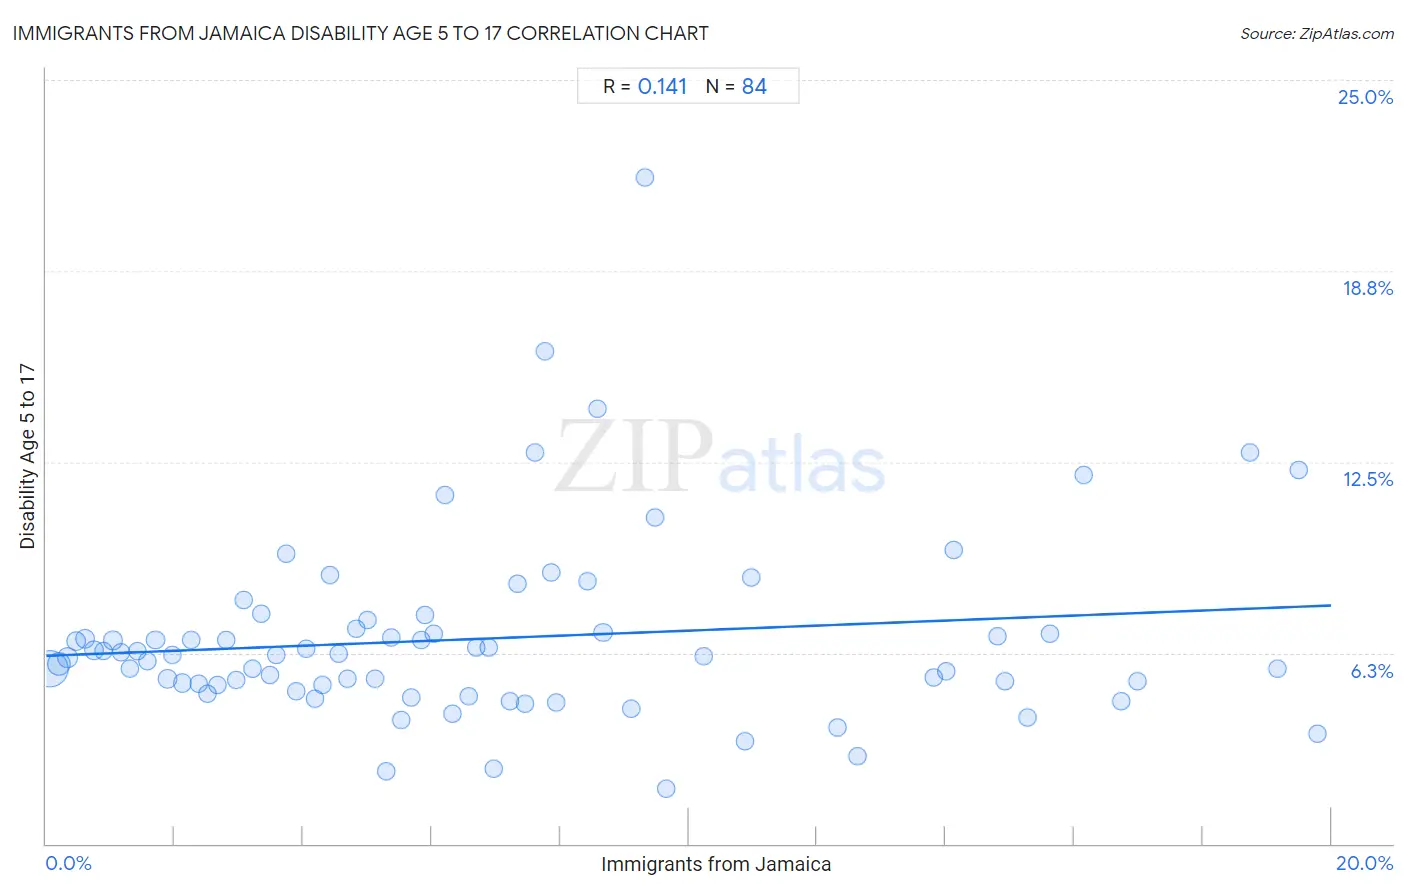
It is essential to understand that the correlation between the percentage of Immigrants from Jamaica and percentage of population with a disability between the ages 5 and 17 does not imply a direct cause-and-effect relationship. It remains uncertain whether the presence of Immigrants from Jamaica influences an upward or downward trend in the level of percentage of population with a disability between the ages 5 and 17 within an area, or if Immigrants from Jamaica simply ended up residing in those areas with higher or lower levels of percentage of population with a disability between the ages 5 and 17 due to other factors.
Demographics Similar to Immigrants from Jamaica by Disability Age 5 to 17
In terms of disability age 5 to 17, the demographic groups most similar to Immigrants from Jamaica are Immigrants from Liberia (6.1%, a difference of 0.14%), Portuguese (6.1%, a difference of 0.14%), Puget Sound Salish (6.1%, a difference of 0.22%), Scottish (6.1%, a difference of 0.39%), and German (6.1%, a difference of 0.64%).
| Demographics | Rating | Rank | Disability Age 5 to 17 |
| Finns | 0.2 /100 | #272 | Tragic 6.0% |
| Alaska Natives | 0.2 /100 | #273 | Tragic 6.0% |
| Cheyenne | 0.2 /100 | #274 | Tragic 6.0% |
| Dutch | 0.2 /100 | #275 | Tragic 6.0% |
| Japanese | 0.1 /100 | #276 | Tragic 6.1% |
| Puget Sound Salish | 0.1 /100 | #277 | Tragic 6.1% |
| Immigrants from Liberia | 0.1 /100 | #278 | Tragic 6.1% |
| Immigrants from Jamaica | 0.1 /100 | #279 | Tragic 6.1% |
| Portuguese | 0.1 /100 | #280 | Tragic 6.1% |
| Scottish | 0.0 /100 | #281 | Tragic 6.1% |
| Germans | 0.0 /100 | #282 | Tragic 6.1% |
| Ugandans | 0.0 /100 | #283 | Tragic 6.2% |
| Sub-Saharan Africans | 0.0 /100 | #284 | Tragic 6.2% |
| English | 0.0 /100 | #285 | Tragic 6.2% |
| Colville | 0.0 /100 | #286 | Tragic 6.2% |
Immigrants from Jamaica Disability Age 5 to 17 Correlation Summary
| Measurement | Immigrants from Jamaica Data | Disability Age 5 to 17 Data |
| Minimum | 0.055% | 1.8% |
| Maximum | 19.8% | 21.8% |
| Range | 19.7% | 20.0% |
| Mean | 6.9% | 6.7% |
| Median | 5.8% | 6.2% |
| Interquartile 25% (IQ1) | 2.9% | 5.2% |
| Interquartile 75% (IQ3) | 9.4% | 7.0% |
| Interquartile Range (IQR) | 6.5% | 1.8% |
| Standard Deviation (Sample) | 5.2% | 3.1% |
| Standard Deviation (Population) | 5.2% | 3.0% |
Correlation Details
| Immigrants from Jamaica Percentile | Sample Size | Disability Age 5 to 17 |
[ 0.0% - 0.5% ] 0.055% | 167,015,881 | 5.7% |
[ 0.0% - 0.5% ] 0.19% | 41,524,302 | 5.9% |
[ 0.0% - 0.5% ] 0.33% | 20,291,660 | 6.1% |
[ 0.0% - 0.5% ] 0.47% | 12,622,794 | 6.6% |
[ 0.5% - 1.0% ] 0.61% | 10,774,685 | 6.7% |
[ 0.5% - 1.0% ] 0.74% | 5,652,361 | 6.3% |
[ 0.5% - 1.0% ] 0.89% | 4,703,017 | 6.3% |
[ 1.0% - 1.5% ] 1.04% | 3,445,204 | 6.7% |
[ 1.0% - 1.5% ] 1.16% | 3,483,412 | 6.3% |
[ 1.0% - 1.5% ] 1.30% | 2,574,005 | 5.7% |
[ 1.0% - 1.5% ] 1.43% | 1,660,763 | 6.3% |
[ 1.5% - 2.0% ] 1.57% | 1,912,481 | 6.0% |
[ 1.5% - 2.0% ] 1.70% | 1,505,704 | 6.7% |
[ 1.5% - 2.0% ] 1.89% | 10,055,331 | 5.4% |
[ 1.5% - 2.0% ] 1.96% | 1,053,780 | 6.2% |
[ 2.0% - 2.5% ] 2.12% | 1,071,271 | 5.3% |
[ 2.0% - 2.5% ] 2.26% | 634,473 | 6.7% |
[ 2.0% - 2.5% ] 2.38% | 397,576 | 5.2% |
[ 2.5% - 3.0% ] 2.52% | 582,315 | 4.9% |
[ 2.5% - 3.0% ] 2.66% | 715,996 | 5.2% |
[ 2.5% - 3.0% ] 2.80% | 253,434 | 6.7% |
[ 2.5% - 3.0% ] 2.96% | 425,357 | 5.4% |
[ 3.0% - 3.5% ] 3.08% | 251,925 | 8.0% |
[ 3.0% - 3.5% ] 3.21% | 368,546 | 5.7% |
[ 3.0% - 3.5% ] 3.35% | 451,219 | 7.5% |
[ 3.0% - 3.5% ] 3.48% | 469,536 | 5.5% |
[ 3.5% - 4.0% ] 3.58% | 310,108 | 6.2% |
[ 3.5% - 4.0% ] 3.74% | 206,681 | 9.5% |
[ 3.5% - 4.0% ] 3.89% | 185,390 | 5.0% |
[ 4.0% - 4.5% ] 4.04% | 271,086 | 6.4% |
[ 4.0% - 4.5% ] 4.18% | 223,904 | 4.7% |
[ 4.0% - 4.5% ] 4.31% | 123,551 | 5.2% |
[ 4.0% - 4.5% ] 4.41% | 233,758 | 8.8% |
[ 4.5% - 5.0% ] 4.54% | 229,913 | 6.2% |
[ 4.5% - 5.0% ] 4.69% | 162,687 | 5.4% |
[ 4.5% - 5.0% ] 4.82% | 45,945 | 7.0% |
[ 4.5% - 5.0% ] 5.00% | 287,362 | 7.3% |
[ 5.0% - 5.5% ] 5.11% | 173,323 | 5.4% |
[ 5.0% - 5.5% ] 5.29% | 42,553 | 2.4% |
[ 5.0% - 5.5% ] 5.36% | 131,259 | 6.8% |
[ 5.5% - 6.0% ] 5.53% | 131,954 | 4.1% |
[ 5.5% - 6.0% ] 5.69% | 285,904 | 4.8% |
[ 5.5% - 6.0% ] 5.83% | 149,816 | 6.7% |
[ 5.5% - 6.0% ] 5.89% | 129,918 | 7.5% |
[ 6.0% - 6.5% ] 6.04% | 47,505 | 6.9% |
[ 6.0% - 6.5% ] 6.20% | 52,257 | 11.4% |
[ 6.0% - 6.5% ] 6.32% | 65,160 | 4.3% |
[ 6.5% - 7.0% ] 6.58% | 122,164 | 4.8% |
[ 6.5% - 7.0% ] 6.70% | 92,706 | 6.4% |
[ 6.5% - 7.0% ] 6.88% | 61,738 | 6.4% |
[ 6.5% - 7.0% ] 6.97% | 43,908 | 2.4% |
[ 7.0% - 7.5% ] 7.21% | 146,869 | 4.6% |
[ 7.0% - 7.5% ] 7.33% | 226,738 | 8.5% |
[ 7.0% - 7.5% ] 7.45% | 146,631 | 4.6% |
[ 7.5% - 8.0% ] 7.60% | 17,178 | 12.8% |
[ 7.5% - 8.0% ] 7.77% | 927 | 16.1% |
[ 7.5% - 8.0% ] 7.86% | 175,260 | 8.9% |
[ 7.5% - 8.0% ] 7.94% | 135,158 | 4.6% |
[ 8.0% - 8.5% ] 8.42% | 73,006 | 8.6% |
[ 8.5% - 9.0% ] 8.58% | 2,867 | 14.2% |
[ 8.5% - 9.0% ] 8.67% | 221,580 | 6.9% |
[ 9.0% - 9.5% ] 9.10% | 22,099 | 4.4% |
[ 9.0% - 9.5% ] 9.33% | 847 | 21.8% |
[ 9.0% - 9.5% ] 9.48% | 43,517 | 10.7% |
[ 9.5% - 10.0% ] 9.66% | 3,935 | 1.8% |
[ 10.0% - 10.5% ] 10.24% | 13,781 | 6.1% |
[ 10.5% - 11.0% ] 10.88% | 78,506 | 3.4% |
[ 10.5% - 11.0% ] 10.98% | 24,341 | 8.7% |
[ 12.0% - 12.5% ] 12.32% | 68,182 | 3.8% |
[ 12.5% - 13.0% ] 12.63% | 127,927 | 2.8% |
[ 13.5% - 14.0% ] 13.81% | 71,862 | 5.5% |
[ 14.0% - 14.5% ] 14.01% | 32,296 | 5.6% |
[ 14.0% - 14.5% ] 14.12% | 21,329 | 9.6% |
[ 14.5% - 15.0% ] 14.81% | 117,452 | 6.8% |
[ 14.5% - 15.0% ] 14.93% | 40,593 | 5.3% |
[ 15.0% - 15.5% ] 15.27% | 62,232 | 4.2% |
[ 15.5% - 16.0% ] 15.63% | 52,792 | 6.9% |
[ 16.0% - 16.5% ] 16.14% | 72,273 | 12.1% |
[ 16.5% - 17.0% ] 16.72% | 84,905 | 4.7% |
[ 16.5% - 17.0% ] 16.98% | 73,987 | 5.3% |
[ 18.5% - 19.0% ] 18.73% | 35,914 | 12.8% |
[ 19.0% - 19.5% ] 19.17% | 52,000 | 5.7% |
[ 19.0% - 19.5% ] 19.50% | 21,977 | 12.2% |
[ 19.5% - 20.0% ] 19.78% | 10,526 | 3.6% |