Immigrants from North Macedonia Disability Age 5 to 17

COMPARE

Immigrants from North Macedonia
Race
Ancestry
AfghanAfricanAlaska NativeAlaskan AthabascanAlbanianAleutAlsatianAmericanApacheArabArapahoArgentineanArmenianAssyrian/Chaldean/SyriacAustralianAustrianBahamianBangladeshiBarbadianBasqueBelgianBelizeanBermudanBhutaneseBlackfeetBolivianBrazilianBritishBritish West IndianBulgarianBurmeseCajunCambodianCanadianCape VerdeanCarpatho RusynCelticCentral AmericanCentral American IndianCherokeeCheyenneChickasawChileanChineseChippewaChoctawColombianColvilleComancheCosta RicanCreeCreekCroatianCrowCubanCypriotCzechCzechoslovakianDanishDelawareDominicanDutchDutch West IndianEastern EuropeanEcuadorianEgyptianEnglishEstonianEthiopianEuropeanFijianFilipinoFinnishFrenchFrench American IndianFrench CanadianGermanGerman RussianGhanaianGreekGuamanian/ChamorroGuatemalanGuyaneseHaitianHmongHonduranHopiHoumaHungarianIcelanderIndian (Asian)IndonesianInupiatIranianIraqiIrishIroquoisIsraeliItalianJamaicanJapaneseJordanianKenyanKiowaKoreanLaotianLatvianLebaneseLiberianLithuanianLumbeeLuxembourgerMacedonianMalaysianMalteseMarshalleseMenomineeMexicanMexican American IndianMongolianMoroccanNative HawaiianNavajoNepaleseNew ZealanderNicaraguanNigerianNorthern EuropeanNorwegianOkinawanOsageOttawaPaiutePakistaniPalestinianPanamanianParaguayanPennsylvania GermanPeruvianPimaPolishPortuguesePotawatomiPuebloPuerto RicanPuget Sound SalishRomanianRussianSalvadoranSamoanScandinavianScotch-IrishScottishSeminoleSenegaleseSerbianShoshoneSierra LeoneanSiouxSlavicSlovakSloveneSomaliSouth AfricanSouth AmericanSouth American IndianSoviet UnionSpaniardSpanishSpanish AmericanSpanish American IndianSri LankanSubsaharan AfricanSudaneseSwedishSwissSyrianTaiwaneseThaiTlingit-HaidaTohono O'OdhamTonganTrinidadian and TobagonianTsimshianTurkishU.S. Virgin IslanderUgandanUkrainianUruguayanUteVenezuelanVietnameseWelshWest IndianYakamaYaquiYugoslavianYumanYup'ikZimbabwean
Immigration
NonimmigrantsImmigrantsAfghanistanAfricaAlbaniaArgentinaArmeniaAsiaAustraliaAustriaBahamasBangladeshBarbadosBelarusBelgiumBelizeBoliviaBosnia and HerzegovinaBrazilBulgariaBurma/MyanmarCabo VerdeCambodiaCameroonCanadaCaribbeanCentral AmericaChileChinaColombiaCongoCosta RicaCroatiaCubaCzechoslovakiaDenmarkDominicaDominican RepublicEastern AfricaEastern AsiaEastern EuropeEcuadorEgyptEl SalvadorEnglandEritreaEthiopiaEuropeFijiFranceGermanyGhanaGreeceGrenadaGuatemalaGuyanaHaitiHondurasHong KongHungaryIndiaIndonesiaIranIraqIrelandIsraelItalyJamaicaJapanJordanKazakhstanKenyaKoreaKuwaitLaosLatin AmericaLatviaLebanonLiberiaLithuaniaMalaysiaMexicoMicronesiaMiddle AfricaMoldovaMoroccoNepalNetherlandsNicaraguaNigeriaNorth AmericaNorth MacedoniaNorthern AfricaNorthern EuropeNorwayOceaniaPakistanPanamaPeruPhilippinesPolandPortugalRomaniaRussiaSaudi ArabiaScotlandSenegalSerbiaSierra LeoneSingaporeSomaliaSouth AfricaSouth AmericaSouth Central AsiaSouth Eastern AsiaSouthern EuropeSpainSri LankaSt. Vincent and the GrenadinesSudanSwedenSwitzerlandSyriaTaiwanThailandTrinidad and TobagoTurkeyUgandaUkraineUruguayUzbekistanVenezuelaVietnamWest IndiesWestern AfricaWestern AsiaWestern EuropeYemenZaireZimbabweAzores
Select to Compare
Race
Ancestry
AfghanAfricanAlaska NativeAlaskan AthabascanAlbanianAleutAlsatianAmericanApacheArabArapahoArgentineanArmenianAssyrian/Chaldean/SyriacAustralianAustrianBahamianBangladeshiBarbadianBasqueBelgianBelizeanBermudanBhutaneseBlackfeetBolivianBrazilianBritishBritish West IndianBulgarianBurmeseCajunCambodianCanadianCape VerdeanCarpatho RusynCelticCentral AmericanCentral American IndianCherokeeCheyenneChickasawChileanChineseChippewaChoctawColombianColvilleComancheCosta RicanCreeCreekCroatianCrowCubanCypriotCzechCzechoslovakianDanishDelawareDominicanDutchDutch West IndianEastern EuropeanEcuadorianEgyptianEnglishEstonianEthiopianEuropeanFijianFilipinoFinnishFrenchFrench American IndianFrench CanadianGermanGerman RussianGhanaianGreekGuamanian/ChamorroGuatemalanGuyaneseHaitianHmongHonduranHopiHoumaHungarianIcelanderIndian (Asian)IndonesianInupiatIranianIraqiIrishIroquoisIsraeliItalianJamaicanJapaneseJordanianKenyanKiowaKoreanLaotianLatvianLebaneseLiberianLithuanianLumbeeLuxembourgerMacedonianMalaysianMalteseMarshalleseMenomineeMexicanMexican American IndianMongolianMoroccanNative HawaiianNavajoNepaleseNew ZealanderNicaraguanNigerianNorthern EuropeanNorwegianOkinawanOsageOttawaPaiutePakistaniPalestinianPanamanianParaguayanPennsylvania GermanPeruvianPimaPolishPortuguesePotawatomiPuebloPuerto RicanPuget Sound SalishRomanianRussianSalvadoranSamoanScandinavianScotch-IrishScottishSeminoleSenegaleseSerbianShoshoneSierra LeoneanSiouxSlavicSlovakSloveneSomaliSouth AfricanSouth AmericanSouth American IndianSoviet UnionSpaniardSpanishSpanish AmericanSpanish American IndianSri LankanSubsaharan AfricanSudaneseSwedishSwissSyrianTaiwaneseThaiTlingit-HaidaTohono O'OdhamTonganTrinidadian and TobagonianTsimshianTurkishU.S. Virgin IslanderUgandanUkrainianUruguayanUteVenezuelanVietnameseWelshWest IndianYakamaYaquiYugoslavianYumanYup'ikZimbabwean
Immigration
NonimmigrantsImmigrantsAfghanistanAfricaAlbaniaArgentinaArmeniaAsiaAustraliaAustriaBahamasBangladeshBarbadosBelarusBelgiumBelizeBoliviaBosnia and HerzegovinaBrazilBulgariaBurma/MyanmarCabo VerdeCambodiaCameroonCanadaCaribbeanCentral AmericaChileChinaColombiaCongoCosta RicaCroatiaCubaCzechoslovakiaDenmarkDominicaDominican RepublicEastern AfricaEastern AsiaEastern EuropeEcuadorEgyptEl SalvadorEnglandEritreaEthiopiaEuropeFijiFranceGermanyGhanaGreeceGrenadaGuatemalaGuyanaHaitiHondurasHong KongHungaryIndiaIndonesiaIranIraqIrelandIsraelItalyJamaicaJapanJordanKazakhstanKenyaKoreaKuwaitLaosLatin AmericaLatviaLebanonLiberiaLithuaniaMalaysiaMexicoMicronesiaMiddle AfricaMoldovaMoroccoNepalNetherlandsNicaraguaNigeriaNorth AmericaNorthern AfricaNorthern EuropeNorwayOceaniaPakistanPanamaPeruPhilippinesPolandPortugalRomaniaRussiaSaudi ArabiaScotlandSenegalSerbiaSierra LeoneSingaporeSomaliaSouth AfricaSouth AmericaSouth Central AsiaSouth Eastern AsiaSouthern EuropeSpainSri LankaSt. Vincent and the GrenadinesSudanSwedenSwitzerlandSyriaTaiwanThailandTrinidad and TobagoTurkeyUgandaUkraineUruguayUzbekistanVenezuelaVietnamWest IndiesWestern AfricaWestern AsiaWestern EuropeYemenZaireZimbabweAzores
Disability Age 5 to 17
Income
Poverty
Unemployment
Labor Participation
Family Structure
Vehicle Availability
Education Level
Disability

Immigrants from North Macedonia Disability Age 5 to 17
Exceptional

5.1%
DISABILITY | AGE 5 TO 17
99.9/ 100
METRIC RATING
59th/ 347
METRIC RANK

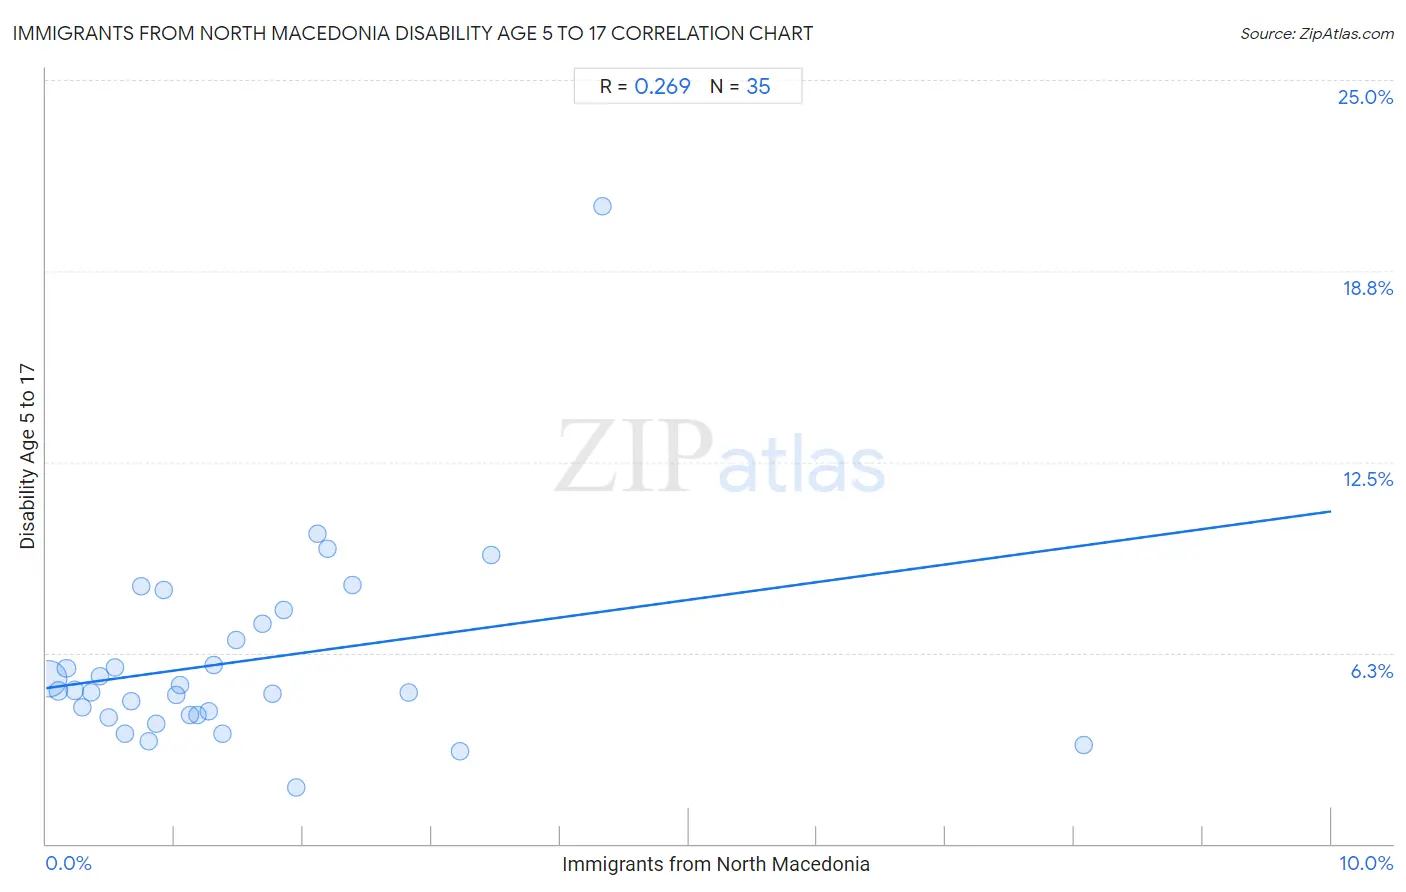
Immigrants from North Macedonia Disability Age 5 to 17 Correlation Chart

The statistical analysis conducted on geographies consisting of 74,064,473 people shows a weak positive correlation between the proportion of Immigrants from North Macedonia and percentage of population with a disability between the ages 5 and 17 in the United States with a correlation coefficient (R) of 0.269 and weighted average of 5.1%. On average, for every 1% (one percent) increase in Immigrants from North Macedonia within a typical geography, there is an increase of 0.58% in percentage of population with a disability between the ages 5 and 17.
Immigrants from North Macedonia Disability Age 5 to 17
It is essential to understand that the correlation between the percentage of Immigrants from North Macedonia and percentage of population with a disability between the ages 5 and 17 does not imply a direct cause-and-effect relationship. It remains uncertain whether the presence of Immigrants from North Macedonia influences an upward or downward trend in the level of percentage of population with a disability between the ages 5 and 17 within an area, or if Immigrants from North Macedonia simply ended up residing in those areas with higher or lower levels of percentage of population with a disability between the ages 5 and 17 due to other factors.

Demographics Similar to Immigrants from North Macedonia by Disability Age 5 to 17

In terms of disability age 5 to 17, the demographic groups most similar to Immigrants from North Macedonia are Immigrants from Eastern Europe (5.1%, a difference of 0.11%), Immigrants from Ukraine (5.1%, a difference of 0.18%), Immigrants from Poland (5.1%, a difference of 0.26%), Immigrants from Turkey (5.1%, a difference of 0.41%), and Laotian (5.1%, a difference of 0.42%).
DemographicsRating | RankDisability Age 5 to 17
Immigrants from Fiji
99.9
/100
|
#52
Exceptional
5.1%
Immigrants from Lithuania
99.9
/100
|
#53
Exceptional
5.1%
Paraguayans
99.9
/100
|
#54
Exceptional
5.1%
Laotians
99.9
/100
|
#55
Exceptional
5.1%
Immigrants from Turkey
99.9
/100
|
#56
Exceptional
5.1%
Immigrants from Poland
99.9
/100
|
#57
Exceptional
5.1%
Immigrants from Ukraine
99.9
/100
|
#58
Exceptional
5.1%
Immigrants from North Macedonia
99.9
/100
|
#59
Exceptional
5.1%
Immigrants from Eastern Europe
99.9
/100
|
#60
Exceptional
5.1%
Immigrants from Switzerland
99.8
/100
|
#61
Exceptional
5.2%
Immigrants from Ireland
99.8
/100
|
#62
Exceptional
5.2%
Immigrants from Bangladesh
99.8
/100
|
#63
Exceptional
5.2%
Immigrants from South Eastern Asia
99.8
/100
|
#64
Exceptional
5.2%
Immigrants from Greece
99.8
/100
|
#65
Exceptional
5.2%
Palestinians
99.8
/100
|
#66
Exceptional
5.2%

Immigrants from North Macedonia Disability Age 5 to 17 Correlation Summary

MeasurementImmigrants from North Macedonia DataDisability Age 5 to 17 Data
Minimum0.019%1.9%
Maximum8.1%20.9%
Range8.1%19.0%
Mean1.5%6.0%
Median1.1%5.0%
Interquartile 25% (IQ1)0.54%4.2%
Interquartile 75% (IQ3)1.9%7.2%
Interquartile Range (IQR)1.4%3.0%
Standard Deviation (Sample)1.5%3.3%
Standard Deviation (Population)1.5%3.2%

Correlation Details

Immigrants from North Macedonia PercentileSample SizeDisability Age 5 to 17
[
0.0%
-
0.5%
]
0.019%
59,712,5325.4%
[
0.0%
-
0.5%
]
0.093%
6,273,2765.0%
[
0.0%
-
0.5%
]
0.16%
2,665,0055.7%
[
0.0%
-
0.5%
]
0.22%
1,812,4795.0%
[
0.0%
-
0.5%
]
0.28%
883,9644.5%
[
0.0%
-
0.5%
]
0.35%
622,0075.0%
[
0.0%
-
0.5%
]
0.42%
278,1785.5%
[
0.0%
-
0.5%
]
0.48%
368,1674.1%
[
0.5%
-
1.0%
]
0.54%
214,6925.8%
[
0.5%
-
1.0%
]
0.61%
229,9413.6%
[
0.5%
-
1.0%
]
0.66%
210,7374.7%
[
0.5%
-
1.0%
]
0.74%
93,4178.4%
[
0.5%
-
1.0%
]
0.80%
153,2103.4%
[
0.5%
-
1.0%
]
0.85%
19,5843.9%
[
0.5%
-
1.0%
]
0.92%
9,1478.3%
[
1.0%
-
1.5%
]
1.01%
31,8344.9%
[
1.0%
-
1.5%
]
1.04%
13,8825.2%
[
1.0%
-
1.5%
]
1.12%
50,4584.2%
[
1.0%
-
1.5%
]
1.17%
55,7674.2%
[
1.0%
-
1.5%
]
1.26%
34,7504.3%
[
1.0%
-
1.5%
]
1.30%
19,9835.9%
[
1.0%
-
1.5%
]
1.37%
82,2083.6%
[
1.0%
-
1.5%
]
1.48%
43,3046.7%
[
1.5%
-
2.0%
]
1.68%
3,0357.2%
[
1.5%
-
2.0%
]
1.76%
16,1834.9%
[
1.5%
-
2.0%
]
1.85%
42,5227.6%
[
1.5%
-
2.0%
]
1.95%
20,3101.9%
[
2.0%
-
2.5%
]
2.12%
15,45910.2%
[
2.0%
-
2.5%
]
2.19%
3,0669.7%
[
2.0%
-
2.5%
]
2.38%
3,7818.5%
[
2.5%
-
3.0%
]
2.82%
64,9444.9%
[
3.0%
-
3.5%
]
3.22%
10,9423.0%
[
3.0%
-
3.5%
]
3.47%
2,9999.5%
[
4.0%
-
4.5%
]
4.33%
1,40920.9%
[
8.0%
-
8.5%
]
8.07%
1,3013.2%