Immigrants from Kenya Disability Age 5 to 17
COMPARE
Immigrants from Kenya
Select to Compare
Disability Age 5 to 17
Immigrants from Kenya Disability Age 5 to 17
5.8%
DISABILITY | AGE 5 TO 17
3.4/ 100
METRIC RATING
234th/ 347
METRIC RANK
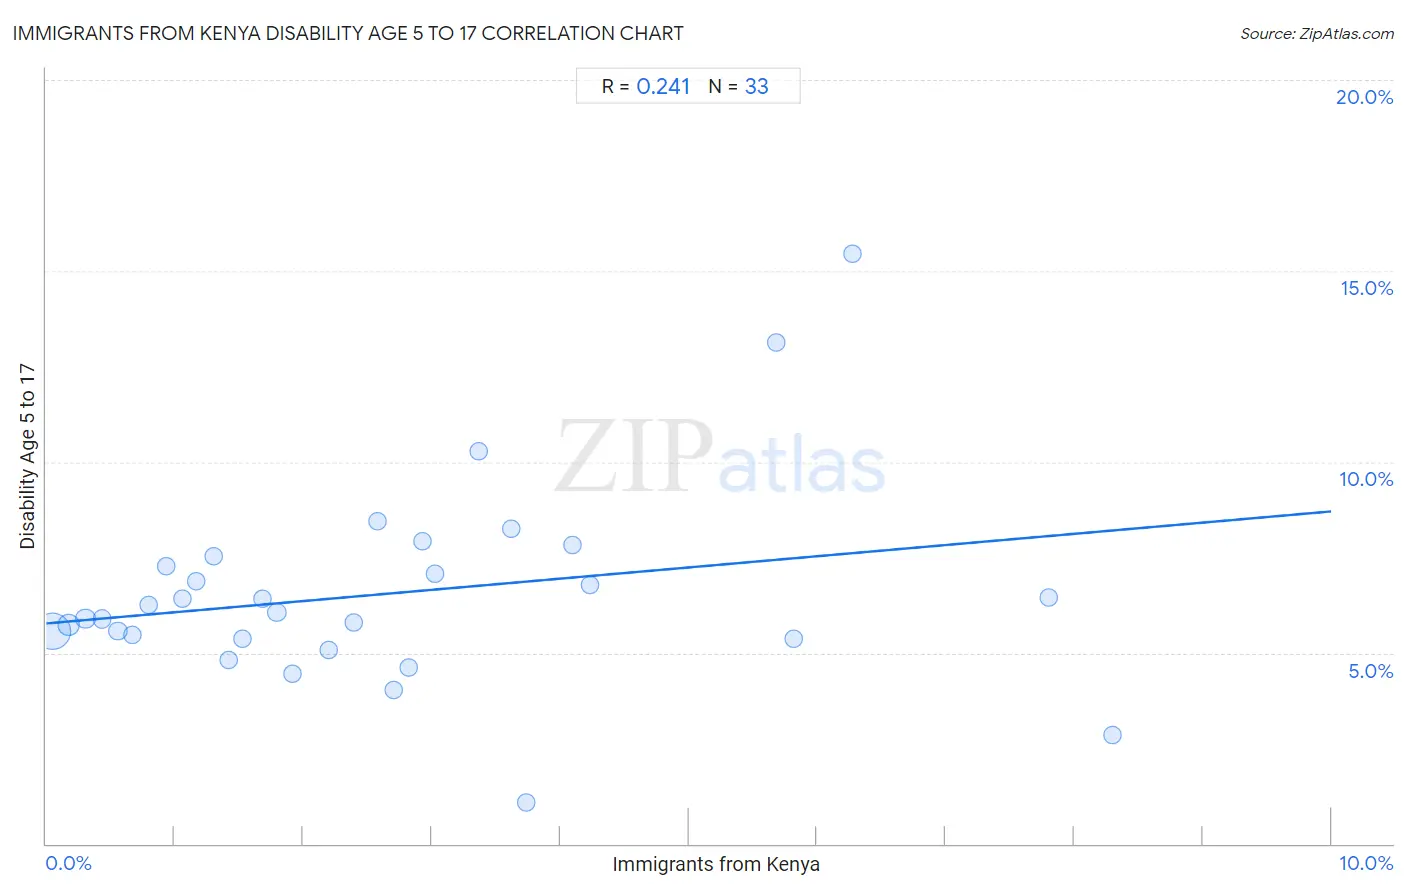
Immigrants from Kenya Disability Age 5 to 17 Correlation Chart
The statistical analysis conducted on geographies consisting of 217,149,676 people shows a weak positive correlation between the proportion of Immigrants from Kenya and percentage of population with a disability between the ages 5 and 17 in the United States with a correlation coefficient (R) of 0.241 and weighted average of 5.8%. On average, for every 1% (one percent) increase in Immigrants from Kenya within a typical geography, there is an increase of 0.29% in percentage of population with a disability between the ages 5 and 17.
It is essential to understand that the correlation between the percentage of Immigrants from Kenya and percentage of population with a disability between the ages 5 and 17 does not imply a direct cause-and-effect relationship. It remains uncertain whether the presence of Immigrants from Kenya influences an upward or downward trend in the level of percentage of population with a disability between the ages 5 and 17 within an area, or if Immigrants from Kenya simply ended up residing in those areas with higher or lower levels of percentage of population with a disability between the ages 5 and 17 due to other factors.
Demographics Similar to Immigrants from Kenya by Disability Age 5 to 17
In terms of disability age 5 to 17, the demographic groups most similar to Immigrants from Kenya are Malaysian (5.8%, a difference of 0.010%), Immigrants from West Indies (5.8%, a difference of 0.040%), Immigrants from Brazil (5.8%, a difference of 0.070%), Immigrants from Laos (5.8%, a difference of 0.13%), and Sudanese (5.8%, a difference of 0.22%).
| Demographics | Rating | Rank | Disability Age 5 to 17 |
| Swiss | 5.1 /100 | #227 | Tragic 5.8% |
| Haitians | 4.8 /100 | #228 | Tragic 5.8% |
| Bangladeshis | 4.8 /100 | #229 | Tragic 5.8% |
| Ghanaians | 4.7 /100 | #230 | Tragic 5.8% |
| Europeans | 4.5 /100 | #231 | Tragic 5.8% |
| Immigrants from Laos | 3.8 /100 | #232 | Tragic 5.8% |
| Immigrants from West Indies | 3.5 /100 | #233 | Tragic 5.8% |
| Immigrants from Kenya | 3.4 /100 | #234 | Tragic 5.8% |
| Malaysians | 3.4 /100 | #235 | Tragic 5.8% |
| Immigrants from Brazil | 3.2 /100 | #236 | Tragic 5.8% |
| Sudanese | 2.9 /100 | #237 | Tragic 5.8% |
| Hungarians | 2.6 /100 | #238 | Tragic 5.8% |
| German Russians | 2.4 /100 | #239 | Tragic 5.9% |
| West Indians | 2.4 /100 | #240 | Tragic 5.9% |
| Immigrants from Caribbean | 2.1 /100 | #241 | Tragic 5.9% |
Immigrants from Kenya Disability Age 5 to 17 Correlation Summary
| Measurement | Immigrants from Kenya Data | Disability Age 5 to 17 Data |
| Minimum | 0.045% | 1.1% |
| Maximum | 8.3% | 15.4% |
| Range | 8.3% | 14.4% |
| Mean | 2.6% | 6.5% |
| Median | 2.2% | 6.0% |
| Interquartile 25% (IQ1) | 1.00% | 5.4% |
| Interquartile 75% (IQ3) | 3.7% | 7.4% |
| Interquartile Range (IQR) | 2.7% | 2.0% |
| Standard Deviation (Sample) | 2.2% | 2.6% |
| Standard Deviation (Population) | 2.1% | 2.6% |
Correlation Details
| Immigrants from Kenya Percentile | Sample Size | Disability Age 5 to 17 |
[ 0.0% - 0.5% ] 0.045% | 154,378,325 | 5.6% |
[ 0.0% - 0.5% ] 0.17% | 32,964,724 | 5.7% |
[ 0.0% - 0.5% ] 0.31% | 12,041,623 | 5.9% |
[ 0.0% - 0.5% ] 0.44% | 6,397,995 | 5.9% |
[ 0.5% - 1.0% ] 0.56% | 3,896,412 | 5.6% |
[ 0.5% - 1.0% ] 0.67% | 1,883,994 | 5.5% |
[ 0.5% - 1.0% ] 0.79% | 1,439,595 | 6.3% |
[ 0.5% - 1.0% ] 0.94% | 947,243 | 7.3% |
[ 1.0% - 1.5% ] 1.06% | 813,323 | 6.4% |
[ 1.0% - 1.5% ] 1.16% | 563,461 | 6.9% |
[ 1.0% - 1.5% ] 1.30% | 386,440 | 7.5% |
[ 1.0% - 1.5% ] 1.42% | 305,227 | 4.8% |
[ 1.5% - 2.0% ] 1.53% | 253,796 | 5.4% |
[ 1.5% - 2.0% ] 1.68% | 102,558 | 6.4% |
[ 1.5% - 2.0% ] 1.79% | 228,563 | 6.0% |
[ 1.5% - 2.0% ] 1.92% | 113,398 | 4.5% |
[ 2.0% - 2.5% ] 2.20% | 189,884 | 5.1% |
[ 2.0% - 2.5% ] 2.39% | 49,951 | 5.8% |
[ 2.5% - 3.0% ] 2.58% | 27,290 | 8.4% |
[ 2.5% - 3.0% ] 2.71% | 14,076 | 4.0% |
[ 2.5% - 3.0% ] 2.82% | 61,065 | 4.6% |
[ 2.5% - 3.0% ] 2.93% | 16,884 | 7.9% |
[ 3.0% - 3.5% ] 3.02% | 15,021 | 7.1% |
[ 3.0% - 3.5% ] 3.36% | 2,618 | 10.3% |
[ 3.5% - 4.0% ] 3.62% | 8,892 | 8.2% |
[ 3.5% - 4.0% ] 3.74% | 10,811 | 1.1% |
[ 4.0% - 4.5% ] 4.10% | 2,464 | 7.8% |
[ 4.0% - 4.5% ] 4.23% | 24,008 | 6.8% |
[ 5.5% - 6.0% ] 5.68% | 3,838 | 13.1% |
[ 5.5% - 6.0% ] 5.82% | 3,214 | 5.4% |
[ 6.0% - 6.5% ] 6.27% | 1,403 | 15.4% |
[ 7.5% - 8.0% ] 7.80% | 423 | 6.5% |
[ 8.0% - 8.5% ] 8.30% | 1,157 | 2.8% |