Macedonian Disability Age 5 to 17
COMPARE
Macedonian
Select to Compare
Disability Age 5 to 17
Macedonian Disability Age 5 to 17
5.2%
DISABILITY | AGE 5 TO 17
99.8/ 100
METRIC RATING
67th/ 347
METRIC RANK
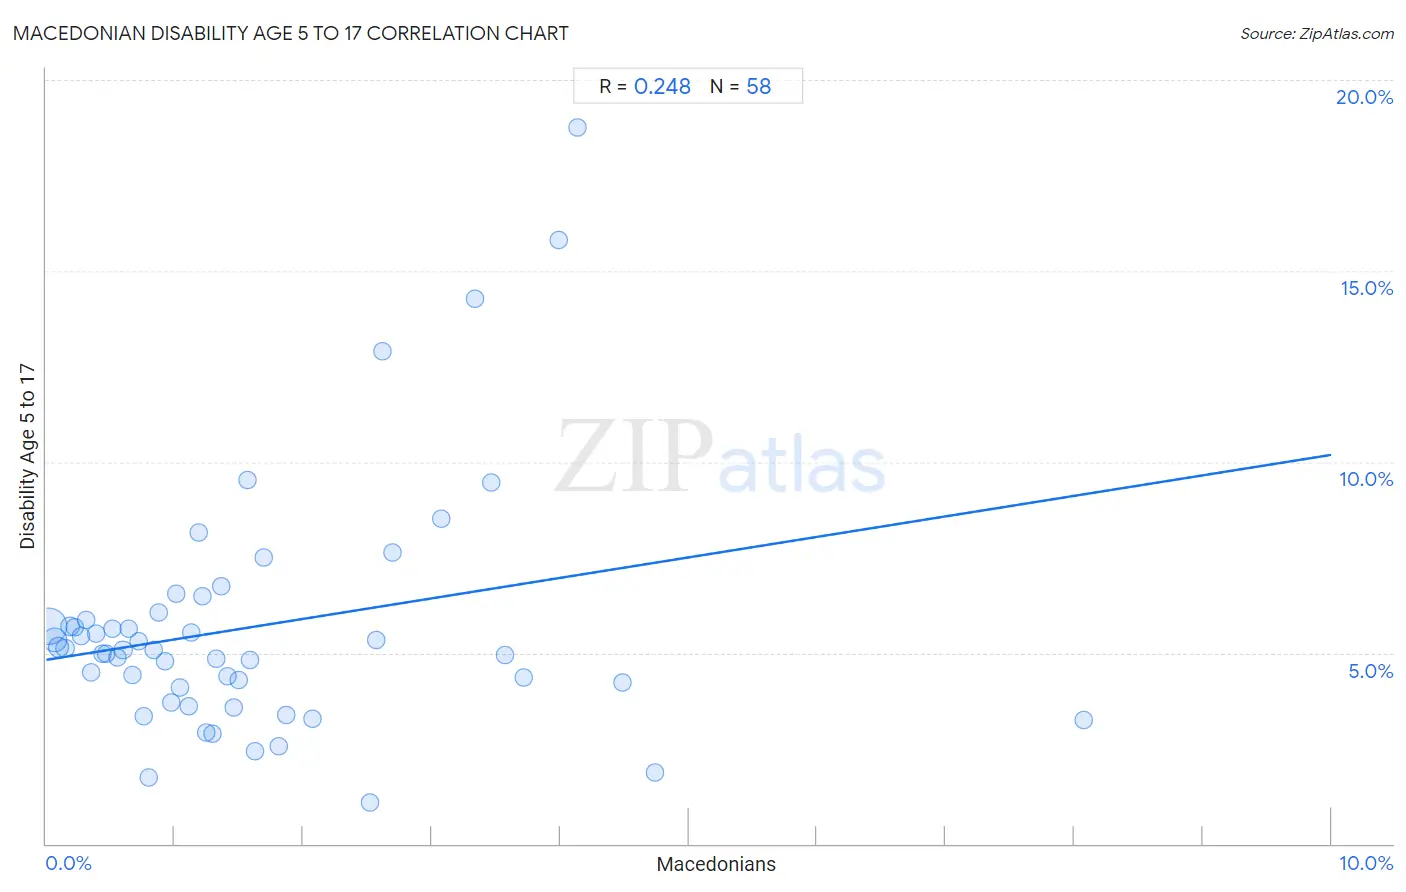
Macedonian Disability Age 5 to 17 Correlation Chart
The statistical analysis conducted on geographies consisting of 132,067,299 people shows a weak positive correlation between the proportion of Macedonians and percentage of population with a disability between the ages 5 and 17 in the United States with a correlation coefficient (R) of 0.248 and weighted average of 5.2%. On average, for every 1% (one percent) increase in Macedonians within a typical geography, there is an increase of 0.54% in percentage of population with a disability between the ages 5 and 17.
It is essential to understand that the correlation between the percentage of Macedonians and percentage of population with a disability between the ages 5 and 17 does not imply a direct cause-and-effect relationship. It remains uncertain whether the presence of Macedonians influences an upward or downward trend in the level of percentage of population with a disability between the ages 5 and 17 within an area, or if Macedonians simply ended up residing in those areas with higher or lower levels of percentage of population with a disability between the ages 5 and 17 due to other factors.
Demographics Similar to Macedonians by Disability Age 5 to 17
In terms of disability age 5 to 17, the demographic groups most similar to Macedonians are Palestinian (5.2%, a difference of 0.030%), Immigrants from Greece (5.2%, a difference of 0.070%), Immigrants from South Eastern Asia (5.2%, a difference of 0.080%), Immigrants from Bangladesh (5.2%, a difference of 0.11%), and Immigrants from Syria (5.2%, a difference of 0.14%).
| Demographics | Rating | Rank | Disability Age 5 to 17 |
| Immigrants from Eastern Europe | 99.9 /100 | #60 | Exceptional 5.1% |
| Immigrants from Switzerland | 99.8 /100 | #61 | Exceptional 5.2% |
| Immigrants from Ireland | 99.8 /100 | #62 | Exceptional 5.2% |
| Immigrants from Bangladesh | 99.8 /100 | #63 | Exceptional 5.2% |
| Immigrants from South Eastern Asia | 99.8 /100 | #64 | Exceptional 5.2% |
| Immigrants from Greece | 99.8 /100 | #65 | Exceptional 5.2% |
| Palestinians | 99.8 /100 | #66 | Exceptional 5.2% |
| Macedonians | 99.8 /100 | #67 | Exceptional 5.2% |
| Immigrants from Syria | 99.7 /100 | #68 | Exceptional 5.2% |
| Guyanese | 99.7 /100 | #69 | Exceptional 5.2% |
| Immigrants from Belgium | 99.7 /100 | #70 | Exceptional 5.2% |
| Jordanians | 99.7 /100 | #71 | Exceptional 5.2% |
| Immigrants from Vietnam | 99.7 /100 | #72 | Exceptional 5.2% |
| Immigrants from Czechoslovakia | 99.7 /100 | #73 | Exceptional 5.2% |
| Immigrants from Romania | 99.7 /100 | #74 | Exceptional 5.2% |
Macedonian Disability Age 5 to 17 Correlation Summary
| Measurement | Macedonian Data | Disability Age 5 to 17 Data |
| Minimum | 0.016% | 1.1% |
| Maximum | 8.1% | 18.8% |
| Range | 8.1% | 17.7% |
| Mean | 1.6% | 5.7% |
| Median | 1.2% | 5.1% |
| Interquartile 25% (IQ1) | 0.60% | 4.1% |
| Interquartile 75% (IQ3) | 2.1% | 5.9% |
| Interquartile Range (IQR) | 1.5% | 1.8% |
| Standard Deviation (Sample) | 1.5% | 3.2% |
| Standard Deviation (Population) | 1.5% | 3.2% |
Correlation Details
| Macedonian Percentile | Sample Size | Disability Age 5 to 17 |
[ 0.0% - 0.5% ] 0.016% | 75,248,417 | 5.7% |
[ 0.0% - 0.5% ] 0.065% | 26,124,505 | 5.4% |
[ 0.0% - 0.5% ] 0.098% | 11,856,355 | 5.1% |
[ 0.0% - 0.5% ] 0.14% | 4,421,288 | 5.1% |
[ 0.0% - 0.5% ] 0.18% | 4,045,760 | 5.7% |
[ 0.0% - 0.5% ] 0.22% | 2,022,428 | 5.7% |
[ 0.0% - 0.5% ] 0.27% | 1,338,529 | 5.4% |
[ 0.0% - 0.5% ] 0.31% | 680,807 | 5.9% |
[ 0.0% - 0.5% ] 0.35% | 984,895 | 4.5% |
[ 0.0% - 0.5% ] 0.39% | 947,307 | 5.5% |
[ 0.0% - 0.5% ] 0.43% | 348,538 | 5.0% |
[ 0.0% - 0.5% ] 0.47% | 388,440 | 5.0% |
[ 0.5% - 1.0% ] 0.51% | 429,690 | 5.6% |
[ 0.5% - 1.0% ] 0.56% | 315,771 | 4.9% |
[ 0.5% - 1.0% ] 0.60% | 313,991 | 5.1% |
[ 0.5% - 1.0% ] 0.64% | 181,308 | 5.6% |
[ 0.5% - 1.0% ] 0.67% | 210,921 | 4.4% |
[ 0.5% - 1.0% ] 0.72% | 235,931 | 5.3% |
[ 0.5% - 1.0% ] 0.76% | 255,661 | 3.4% |
[ 0.5% - 1.0% ] 0.79% | 159,869 | 1.7% |
[ 0.5% - 1.0% ] 0.84% | 255,629 | 5.1% |
[ 0.5% - 1.0% ] 0.88% | 102,551 | 6.1% |
[ 0.5% - 1.0% ] 0.93% | 48,026 | 4.8% |
[ 0.5% - 1.0% ] 0.97% | 40,997 | 3.7% |
[ 1.0% - 1.5% ] 1.01% | 21,399 | 6.5% |
[ 1.0% - 1.5% ] 1.04% | 142,197 | 4.1% |
[ 1.0% - 1.5% ] 1.11% | 34,403 | 3.6% |
[ 1.0% - 1.5% ] 1.12% | 40,050 | 5.5% |
[ 1.0% - 1.5% ] 1.19% | 70,109 | 8.2% |
[ 1.0% - 1.5% ] 1.22% | 121,779 | 6.5% |
[ 1.0% - 1.5% ] 1.24% | 80,928 | 2.9% |
[ 1.0% - 1.5% ] 1.29% | 41,610 | 2.9% |
[ 1.0% - 1.5% ] 1.32% | 1,590 | 4.8% |
[ 1.0% - 1.5% ] 1.37% | 62,047 | 6.8% |
[ 1.0% - 1.5% ] 1.42% | 13,778 | 4.4% |
[ 1.0% - 1.5% ] 1.46% | 54,704 | 3.6% |
[ 1.0% - 1.5% ] 1.50% | 14,072 | 4.3% |
[ 1.5% - 2.0% ] 1.56% | 11,197 | 9.5% |
[ 1.5% - 2.0% ] 1.59% | 114,977 | 4.8% |
[ 1.5% - 2.0% ] 1.63% | 24,333 | 2.4% |
[ 1.5% - 2.0% ] 1.69% | 7,219 | 7.5% |
[ 1.5% - 2.0% ] 1.81% | 39,823 | 2.6% |
[ 1.5% - 2.0% ] 1.87% | 7,763 | 3.4% |
[ 2.0% - 2.5% ] 2.07% | 19,956 | 3.3% |
[ 2.5% - 3.0% ] 2.52% | 32,193 | 1.1% |
[ 2.5% - 3.0% ] 2.57% | 5,185 | 5.3% |
[ 2.5% - 3.0% ] 2.62% | 458 | 12.9% |
[ 2.5% - 3.0% ] 2.69% | 42,522 | 7.6% |
[ 3.0% - 3.5% ] 3.08% | 1,625 | 8.5% |
[ 3.0% - 3.5% ] 3.33% | 270 | 14.3% |
[ 3.0% - 3.5% ] 3.47% | 2,999 | 9.5% |
[ 3.5% - 4.0% ] 3.57% | 64,944 | 4.9% |
[ 3.5% - 4.0% ] 3.72% | 6,322 | 4.3% |
[ 3.5% - 4.0% ] 3.99% | 4,993 | 15.8% |
[ 4.0% - 4.5% ] 4.14% | 266 | 18.8% |
[ 4.0% - 4.5% ] 4.49% | 2,363 | 4.2% |
[ 4.5% - 5.0% ] 4.74% | 20,310 | 1.9% |
[ 8.0% - 8.5% ] 8.07% | 1,301 | 3.2% |