Uruguayan Disability Age 5 to 17
COMPARE
Uruguayan
Select to Compare
Disability Age 5 to 17
Uruguayan Disability Age 5 to 17
5.6%
DISABILITY | AGE 5 TO 17
51.0/ 100
METRIC RATING
173rd/ 347
METRIC RANK
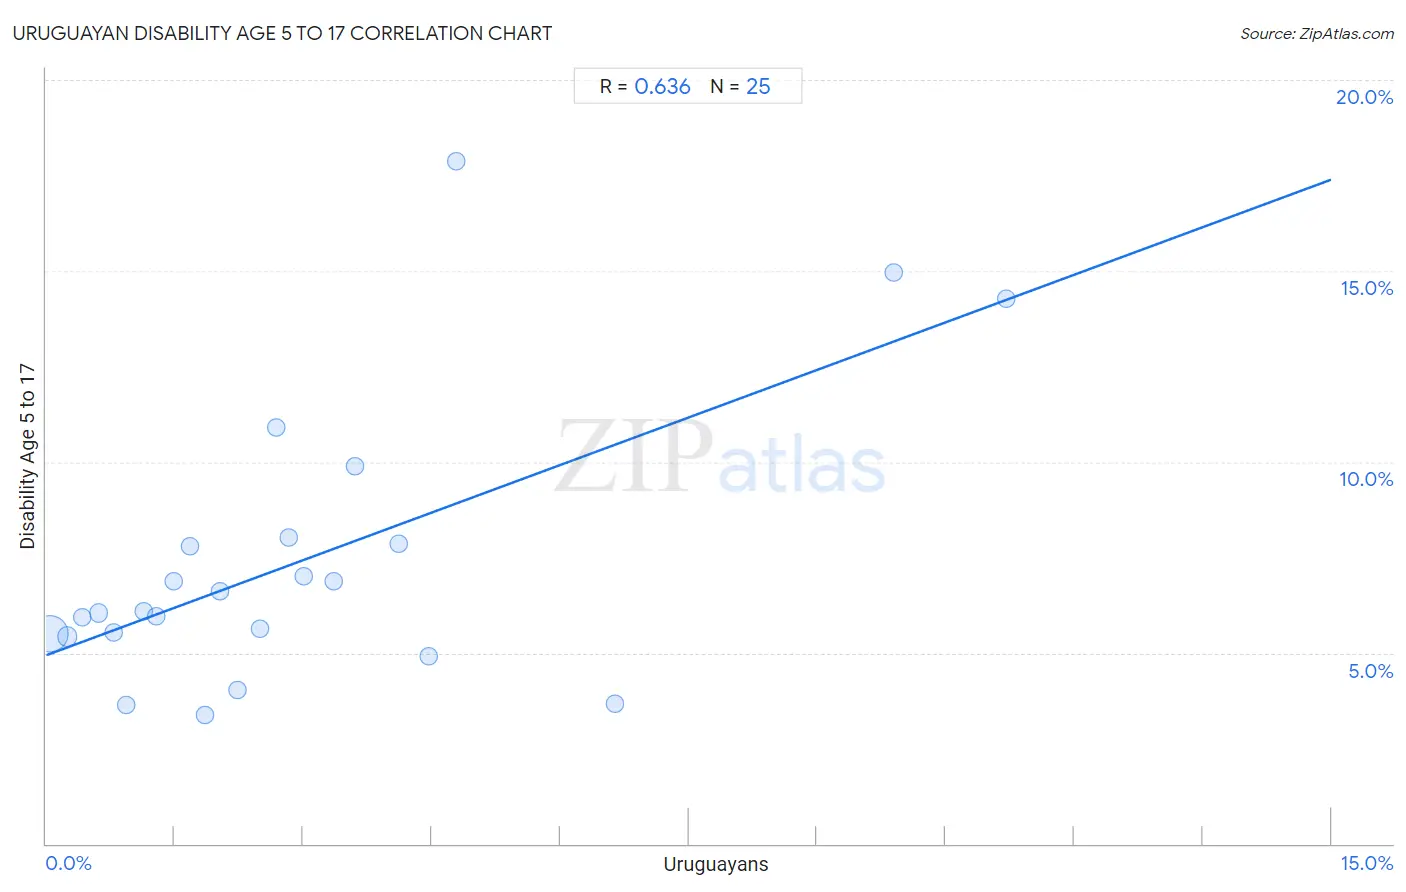
Uruguayan Disability Age 5 to 17 Correlation Chart
The statistical analysis conducted on geographies consisting of 144,432,233 people shows a significant positive correlation between the proportion of Uruguayans and percentage of population with a disability between the ages 5 and 17 in the United States with a correlation coefficient (R) of 0.636 and weighted average of 5.6%. On average, for every 1% (one percent) increase in Uruguayans within a typical geography, there is an increase of 0.83% in percentage of population with a disability between the ages 5 and 17.
It is essential to understand that the correlation between the percentage of Uruguayans and percentage of population with a disability between the ages 5 and 17 does not imply a direct cause-and-effect relationship. It remains uncertain whether the presence of Uruguayans influences an upward or downward trend in the level of percentage of population with a disability between the ages 5 and 17 within an area, or if Uruguayans simply ended up residing in those areas with higher or lower levels of percentage of population with a disability between the ages 5 and 17 due to other factors.
Demographics Similar to Uruguayans by Disability Age 5 to 17
In terms of disability age 5 to 17, the demographic groups most similar to Uruguayans are Ukrainian (5.6%, a difference of 0.030%), Costa Rican (5.6%, a difference of 0.050%), Shoshone (5.6%, a difference of 0.080%), Immigrants from Central America (5.6%, a difference of 0.080%), and Serbian (5.6%, a difference of 0.15%).
| Demographics | Rating | Rank | Disability Age 5 to 17 |
| Greeks | 60.6 /100 | #166 | Good 5.6% |
| Immigrants from Burma/Myanmar | 59.3 /100 | #167 | Average 5.6% |
| Iraqis | 56.0 /100 | #168 | Average 5.6% |
| Immigrants from Norway | 55.7 /100 | #169 | Average 5.6% |
| Serbians | 54.0 /100 | #170 | Average 5.6% |
| Immigrants from Iraq | 53.9 /100 | #171 | Average 5.6% |
| Ukrainians | 51.5 /100 | #172 | Average 5.6% |
| Uruguayans | 51.0 /100 | #173 | Average 5.6% |
| Costa Ricans | 50.0 /100 | #174 | Average 5.6% |
| Shoshone | 49.4 /100 | #175 | Average 5.6% |
| Immigrants from Central America | 49.4 /100 | #176 | Average 5.6% |
| Immigrants from Western Europe | 47.8 /100 | #177 | Average 5.6% |
| Immigrants from Trinidad and Tobago | 47.6 /100 | #178 | Average 5.6% |
| Immigrants from Barbados | 40.5 /100 | #179 | Average 5.6% |
| Immigrants from Uruguay | 37.7 /100 | #180 | Fair 5.6% |
Uruguayan Disability Age 5 to 17 Correlation Summary
| Measurement | Uruguayan Data | Disability Age 5 to 17 Data |
| Minimum | 0.040% | 3.4% |
| Maximum | 11.2% | 17.9% |
| Range | 11.2% | 14.5% |
| Mean | 3.0% | 7.4% |
| Median | 2.2% | 6.1% |
| Interquartile 25% (IQ1) | 1.0% | 5.5% |
| Interquartile 75% (IQ3) | 3.9% | 7.9% |
| Interquartile Range (IQR) | 2.8% | 2.5% |
| Standard Deviation (Sample) | 2.8% | 3.6% |
| Standard Deviation (Population) | 2.7% | 3.6% |
Correlation Details
| Uruguayan Percentile | Sample Size | Disability Age 5 to 17 |
[ 0.0% - 0.5% ] 0.040% | 126,004,750 | 5.5% |
[ 0.0% - 0.5% ] 0.25% | 11,700,916 | 5.4% |
[ 0.0% - 0.5% ] 0.42% | 2,688,357 | 5.9% |
[ 0.5% - 1.0% ] 0.61% | 1,667,137 | 6.0% |
[ 0.5% - 1.0% ] 0.79% | 825,428 | 5.5% |
[ 0.5% - 1.0% ] 0.94% | 514,988 | 3.6% |
[ 1.0% - 1.5% ] 1.13% | 220,013 | 6.1% |
[ 1.0% - 1.5% ] 1.28% | 245,807 | 6.0% |
[ 1.0% - 1.5% ] 1.48% | 237,582 | 6.9% |
[ 1.5% - 2.0% ] 1.68% | 124,627 | 7.8% |
[ 1.5% - 2.0% ] 1.85% | 70,523 | 3.4% |
[ 2.0% - 2.5% ] 2.03% | 30,349 | 6.6% |
[ 2.0% - 2.5% ] 2.23% | 69,004 | 4.0% |
[ 2.0% - 2.5% ] 2.50% | 9,969 | 5.6% |
[ 2.5% - 3.0% ] 2.69% | 1,747 | 10.9% |
[ 2.5% - 3.0% ] 2.83% | 1,659 | 8.0% |
[ 2.5% - 3.0% ] 3.00% | 1,067 | 7.0% |
[ 3.0% - 3.5% ] 3.36% | 506 | 6.9% |
[ 3.5% - 4.0% ] 3.61% | 887 | 9.9% |
[ 4.0% - 4.5% ] 4.11% | 7,857 | 7.8% |
[ 4.0% - 4.5% ] 4.46% | 830 | 4.9% |
[ 4.5% - 5.0% ] 4.79% | 313 | 17.9% |
[ 6.5% - 7.0% ] 6.63% | 4,553 | 3.7% |
[ 9.5% - 10.0% ] 9.89% | 3,114 | 15.0% |
[ 11.0% - 11.5% ] 11.20% | 250 | 14.3% |