Immigrants from Latvia Disability Age 5 to 17

COMPARE

Immigrants from Latvia
Race
Ancestry
AfghanAfricanAlaska NativeAlaskan AthabascanAlbanianAleutAlsatianAmericanApacheArabArapahoArgentineanArmenianAssyrian/Chaldean/SyriacAustralianAustrianBahamianBangladeshiBarbadianBasqueBelgianBelizeanBermudanBhutaneseBlackfeetBolivianBrazilianBritishBritish West IndianBulgarianBurmeseCajunCambodianCanadianCape VerdeanCarpatho RusynCelticCentral AmericanCentral American IndianCherokeeCheyenneChickasawChileanChineseChippewaChoctawColombianColvilleComancheCosta RicanCreeCreekCroatianCrowCubanCypriotCzechCzechoslovakianDanishDelawareDominicanDutchDutch West IndianEastern EuropeanEcuadorianEgyptianEnglishEstonianEthiopianEuropeanFijianFilipinoFinnishFrenchFrench American IndianFrench CanadianGermanGerman RussianGhanaianGreekGuamanian/ChamorroGuatemalanGuyaneseHaitianHmongHonduranHopiHoumaHungarianIcelanderIndian (Asian)IndonesianInupiatIranianIraqiIrishIroquoisIsraeliItalianJamaicanJapaneseJordanianKenyanKiowaKoreanLaotianLatvianLebaneseLiberianLithuanianLumbeeLuxembourgerMacedonianMalaysianMalteseMarshalleseMenomineeMexicanMexican American IndianMongolianMoroccanNative HawaiianNavajoNepaleseNew ZealanderNicaraguanNigerianNorthern EuropeanNorwegianOkinawanOsageOttawaPaiutePakistaniPalestinianPanamanianParaguayanPennsylvania GermanPeruvianPimaPolishPortuguesePotawatomiPuebloPuerto RicanPuget Sound SalishRomanianRussianSalvadoranSamoanScandinavianScotch-IrishScottishSeminoleSenegaleseSerbianShoshoneSierra LeoneanSiouxSlavicSlovakSloveneSomaliSouth AfricanSouth AmericanSouth American IndianSoviet UnionSpaniardSpanishSpanish AmericanSpanish American IndianSri LankanSubsaharan AfricanSudaneseSwedishSwissSyrianTaiwaneseThaiTlingit-HaidaTohono O'OdhamTonganTrinidadian and TobagonianTsimshianTurkishU.S. Virgin IslanderUgandanUkrainianUruguayanUteVenezuelanVietnameseWelshWest IndianYakamaYaquiYugoslavianYumanYup'ikZimbabwean
Immigration
NonimmigrantsImmigrantsAfghanistanAfricaAlbaniaArgentinaArmeniaAsiaAustraliaAustriaBahamasBangladeshBarbadosBelarusBelgiumBelizeBoliviaBosnia and HerzegovinaBrazilBulgariaBurma/MyanmarCabo VerdeCambodiaCameroonCanadaCaribbeanCentral AmericaChileChinaColombiaCongoCosta RicaCroatiaCubaCzechoslovakiaDenmarkDominicaDominican RepublicEastern AfricaEastern AsiaEastern EuropeEcuadorEgyptEl SalvadorEnglandEritreaEthiopiaEuropeFijiFranceGermanyGhanaGreeceGrenadaGuatemalaGuyanaHaitiHondurasHong KongHungaryIndiaIndonesiaIranIraqIrelandIsraelItalyJamaicaJapanJordanKazakhstanKenyaKoreaKuwaitLaosLatin AmericaLatviaLebanonLiberiaLithuaniaMalaysiaMexicoMicronesiaMiddle AfricaMoldovaMoroccoNepalNetherlandsNicaraguaNigeriaNorth AmericaNorth MacedoniaNorthern AfricaNorthern EuropeNorwayOceaniaPakistanPanamaPeruPhilippinesPolandPortugalRomaniaRussiaSaudi ArabiaScotlandSenegalSerbiaSierra LeoneSingaporeSomaliaSouth AfricaSouth AmericaSouth Central AsiaSouth Eastern AsiaSouthern EuropeSpainSri LankaSt. Vincent and the GrenadinesSudanSwedenSwitzerlandSyriaTaiwanThailandTrinidad and TobagoTurkeyUgandaUkraineUruguayUzbekistanVenezuelaVietnamWest IndiesWestern AfricaWestern AsiaWestern EuropeYemenZaireZimbabweAzores
Select to Compare
Race
Ancestry
AfghanAfricanAlaska NativeAlaskan AthabascanAlbanianAleutAlsatianAmericanApacheArabArapahoArgentineanArmenianAssyrian/Chaldean/SyriacAustralianAustrianBahamianBangladeshiBarbadianBasqueBelgianBelizeanBermudanBhutaneseBlackfeetBolivianBrazilianBritishBritish West IndianBulgarianBurmeseCajunCambodianCanadianCape VerdeanCarpatho RusynCelticCentral AmericanCentral American IndianCherokeeCheyenneChickasawChileanChineseChippewaChoctawColombianColvilleComancheCosta RicanCreeCreekCroatianCrowCubanCypriotCzechCzechoslovakianDanishDelawareDominicanDutchDutch West IndianEastern EuropeanEcuadorianEgyptianEnglishEstonianEthiopianEuropeanFijianFilipinoFinnishFrenchFrench American IndianFrench CanadianGermanGerman RussianGhanaianGreekGuamanian/ChamorroGuatemalanGuyaneseHaitianHmongHonduranHopiHoumaHungarianIcelanderIndian (Asian)IndonesianInupiatIranianIraqiIrishIroquoisIsraeliItalianJamaicanJapaneseJordanianKenyanKiowaKoreanLaotianLatvianLebaneseLiberianLithuanianLumbeeLuxembourgerMacedonianMalaysianMalteseMarshalleseMenomineeMexicanMexican American IndianMongolianMoroccanNative HawaiianNavajoNepaleseNew ZealanderNicaraguanNigerianNorthern EuropeanNorwegianOkinawanOsageOttawaPaiutePakistaniPalestinianPanamanianParaguayanPennsylvania GermanPeruvianPimaPolishPortuguesePotawatomiPuebloPuerto RicanPuget Sound SalishRomanianRussianSalvadoranSamoanScandinavianScotch-IrishScottishSeminoleSenegaleseSerbianShoshoneSierra LeoneanSiouxSlavicSlovakSloveneSomaliSouth AfricanSouth AmericanSouth American IndianSoviet UnionSpaniardSpanishSpanish AmericanSpanish American IndianSri LankanSubsaharan AfricanSudaneseSwedishSwissSyrianTaiwaneseThaiTlingit-HaidaTohono O'OdhamTonganTrinidadian and TobagonianTsimshianTurkishU.S. Virgin IslanderUgandanUkrainianUruguayanUteVenezuelanVietnameseWelshWest IndianYakamaYaquiYugoslavianYumanYup'ikZimbabwean
Immigration
NonimmigrantsImmigrantsAfghanistanAfricaAlbaniaArgentinaArmeniaAsiaAustraliaAustriaBahamasBangladeshBarbadosBelarusBelgiumBelizeBoliviaBosnia and HerzegovinaBrazilBulgariaBurma/MyanmarCabo VerdeCambodiaCameroonCanadaCaribbeanCentral AmericaChileChinaColombiaCongoCosta RicaCroatiaCubaCzechoslovakiaDenmarkDominicaDominican RepublicEastern AfricaEastern AsiaEastern EuropeEcuadorEgyptEl SalvadorEnglandEritreaEthiopiaEuropeFijiFranceGermanyGhanaGreeceGrenadaGuatemalaGuyanaHaitiHondurasHong KongHungaryIndiaIndonesiaIranIraqIrelandIsraelItalyJamaicaJapanJordanKazakhstanKenyaKoreaKuwaitLaosLatin AmericaLebanonLiberiaLithuaniaMalaysiaMexicoMicronesiaMiddle AfricaMoldovaMoroccoNepalNetherlandsNicaraguaNigeriaNorth AmericaNorth MacedoniaNorthern AfricaNorthern EuropeNorwayOceaniaPakistanPanamaPeruPhilippinesPolandPortugalRomaniaRussiaSaudi ArabiaScotlandSenegalSerbiaSierra LeoneSingaporeSomaliaSouth AfricaSouth AmericaSouth Central AsiaSouth Eastern AsiaSouthern EuropeSpainSri LankaSt. Vincent and the GrenadinesSudanSwedenSwitzerlandSyriaTaiwanThailandTrinidad and TobagoTurkeyUgandaUkraineUruguayUzbekistanVenezuelaVietnamWest IndiesWestern AfricaWestern AsiaWestern EuropeYemenZaireZimbabweAzores
Disability Age 5 to 17
Income
Poverty
Unemployment
Labor Participation
Family Structure
Vehicle Availability
Education Level
Disability

Immigrants from Latvia Disability Age 5 to 17
Exceptional

5.3%
DISABILITY | AGE 5 TO 17
97.9/ 100
METRIC RATING
112th/ 347
METRIC RANK

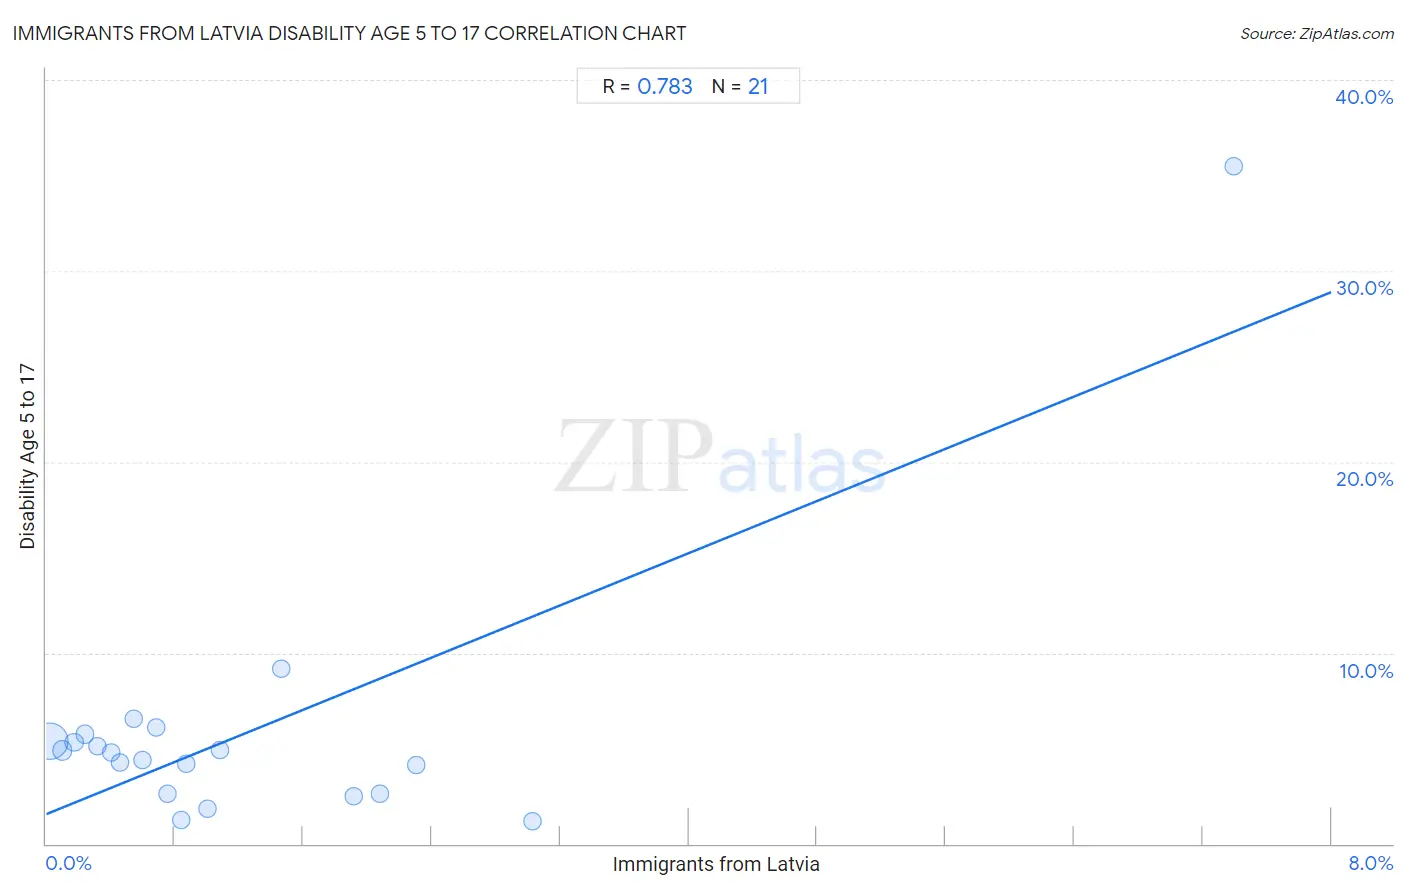
Immigrants from Latvia Disability Age 5 to 17 Correlation Chart

The statistical analysis conducted on geographies consisting of 113,351,045 people shows a strong positive correlation between the proportion of Immigrants from Latvia and percentage of population with a disability between the ages 5 and 17 in the United States with a correlation coefficient (R) of 0.783 and weighted average of 5.3%. On average, for every 1% (one percent) increase in Immigrants from Latvia within a typical geography, there is an increase of 3.4% in percentage of population with a disability between the ages 5 and 17.
Immigrants from Latvia Disability Age 5 to 17
It is essential to understand that the correlation between the percentage of Immigrants from Latvia and percentage of population with a disability between the ages 5 and 17 does not imply a direct cause-and-effect relationship. It remains uncertain whether the presence of Immigrants from Latvia influences an upward or downward trend in the level of percentage of population with a disability between the ages 5 and 17 within an area, or if Immigrants from Latvia simply ended up residing in those areas with higher or lower levels of percentage of population with a disability between the ages 5 and 17 due to other factors.

Demographics Similar to Immigrants from Latvia by Disability Age 5 to 17

In terms of disability age 5 to 17, the demographic groups most similar to Immigrants from Latvia are Ethiopian (5.3%, a difference of 0.020%), Aleut (5.3%, a difference of 0.040%), Immigrants from Eritrea (5.3%, a difference of 0.050%), Immigrants from Northern Europe (5.3%, a difference of 0.070%), and Cuban (5.3%, a difference of 0.080%).
DemographicsRating | RankDisability Age 5 to 17
Immigrants from Italy
98.4
/100
|
#105
Exceptional
5.3%
Immigrants from Yemen
98.2
/100
|
#106
Exceptional
5.3%
Russians
98.2
/100
|
#107
Exceptional
5.3%
Immigrants from South Africa
98.1
/100
|
#108
Exceptional
5.3%
Immigrants from Northern Africa
98.1
/100
|
#109
Exceptional
5.3%
Immigrants from Eritrea
98.0
/100
|
#110
Exceptional
5.3%
Ethiopians
97.9
/100
|
#111
Exceptional
5.3%
Immigrants from Latvia
97.9
/100
|
#112
Exceptional
5.3%
Aleuts
97.8
/100
|
#113
Exceptional
5.3%
Immigrants from Northern Europe
97.8
/100
|
#114
Exceptional
5.3%
Cubans
97.8
/100
|
#115
Exceptional
5.3%
Cypriots
97.7
/100
|
#116
Exceptional
5.3%
Immigrants from Afghanistan
97.4
/100
|
#117
Exceptional
5.3%
South Americans
97.1
/100
|
#118
Exceptional
5.4%
Immigrants from South America
97.1
/100
|
#119
Exceptional
5.4%

Immigrants from Latvia Disability Age 5 to 17 Correlation Summary

MeasurementImmigrants from Latvia DataDisability Age 5 to 17 Data
Minimum0.020%1.2%
Maximum7.4%35.5%
Range7.4%34.4%
Mean1.3%5.8%
Median0.76%4.8%
Interquartile 25% (IQ1)0.36%2.6%
Interquartile 75% (IQ3)1.7%5.6%
Interquartile Range (IQR)1.3%2.9%
Standard Deviation (Sample)1.6%7.1%
Standard Deviation (Population)1.6%6.9%

Correlation Details

Immigrants from Latvia PercentileSample SizeDisability Age 5 to 17
[
0.0%
-
0.5%
]
0.020%
99,942,3725.4%
[
0.0%
-
0.5%
]
0.100%
8,757,2204.9%
[
0.0%
-
0.5%
]
0.17%
2,214,9765.3%
[
0.0%
-
0.5%
]
0.24%
1,116,1955.7%
[
0.0%
-
0.5%
]
0.32%
579,4635.1%
[
0.0%
-
0.5%
]
0.40%
325,3254.8%
[
0.0%
-
0.5%
]
0.46%
137,2394.2%
[
0.5%
-
1.0%
]
0.54%
68,1926.5%
[
0.5%
-
1.0%
]
0.60%
26,7404.4%
[
0.5%
-
1.0%
]
0.68%
58,2276.1%
[
0.5%
-
1.0%
]
0.76%
8,7212.6%
[
0.5%
-
1.0%
]
0.84%
9,4201.2%
[
0.5%
-
1.0%
]
0.87%
69,1974.2%
[
1.0%
-
1.5%
]
1.01%
4,1691.9%
[
1.0%
-
1.5%
]
1.08%
8304.9%
[
1.0%
-
1.5%
]
1.46%
12,7899.2%
[
1.5%
-
2.0%
]
1.91%
7,8972.5%
[
2.0%
-
2.5%
]
2.08%
7712.6%
[
2.0%
-
2.5%
]
2.30%
5644.1%
[
3.0%
-
3.5%
]
3.03%
8,4251.2%
[
7.0%
-
7.5%
]
7.39%
2,31335.5%