Danish Disability Age 5 to 17

COMPARE

Danish
Race
Ancestry
AfghanAfricanAlaska NativeAlaskan AthabascanAlbanianAleutAlsatianAmericanApacheArabArapahoArgentineanArmenianAssyrian/Chaldean/SyriacAustralianAustrianBahamianBangladeshiBarbadianBasqueBelgianBelizeanBermudanBhutaneseBlackfeetBolivianBrazilianBritishBritish West IndianBulgarianBurmeseCajunCambodianCanadianCape VerdeanCarpatho RusynCelticCentral AmericanCentral American IndianCherokeeCheyenneChickasawChileanChineseChippewaChoctawColombianColvilleComancheCosta RicanCreeCreekCroatianCrowCubanCypriotCzechCzechoslovakianDanishDelawareDominicanDutchDutch West IndianEastern EuropeanEcuadorianEgyptianEnglishEstonianEthiopianEuropeanFijianFilipinoFinnishFrenchFrench American IndianFrench CanadianGermanGerman RussianGhanaianGreekGuamanian/ChamorroGuatemalanGuyaneseHaitianHmongHonduranHopiHoumaHungarianIcelanderIndian (Asian)IndonesianInupiatIranianIraqiIrishIroquoisIsraeliItalianJamaicanJapaneseJordanianKenyanKiowaKoreanLaotianLatvianLebaneseLiberianLithuanianLumbeeLuxembourgerMacedonianMalaysianMalteseMarshalleseMenomineeMexicanMexican American IndianMongolianMoroccanNative HawaiianNavajoNepaleseNew ZealanderNicaraguanNigerianNorthern EuropeanNorwegianOkinawanOsageOttawaPaiutePakistaniPalestinianPanamanianParaguayanPennsylvania GermanPeruvianPimaPolishPortuguesePotawatomiPuebloPuerto RicanPuget Sound SalishRomanianRussianSalvadoranSamoanScandinavianScotch-IrishScottishSeminoleSenegaleseSerbianShoshoneSierra LeoneanSiouxSlavicSlovakSloveneSomaliSouth AfricanSouth AmericanSouth American IndianSoviet UnionSpaniardSpanishSpanish AmericanSpanish American IndianSri LankanSubsaharan AfricanSudaneseSwedishSwissSyrianTaiwaneseThaiTlingit-HaidaTohono O'OdhamTonganTrinidadian and TobagonianTsimshianTurkishU.S. Virgin IslanderUgandanUkrainianUruguayanUteVenezuelanVietnameseWelshWest IndianYakamaYaquiYugoslavianYumanYup'ikZimbabwean
Immigration
NonimmigrantsImmigrantsAfghanistanAfricaAlbaniaArgentinaArmeniaAsiaAustraliaAustriaBahamasBangladeshBarbadosBelarusBelgiumBelizeBoliviaBosnia and HerzegovinaBrazilBulgariaBurma/MyanmarCabo VerdeCambodiaCameroonCanadaCaribbeanCentral AmericaChileChinaColombiaCongoCosta RicaCroatiaCubaCzechoslovakiaDenmarkDominicaDominican RepublicEastern AfricaEastern AsiaEastern EuropeEcuadorEgyptEl SalvadorEnglandEritreaEthiopiaEuropeFijiFranceGermanyGhanaGreeceGrenadaGuatemalaGuyanaHaitiHondurasHong KongHungaryIndiaIndonesiaIranIraqIrelandIsraelItalyJamaicaJapanJordanKazakhstanKenyaKoreaKuwaitLaosLatin AmericaLatviaLebanonLiberiaLithuaniaMalaysiaMexicoMicronesiaMiddle AfricaMoldovaMoroccoNepalNetherlandsNicaraguaNigeriaNorth AmericaNorth MacedoniaNorthern AfricaNorthern EuropeNorwayOceaniaPakistanPanamaPeruPhilippinesPolandPortugalRomaniaRussiaSaudi ArabiaScotlandSenegalSerbiaSierra LeoneSingaporeSomaliaSouth AfricaSouth AmericaSouth Central AsiaSouth Eastern AsiaSouthern EuropeSpainSri LankaSt. Vincent and the GrenadinesSudanSwedenSwitzerlandSyriaTaiwanThailandTrinidad and TobagoTurkeyUgandaUkraineUruguayUzbekistanVenezuelaVietnamWest IndiesWestern AfricaWestern AsiaWestern EuropeYemenZaireZimbabweAzores
Select to Compare
Race
Ancestry
AfghanAfricanAlaska NativeAlaskan AthabascanAlbanianAleutAlsatianAmericanApacheArabArapahoArgentineanArmenianAssyrian/Chaldean/SyriacAustralianAustrianBahamianBangladeshiBarbadianBasqueBelgianBelizeanBermudanBhutaneseBlackfeetBolivianBrazilianBritishBritish West IndianBulgarianBurmeseCajunCambodianCanadianCape VerdeanCarpatho RusynCelticCentral AmericanCentral American IndianCherokeeCheyenneChickasawChileanChineseChippewaChoctawColombianColvilleComancheCosta RicanCreeCreekCroatianCrowCubanCypriotCzechCzechoslovakianDelawareDominicanDutchDutch West IndianEastern EuropeanEcuadorianEgyptianEnglishEstonianEthiopianEuropeanFijianFilipinoFinnishFrenchFrench American IndianFrench CanadianGermanGerman RussianGhanaianGreekGuamanian/ChamorroGuatemalanGuyaneseHaitianHmongHonduranHopiHoumaHungarianIcelanderIndian (Asian)IndonesianInupiatIranianIraqiIrishIroquoisIsraeliItalianJamaicanJapaneseJordanianKenyanKiowaKoreanLaotianLatvianLebaneseLiberianLithuanianLumbeeLuxembourgerMacedonianMalaysianMalteseMarshalleseMenomineeMexicanMexican American IndianMongolianMoroccanNative HawaiianNavajoNepaleseNew ZealanderNicaraguanNigerianNorthern EuropeanNorwegianOkinawanOsageOttawaPaiutePakistaniPalestinianPanamanianParaguayanPennsylvania GermanPeruvianPimaPolishPortuguesePotawatomiPuebloPuerto RicanPuget Sound SalishRomanianRussianSalvadoranSamoanScandinavianScotch-IrishScottishSeminoleSenegaleseSerbianShoshoneSierra LeoneanSiouxSlavicSlovakSloveneSomaliSouth AfricanSouth AmericanSouth American IndianSoviet UnionSpaniardSpanishSpanish AmericanSpanish American IndianSri LankanSubsaharan AfricanSudaneseSwedishSwissSyrianTaiwaneseThaiTlingit-HaidaTohono O'OdhamTonganTrinidadian and TobagonianTsimshianTurkishU.S. Virgin IslanderUgandanUkrainianUruguayanUteVenezuelanVietnameseWelshWest IndianYakamaYaquiYugoslavianYumanYup'ikZimbabwean
Immigration
NonimmigrantsImmigrantsAfghanistanAfricaAlbaniaArgentinaArmeniaAsiaAustraliaAustriaBahamasBangladeshBarbadosBelarusBelgiumBelizeBoliviaBosnia and HerzegovinaBrazilBulgariaBurma/MyanmarCabo VerdeCambodiaCameroonCanadaCaribbeanCentral AmericaChileChinaColombiaCongoCosta RicaCroatiaCubaCzechoslovakiaDenmarkDominicaDominican RepublicEastern AfricaEastern AsiaEastern EuropeEcuadorEgyptEl SalvadorEnglandEritreaEthiopiaEuropeFijiFranceGermanyGhanaGreeceGrenadaGuatemalaGuyanaHaitiHondurasHong KongHungaryIndiaIndonesiaIranIraqIrelandIsraelItalyJamaicaJapanJordanKazakhstanKenyaKoreaKuwaitLaosLatin AmericaLatviaLebanonLiberiaLithuaniaMalaysiaMexicoMicronesiaMiddle AfricaMoldovaMoroccoNepalNetherlandsNicaraguaNigeriaNorth AmericaNorth MacedoniaNorthern AfricaNorthern EuropeNorwayOceaniaPakistanPanamaPeruPhilippinesPolandPortugalRomaniaRussiaSaudi ArabiaScotlandSenegalSerbiaSierra LeoneSingaporeSomaliaSouth AfricaSouth AmericaSouth Central AsiaSouth Eastern AsiaSouthern EuropeSpainSri LankaSt. Vincent and the GrenadinesSudanSwedenSwitzerlandSyriaTaiwanThailandTrinidad and TobagoTurkeyUgandaUkraineUruguayUzbekistanVenezuelaVietnamWest IndiesWestern AfricaWestern AsiaWestern EuropeYemenZaireZimbabweAzores
Disability Age 5 to 17
Income
Poverty
Unemployment
Labor Participation
Family Structure
Vehicle Availability
Education Level
Disability

Danish Disability Age 5 to 17
Fair

5.7%
DISABILITY | AGE 5 TO 17
26.5/ 100
METRIC RATING
191st/ 347
METRIC RANK

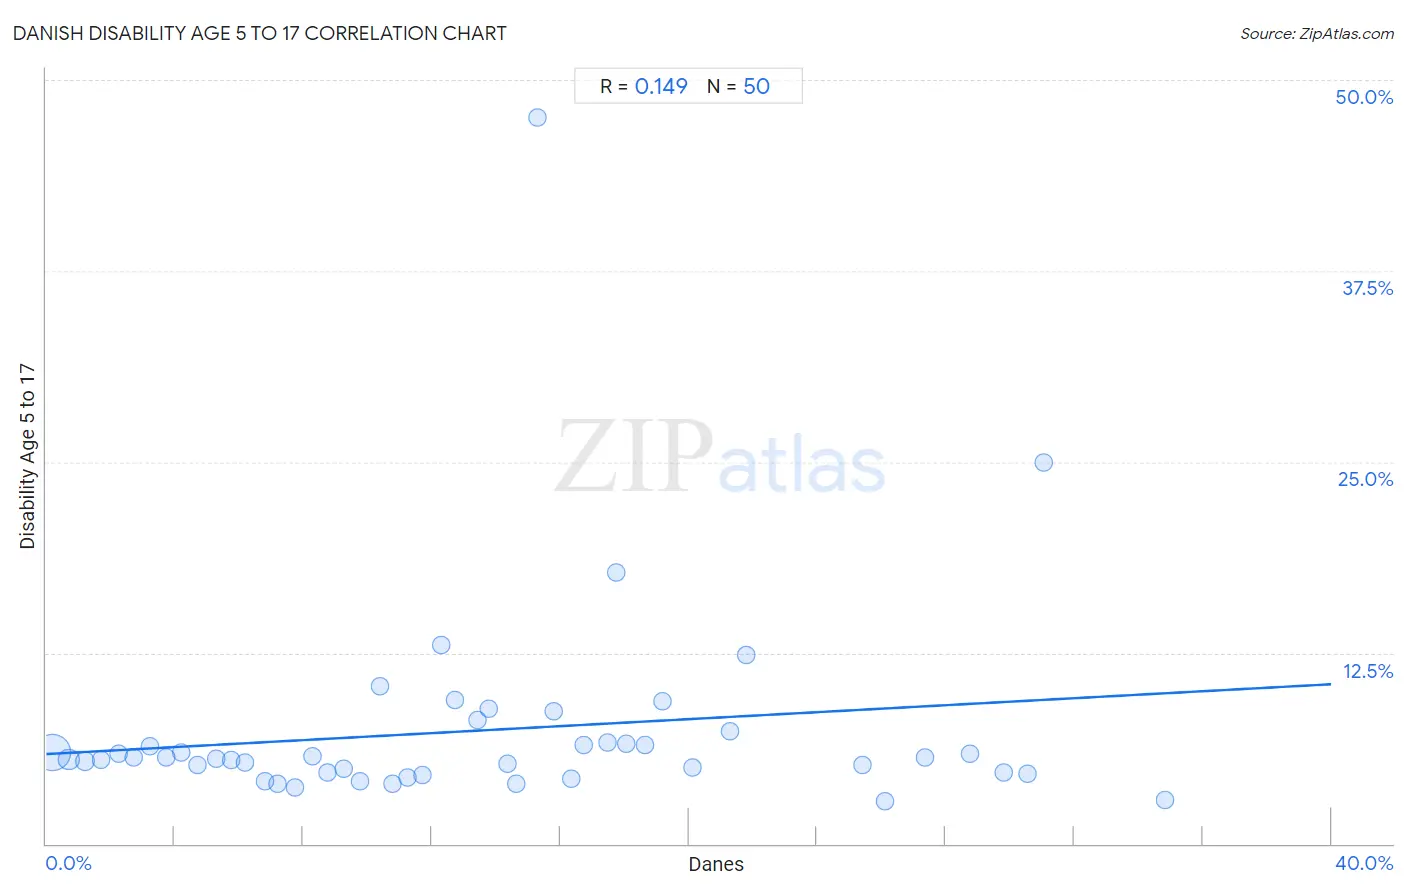
Danish Disability Age 5 to 17 Correlation Chart

The statistical analysis conducted on geographies consisting of 467,230,380 people shows a poor positive correlation between the proportion of Danes and percentage of population with a disability between the ages 5 and 17 in the United States with a correlation coefficient (R) of 0.149 and weighted average of 5.7%. On average, for every 1% (one percent) increase in Danes within a typical geography, there is an increase of 0.11% in percentage of population with a disability between the ages 5 and 17.
Danish Disability Age 5 to 17
It is essential to understand that the correlation between the percentage of Danes and percentage of population with a disability between the ages 5 and 17 does not imply a direct cause-and-effect relationship. It remains uncertain whether the presence of Danes influences an upward or downward trend in the level of percentage of population with a disability between the ages 5 and 17 within an area, or if Danes simply ended up residing in those areas with higher or lower levels of percentage of population with a disability between the ages 5 and 17 due to other factors.

Demographics Similar to Danes by Disability Age 5 to 17

In terms of disability age 5 to 17, the demographic groups most similar to Danes are Immigrants from Bosnia and Herzegovina (5.7%, a difference of 0.010%), Immigrants from Canada (5.7%, a difference of 0.030%), Immigrants from Eastern Africa (5.7%, a difference of 0.050%), Pueblo (5.7%, a difference of 0.060%), and Marshallese (5.7%, a difference of 0.10%).
DemographicsRating | RankDisability Age 5 to 17
Syrians
33.8
/100
|
#184
Fair
5.6%
Immigrants from Mexico
33.7
/100
|
#185
Fair
5.6%
Fijians
31.7
/100
|
#186
Fair
5.7%
Immigrants from Thailand
30.2
/100
|
#187
Fair
5.7%
Marshallese
28.1
/100
|
#188
Fair
5.7%
Pueblo
27.5
/100
|
#189
Fair
5.7%
Immigrants from Eastern Africa
27.3
/100
|
#190
Fair
5.7%
Danes
26.5
/100
|
#191
Fair
5.7%
Immigrants from Bosnia and Herzegovina
26.3
/100
|
#192
Fair
5.7%
Immigrants from Canada
26.1
/100
|
#193
Fair
5.7%
Croatians
23.6
/100
|
#194
Fair
5.7%
Immigrants from Nigeria
23.4
/100
|
#195
Fair
5.7%
Inupiat
23.3
/100
|
#196
Fair
5.7%
Immigrants from North America
23.1
/100
|
#197
Fair
5.7%
Norwegians
20.9
/100
|
#198
Fair
5.7%

Danish Disability Age 5 to 17 Correlation Summary

MeasurementDanish DataDisability Age 5 to 17 Data
Minimum0.19%2.8%
Maximum34.8%47.6%
Range34.6%44.8%
Mean13.5%7.4%
Median12.5%5.6%
Interquartile 25% (IQ1)6.2%4.7%
Interquartile 75% (IQ3)18.6%6.6%
Interquartile Range (IQR)12.4%1.9%
Standard Deviation (Sample)9.0%6.9%
Standard Deviation (Population)8.9%6.9%

Correlation Details

Danish PercentileSample SizeDisability Age 5 to 17
[
0.0%
-
0.5%
]
0.19%
354,138,8946.0%
[
0.5%
-
1.0%
]
0.71%
68,487,4325.5%
[
1.0%
-
1.5%
]
1.20%
23,776,0375.4%
[
1.5%
-
2.0%
]
1.71%
8,663,6515.5%
[
2.0%
-
2.5%
]
2.24%
3,028,0895.9%
[
2.5%
-
3.0%
]
2.74%
1,849,6085.6%
[
3.0%
-
3.5%
]
3.22%
1,415,3336.4%
[
3.5%
-
4.0%
]
3.75%
1,593,8285.7%
[
4.0%
-
4.5%
]
4.21%
1,095,2645.9%
[
4.5%
-
5.0%
]
4.72%
908,5065.1%
[
5.0%
-
5.5%
]
5.28%
744,1955.6%
[
5.5%
-
6.0%
]
5.78%
451,8265.4%
[
6.0%
-
6.5%
]
6.18%
242,9065.3%
[
6.5%
-
7.0%
]
6.81%
172,6924.1%
[
7.0%
-
7.5%
]
7.22%
122,5644.0%
[
7.5%
-
8.0%
]
7.73%
184,9803.7%
[
8.0%
-
8.5%
]
8.28%
97,9515.7%
[
8.5%
-
9.0%
]
8.77%
53,8974.7%
[
9.0%
-
9.5%
]
9.27%
19,3324.9%
[
9.5%
-
10.0%
]
9.76%
30,2054.1%
[
10.0%
-
10.5%
]
10.41%
13,80710.3%
[
10.5%
-
11.0%
]
10.78%
23,7773.9%
[
11.0%
-
11.5%
]
11.23%
21,0644.4%
[
11.5%
-
12.0%
]
11.70%
6,1944.5%
[
12.0%
-
12.5%
]
12.30%
2,09813.0%
[
12.5%
-
13.0%
]
12.73%
13,6659.4%
[
13.0%
-
13.5%
]
13.41%
12,7118.1%
[
13.5%
-
14.0%
]
13.78%
8,2468.8%
[
14.0%
-
14.5%
]
14.36%
9,9785.2%
[
14.5%
-
15.0%
]
14.62%
2,0793.9%
[
15.0%
-
15.5%
]
15.30%
80447.6%
[
15.5%
-
16.0%
]
15.80%
7668.7%
[
16.0%
-
16.5%
]
16.35%
5264.3%
[
16.5%
-
17.0%
]
16.73%
4,8906.4%
[
17.0%
-
17.5%
]
17.47%
7,1426.6%
[
17.5%
-
18.0%
]
17.73%
2,96117.8%
[
18.0%
-
18.5%
]
18.05%
7706.6%
[
18.5%
-
19.0%
]
18.62%
1,6436.4%
[
19.0%
-
19.5%
]
19.17%
3,1889.3%
[
20.0%
-
20.5%
]
20.11%
2,9895.0%
[
21.0%
-
21.5%
]
21.28%
3907.4%
[
21.5%
-
22.0%
]
21.79%
4,49712.3%
[
25.0%
-
25.5%
]
25.41%
3,1995.1%
[
26.0%
-
26.5%
]
26.11%
1,4632.8%
[
27.0%
-
27.5%
]
27.36%
7935.6%
[
28.5%
-
29.0%
]
28.77%
6575.9%
[
29.5%
-
30.0%
]
29.80%
1,4904.7%
[
30.5%
-
31.0%
]
30.53%
4164.6%
[
31.0%
-
31.5%
]
31.03%
20325.0%
[
34.5%
-
35.0%
]
34.82%
7842.8%