Nonimmigrants Disability Age 5 to 17
COMPARE
Nonimmigrants
Select to Compare
Disability Age 5 to 17
Nonimmigrants Disability Age 5 to 17
6.3%
DISABILITY | AGE 5 TO 17
0.0/ 100
METRIC RATING
306th/ 347
METRIC RANK
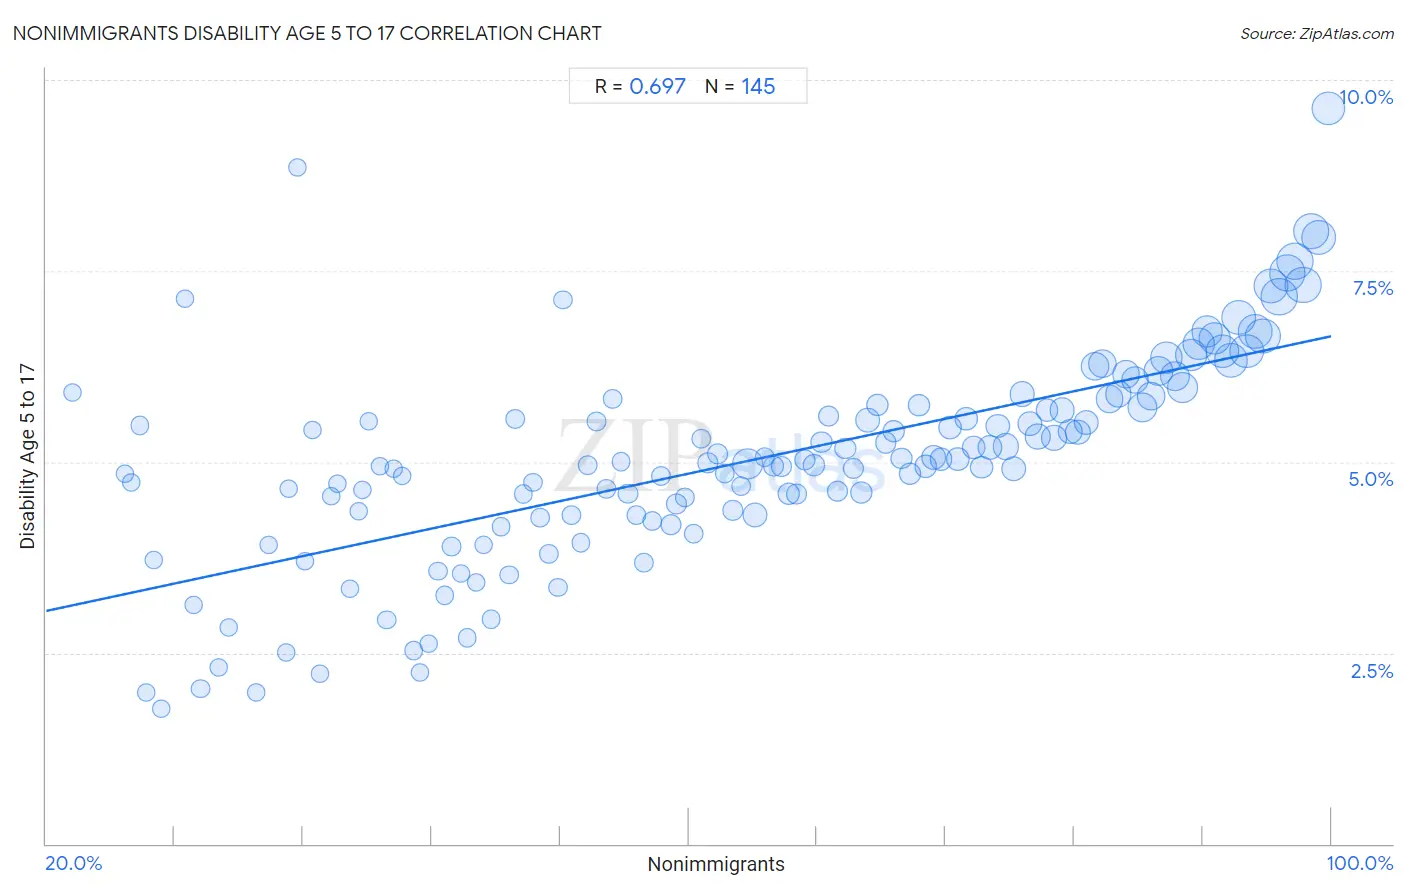
Nonimmigrants Disability Age 5 to 17 Correlation Chart
The statistical analysis conducted on geographies consisting of 567,642,967 people shows a significant positive correlation between the proportion of Nonimmigrants and percentage of population with a disability between the ages 5 and 17 in the United States with a correlation coefficient (R) of 0.697 and weighted average of 6.3%. On average, for every 1% (one percent) increase in Nonimmigrants within a typical geography, there is an increase of 0.045% in percentage of population with a disability between the ages 5 and 17.
It is essential to understand that the correlation between the percentage of Nonimmigrants and percentage of population with a disability between the ages 5 and 17 does not imply a direct cause-and-effect relationship. It remains uncertain whether the presence of Nonimmigrants influences an upward or downward trend in the level of percentage of population with a disability between the ages 5 and 17 within an area, or if Nonimmigrants simply ended up residing in those areas with higher or lower levels of percentage of population with a disability between the ages 5 and 17 due to other factors.
Demographics Similar to Nonimmigrants by Disability Age 5 to 17
In terms of disability age 5 to 17, the demographic groups most similar to Nonimmigrants are Native/Alaskan (6.3%, a difference of 0.10%), Bahamian (6.3%, a difference of 0.14%), Senegalese (6.3%, a difference of 0.24%), Yakama (6.3%, a difference of 0.32%), and Scotch-Irish (6.3%, a difference of 0.37%).
| Demographics | Rating | Rank | Disability Age 5 to 17 |
| Welsh | 0.0 /100 | #299 | Tragic 6.3% |
| Carpatho Rusyns | 0.0 /100 | #300 | Tragic 6.3% |
| U.S. Virgin Islanders | 0.0 /100 | #301 | Tragic 6.3% |
| Celtics | 0.0 /100 | #302 | Tragic 6.3% |
| Yakama | 0.0 /100 | #303 | Tragic 6.3% |
| Senegalese | 0.0 /100 | #304 | Tragic 6.3% |
| Natives/Alaskans | 0.0 /100 | #305 | Tragic 6.3% |
| Nonimmigrants | 0.0 /100 | #306 | Tragic 6.3% |
| Bahamians | 0.0 /100 | #307 | Tragic 6.3% |
| Scotch-Irish | 0.0 /100 | #308 | Tragic 6.3% |
| Hmong | 0.0 /100 | #309 | Tragic 6.3% |
| Alaskan Athabascans | 0.0 /100 | #310 | Tragic 6.3% |
| Immigrants from Dominica | 0.0 /100 | #311 | Tragic 6.3% |
| Bermudans | 0.0 /100 | #312 | Tragic 6.4% |
| Apache | 0.0 /100 | #313 | Tragic 6.4% |
Nonimmigrants Disability Age 5 to 17 Correlation Summary
| Measurement | Nonimmigrants Data | Disability Age 5 to 17 Data |
| Minimum | 21.6% | 1.8% |
| Maximum | 99.8% | 9.6% |
| Range | 78.2% | 7.9% |
| Mean | 63.5% | 5.0% |
| Median | 63.7% | 5.0% |
| Interquartile 25% (IQ1) | 45.5% | 4.3% |
| Interquartile 75% (IQ3) | 82.0% | 5.7% |
| Interquartile Range (IQR) | 36.5% | 1.4% |
| Standard Deviation (Sample) | 21.5% | 1.4% |
| Standard Deviation (Population) | 21.4% | 1.4% |
Correlation Details
| Nonimmigrants Percentile | Sample Size | Disability Age 5 to 17 |
[ 21.5% - 22.0% ] 21.63% | 42,081 | 5.9% |
[ 24.5% - 25.0% ] 24.90% | 71,088 | 4.8% |
[ 25.0% - 25.5% ] 25.32% | 46,798 | 4.7% |
[ 25.5% - 26.0% ] 25.85% | 257,738 | 5.5% |
[ 26.0% - 26.5% ] 26.25% | 19,399 | 2.0% |
[ 26.5% - 27.0% ] 26.69% | 29,830 | 3.7% |
[ 27.0% - 27.5% ] 27.15% | 57,066 | 1.8% |
[ 28.5% - 29.0% ] 28.63% | 45,620 | 7.1% |
[ 29.0% - 29.5% ] 29.21% | 137,895 | 3.1% |
[ 29.5% - 30.0% ] 29.61% | 115,169 | 2.0% |
[ 30.5% - 31.0% ] 30.74% | 90,791 | 2.3% |
[ 31.0% - 31.5% ] 31.32% | 119,624 | 2.8% |
[ 33.0% - 33.5% ] 33.09% | 109,218 | 2.0% |
[ 33.5% - 34.0% ] 33.83% | 152,851 | 3.9% |
[ 34.5% - 35.0% ] 34.93% | 48,096 | 2.5% |
[ 35.0% - 35.5% ] 35.12% | 104,741 | 4.6% |
[ 35.5% - 36.0% ] 35.67% | 109,357 | 8.9% |
[ 36.0% - 36.5% ] 36.09% | 115,987 | 3.7% |
[ 36.5% - 37.0% ] 36.57% | 24,597 | 5.4% |
[ 37.0% - 37.5% ] 37.06% | 2,318 | 2.2% |
[ 37.5% - 38.0% ] 37.72% | 93,794 | 4.5% |
[ 38.0% - 38.5% ] 38.12% | 128,561 | 4.7% |
[ 38.5% - 39.0% ] 38.91% | 50,975 | 3.3% |
[ 39.0% - 39.5% ] 39.47% | 35,967 | 4.4% |
[ 39.5% - 40.0% ] 39.70% | 153,212 | 4.6% |
[ 40.0% - 40.5% ] 40.07% | 14,371 | 5.5% |
[ 40.5% - 41.0% ] 40.81% | 86,760 | 4.9% |
[ 41.0% - 41.5% ] 41.20% | 221,458 | 2.9% |
[ 41.5% - 42.0% ] 41.66% | 93,758 | 4.9% |
[ 42.0% - 42.5% ] 42.16% | 597,049 | 4.8% |
[ 42.5% - 43.0% ] 42.87% | 110,375 | 2.5% |
[ 43.0% - 43.5% ] 43.29% | 75,557 | 2.2% |
[ 43.5% - 44.0% ] 43.83% | 89,843 | 2.6% |
[ 44.0% - 44.5% ] 44.39% | 146,820 | 3.6% |
[ 44.5% - 45.0% ] 44.82% | 482,104 | 3.3% |
[ 45.0% - 45.5% ] 45.22% | 593,586 | 3.9% |
[ 45.5% - 46.0% ] 45.83% | 368,970 | 3.5% |
[ 46.0% - 46.5% ] 46.19% | 463,452 | 2.7% |
[ 46.5% - 47.0% ] 46.77% | 133,339 | 3.4% |
[ 47.0% - 47.5% ] 47.23% | 231,990 | 3.9% |
[ 47.5% - 48.0% ] 47.68% | 204,028 | 2.9% |
[ 48.0% - 48.5% ] 48.33% | 302,301 | 4.2% |
[ 48.5% - 49.0% ] 48.83% | 285,135 | 3.5% |
[ 49.0% - 49.5% ] 49.21% | 728,892 | 5.6% |
[ 49.5% - 50.0% ] 49.71% | 637,516 | 4.6% |
[ 50.0% - 50.5% ] 50.31% | 161,880 | 4.7% |
[ 50.5% - 51.0% ] 50.72% | 845,905 | 4.3% |
[ 51.0% - 51.5% ] 51.26% | 834,508 | 3.8% |
[ 51.5% - 52.0% ] 51.86% | 166,857 | 3.4% |
[ 52.0% - 52.5% ] 52.17% | 274,396 | 7.1% |
[ 52.5% - 53.0% ] 52.70% | 838,509 | 4.3% |
[ 53.0% - 53.5% ] 53.28% | 675,376 | 3.9% |
[ 53.5% - 54.0% ] 53.69% | 764,646 | 5.0% |
[ 54.0% - 54.5% ] 54.25% | 677,013 | 5.5% |
[ 54.5% - 55.0% ] 54.86% | 860,395 | 4.6% |
[ 55.0% - 55.5% ] 55.28% | 846,624 | 5.8% |
[ 55.5% - 56.0% ] 55.80% | 367,717 | 5.0% |
[ 56.0% - 56.5% ] 56.22% | 1,255,230 | 4.6% |
[ 56.5% - 57.0% ] 56.74% | 883,685 | 4.3% |
[ 57.0% - 57.5% ] 57.22% | 796,609 | 3.7% |
[ 57.5% - 58.0% ] 57.72% | 1,493,759 | 4.2% |
[ 58.0% - 58.5% ] 58.27% | 1,522,826 | 4.8% |
[ 58.5% - 59.0% ] 58.89% | 2,626,411 | 4.2% |
[ 59.0% - 59.5% ] 59.24% | 1,731,268 | 4.4% |
[ 59.5% - 60.0% ] 59.75% | 1,226,325 | 4.5% |
[ 60.0% - 60.5% ] 60.32% | 1,172,739 | 4.1% |
[ 60.5% - 61.0% ] 60.77% | 1,115,119 | 5.3% |
[ 61.0% - 61.5% ] 61.19% | 1,571,839 | 5.0% |
[ 61.5% - 62.0% ] 61.77% | 1,922,735 | 5.1% |
[ 62.0% - 62.5% ] 62.24% | 1,514,757 | 4.8% |
[ 62.5% - 63.0% ] 62.74% | 1,582,882 | 4.4% |
[ 63.0% - 63.5% ] 63.23% | 1,273,393 | 4.7% |
[ 63.5% - 64.0% ] 63.68% | 10,439,674 | 5.0% |
[ 64.0% - 64.5% ] 64.09% | 5,364,888 | 4.3% |
[ 64.5% - 65.0% ] 64.73% | 1,576,363 | 5.1% |
[ 65.0% - 65.5% ] 65.26% | 2,377,790 | 4.9% |
[ 65.5% - 66.0% ] 65.77% | 1,739,051 | 4.9% |
[ 66.0% - 66.5% ] 66.26% | 3,236,727 | 4.6% |
[ 66.5% - 67.0% ] 66.72% | 1,714,620 | 4.6% |
[ 67.0% - 67.5% ] 67.25% | 2,356,648 | 5.0% |
[ 67.5% - 68.0% ] 67.79% | 2,870,716 | 5.0% |
[ 68.0% - 68.5% ] 68.24% | 2,820,587 | 5.3% |
[ 68.5% - 69.0% ] 68.69% | 2,370,017 | 5.6% |
[ 69.0% - 69.5% ] 69.26% | 2,226,621 | 4.6% |
[ 69.5% - 70.0% ] 69.73% | 2,655,015 | 5.2% |
[ 70.0% - 70.5% ] 70.24% | 2,763,518 | 4.9% |
[ 70.5% - 71.0% ] 70.73% | 3,102,708 | 4.6% |
[ 71.0% - 71.5% ] 71.14% | 5,073,379 | 5.5% |
[ 71.5% - 72.0% ] 71.76% | 3,326,570 | 5.7% |
[ 72.0% - 72.5% ] 72.27% | 2,957,288 | 5.2% |
[ 72.5% - 73.0% ] 72.73% | 3,294,373 | 5.4% |
[ 73.0% - 73.5% ] 73.24% | 2,744,055 | 5.0% |
[ 73.5% - 74.0% ] 73.76% | 3,188,990 | 4.8% |
[ 74.0% - 74.5% ] 74.31% | 2,820,913 | 5.7% |
[ 74.5% - 75.0% ] 74.75% | 4,134,943 | 4.9% |
[ 75.0% - 75.5% ] 75.25% | 5,484,796 | 5.1% |
[ 75.5% - 76.0% ] 75.72% | 3,535,123 | 5.0% |
[ 76.0% - 76.5% ] 76.24% | 4,134,960 | 5.4% |
[ 76.5% - 77.0% ] 76.76% | 3,727,811 | 5.0% |
[ 77.0% - 77.5% ] 77.27% | 4,272,271 | 5.6% |
[ 77.5% - 78.0% ] 77.77% | 4,368,960 | 5.2% |
[ 78.0% - 78.5% ] 78.23% | 3,687,359 | 4.9% |
[ 78.5% - 79.0% ] 78.77% | 5,498,506 | 5.2% |
[ 79.0% - 79.5% ] 79.23% | 4,775,269 | 5.5% |
[ 79.5% - 80.0% ] 79.73% | 7,048,341 | 5.2% |
[ 80.0% - 80.5% ] 80.27% | 5,353,120 | 4.9% |
[ 80.5% - 81.0% ] 80.74% | 5,880,630 | 5.9% |
[ 81.0% - 81.5% ] 81.22% | 5,547,067 | 5.5% |
[ 81.5% - 82.0% ] 81.75% | 5,915,158 | 5.3% |
[ 82.0% - 82.5% ] 82.30% | 4,065,902 | 5.7% |
[ 82.5% - 83.0% ] 82.75% | 5,875,689 | 5.3% |
[ 83.0% - 83.5% ] 83.26% | 5,997,792 | 5.7% |
[ 83.5% - 84.0% ] 83.77% | 4,934,871 | 5.4% |
[ 84.0% - 84.5% ] 84.23% | 5,834,299 | 5.4% |
[ 84.5% - 85.0% ] 84.76% | 5,306,900 | 5.5% |
[ 85.0% - 85.5% ] 85.27% | 8,432,569 | 6.3% |
[ 85.5% - 86.0% ] 85.76% | 8,694,881 | 6.3% |
[ 86.0% - 86.5% ] 86.20% | 8,155,552 | 5.8% |
[ 86.5% - 87.0% ] 86.75% | 7,048,677 | 5.9% |
[ 87.0% - 87.5% ] 87.25% | 7,786,362 | 6.1% |
[ 87.5% - 88.0% ] 87.78% | 7,526,470 | 6.1% |
[ 88.0% - 88.5% ] 88.24% | 9,725,675 | 5.7% |
[ 88.5% - 89.0% ] 88.76% | 8,734,067 | 5.9% |
[ 89.0% - 89.5% ] 89.26% | 10,070,690 | 6.2% |
[ 89.5% - 90.0% ] 89.74% | 11,439,564 | 6.4% |
[ 90.0% - 90.5% ] 90.24% | 9,674,612 | 6.1% |
[ 90.5% - 91.0% ] 90.75% | 10,585,646 | 6.0% |
[ 91.0% - 91.5% ] 91.26% | 11,810,249 | 6.4% |
[ 91.5% - 92.0% ] 91.77% | 11,699,871 | 6.5% |
[ 92.0% - 92.5% ] 92.26% | 11,377,283 | 6.7% |
[ 92.5% - 93.0% ] 92.76% | 12,327,988 | 6.6% |
[ 93.0% - 93.5% ] 93.25% | 12,854,482 | 6.5% |
[ 93.5% - 94.0% ] 93.75% | 13,363,746 | 6.3% |
[ 94.0% - 94.5% ] 94.25% | 13,969,410 | 6.9% |
[ 94.5% - 95.0% ] 94.74% | 13,070,485 | 6.4% |
[ 95.0% - 95.5% ] 95.25% | 13,548,322 | 6.7% |
[ 95.5% - 96.0% ] 95.75% | 14,209,981 | 6.6% |
[ 96.0% - 96.5% ] 96.25% | 14,352,199 | 7.3% |
[ 96.5% - 97.0% ] 96.76% | 15,177,241 | 7.2% |
[ 97.0% - 97.5% ] 97.26% | 15,249,055 | 7.5% |
[ 97.5% - 98.0% ] 97.76% | 15,991,717 | 7.6% |
[ 98.0% - 98.5% ] 98.25% | 14,948,707 | 7.3% |
[ 98.5% - 99.0% ] 98.75% | 15,019,629 | 8.0% |
[ 99.0% - 99.5% ] 99.24% | 13,929,373 | 7.9% |
[ 99.5% - 100.0% ] 99.81% | 13,434,706 | 9.6% |