Zip Codes with the Highest Percentage of Population Employed in Agriculture, Fishing & Hunting in Yakima, WA
RELATED REPORTS & OPTIONS
Agriculture, Fishing & Hunting
Yakima
Compare Zip Codes
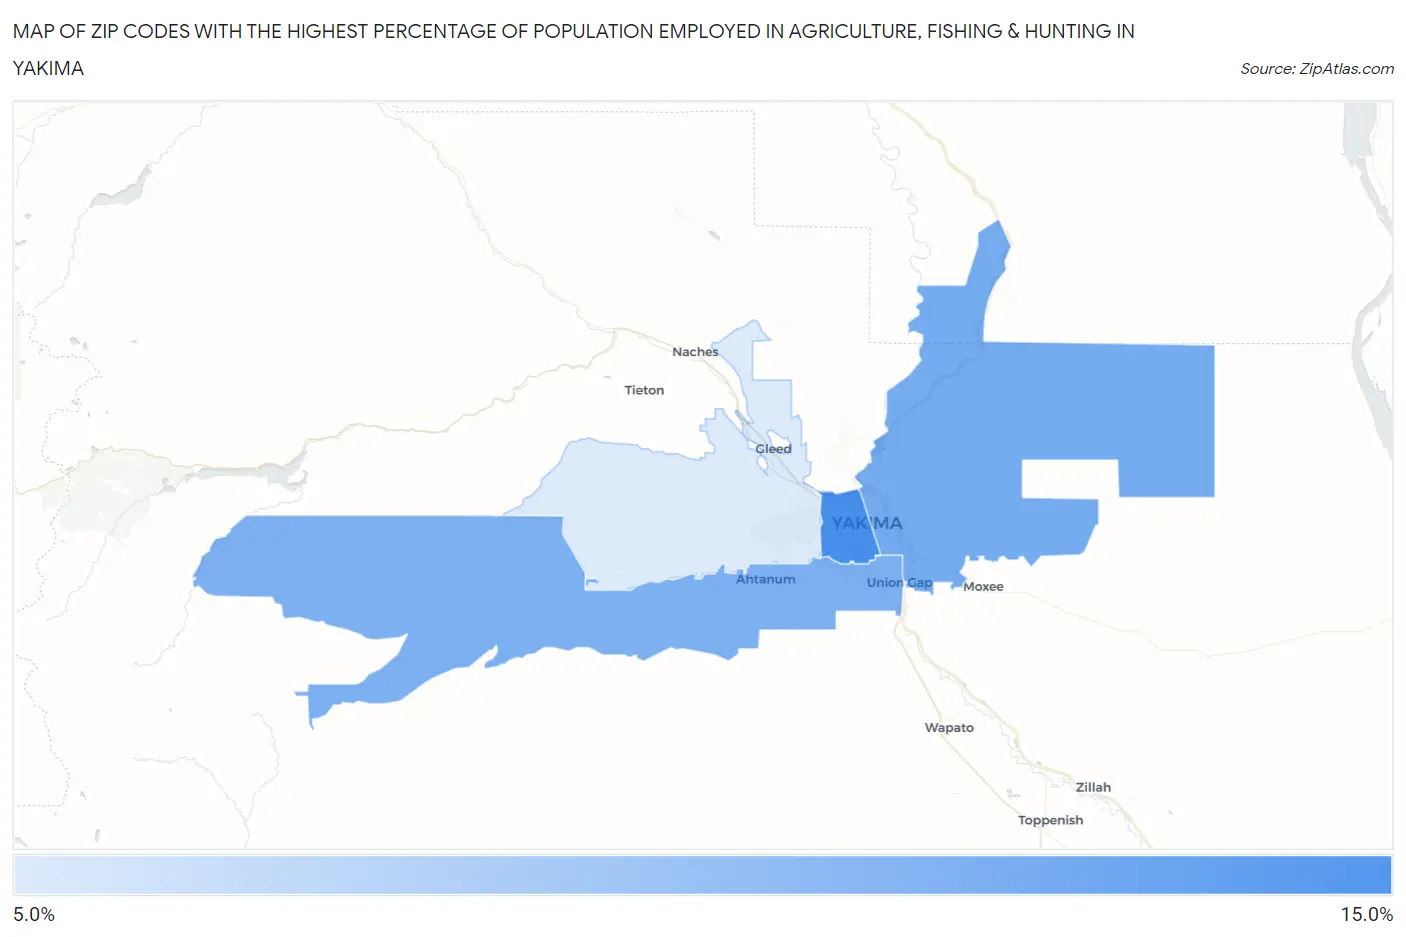
Map of Zip Codes with the Highest Percentage of Population Employed in Agriculture, Fishing & Hunting in Yakima
5.6%
13.4%
Zip Codes with the Highest Percentage of Population Employed in Agriculture, Fishing & Hunting in Yakima, WA
| Zip Code | % Employed | vs State | vs National | |
| 1. | 98902 | 13.4% | 2.4%(+11.0)#108 | 1.2%(+12.2)#3,066 |
| 2. | 98901 | 10.8% | 2.4%(+8.46)#131 | 1.2%(+9.65)#3,937 |
| 3. | 98903 | 10.6% | 2.4%(+8.21)#136 | 1.2%(+9.40)#4,049 |
| 4. | 98908 | 5.6% | 2.4%(+3.20)#197 | 1.2%(+4.39)#7,290 |
1
Common Questions
What are the Top 3 Zip Codes with the Highest Percentage of Population Employed in Agriculture, Fishing & Hunting in Yakima, WA?
Top 3 Zip Codes with the Highest Percentage of Population Employed in Agriculture, Fishing & Hunting in Yakima, WA are:
What zip code has the Highest Percentage of Population Employed in Agriculture, Fishing & Hunting in Yakima, WA?
98902 has the Highest Percentage of Population Employed in Agriculture, Fishing & Hunting in Yakima, WA with 13.4%.
What is the Percentage of Population Employed in Agriculture, Fishing & Hunting in Yakima, WA?
Percentage of Population Employed in Agriculture, Fishing & Hunting in Yakima is 11.0%.
What is the Percentage of Population Employed in Agriculture, Fishing & Hunting in Washington?
Percentage of Population Employed in Agriculture, Fishing & Hunting in Washington is 2.4%.
What is the Percentage of Population Employed in Agriculture, Fishing & Hunting in the United States?
Percentage of Population Employed in Agriculture, Fishing & Hunting in the United States is 1.2%.