U.S. Virgin Islander vs Immigrants from Lebanon 3 or more Vehicles in Household
COMPARE
U.S. Virgin Islander
Immigrants from Lebanon
3 or more Vehicles in Household
3 or more Vehicles in Household Comparison
U.S. Virgin Islanders
Immigrants from Lebanon
15.4%
3 OR MORE VEHICLES IN HOUSEHOLD
0.0/ 100
METRIC RATING
316th/ 347
METRIC RANK
19.8%
3 OR MORE VEHICLES IN HOUSEHOLD
67.6/ 100
METRIC RATING
160th/ 347
METRIC RANK
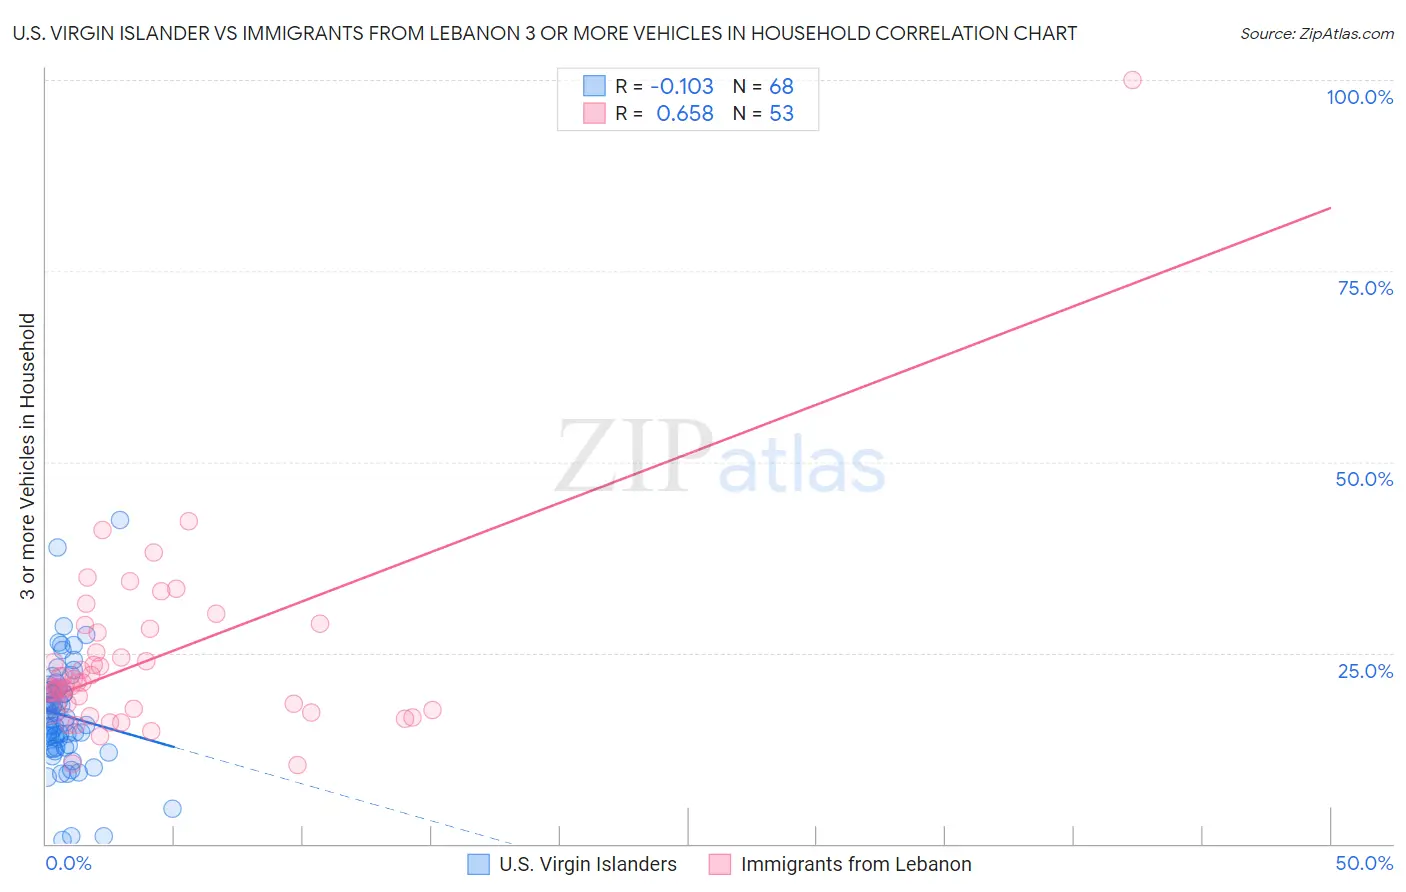
U.S. Virgin Islander vs Immigrants from Lebanon 3 or more Vehicles in Household Correlation Chart
The statistical analysis conducted on geographies consisting of 87,505,701 people shows a poor negative correlation between the proportion of U.S. Virgin Islanders and percentage of households with 3 or more vehicles available in the United States with a correlation coefficient (R) of -0.103 and weighted average of 15.4%. Similarly, the statistical analysis conducted on geographies consisting of 217,088,415 people shows a significant positive correlation between the proportion of Immigrants from Lebanon and percentage of households with 3 or more vehicles available in the United States with a correlation coefficient (R) of 0.658 and weighted average of 19.8%, a difference of 28.4%.
3 or more Vehicles in Household Correlation Summary
| Measurement | U.S. Virgin Islander | Immigrants from Lebanon |
| Minimum | 0.49% | 10.3% |
| Maximum | 42.4% | 100.0% |
| Range | 41.9% | 89.7% |
| Mean | 16.8% | 24.1% |
| Median | 16.2% | 21.1% |
| Interquartile 25% (IQ1) | 12.6% | 17.5% |
| Interquartile 75% (IQ3) | 20.2% | 27.9% |
| Interquartile Range (IQR) | 7.6% | 10.4% |
| Standard Deviation (Sample) | 7.3% | 12.8% |
| Standard Deviation (Population) | 7.2% | 12.7% |
Similar Demographics by 3 or more Vehicles in Household
Demographics Similar to U.S. Virgin Islanders by 3 or more Vehicles in Household
In terms of 3 or more vehicles in household, the demographic groups most similar to U.S. Virgin Islanders are Haitian (15.5%, a difference of 0.52%), Immigrants from Belarus (15.5%, a difference of 0.84%), Jamaican (15.2%, a difference of 1.2%), Immigrants from Haiti (15.2%, a difference of 1.4%), and Immigrants from Israel (15.6%, a difference of 1.5%).
| Demographics | Rating | Rank | 3 or more Vehicles in Household |
| Immigrants | Somalia | 0.0 /100 | #309 | Tragic 15.9% |
| Moroccans | 0.0 /100 | #310 | Tragic 15.9% |
| Albanians | 0.0 /100 | #311 | Tragic 15.8% |
| Puerto Ricans | 0.0 /100 | #312 | Tragic 15.6% |
| Immigrants | Israel | 0.0 /100 | #313 | Tragic 15.6% |
| Immigrants | Belarus | 0.0 /100 | #314 | Tragic 15.5% |
| Haitians | 0.0 /100 | #315 | Tragic 15.5% |
| U.S. Virgin Islanders | 0.0 /100 | #316 | Tragic 15.4% |
| Jamaicans | 0.0 /100 | #317 | Tragic 15.2% |
| Immigrants | Haiti | 0.0 /100 | #318 | Tragic 15.2% |
| Cape Verdeans | 0.0 /100 | #319 | Tragic 15.0% |
| Yup'ik | 0.0 /100 | #320 | Tragic 14.8% |
| Immigrants | Jamaica | 0.0 /100 | #321 | Tragic 14.7% |
| Immigrants | West Indies | 0.0 /100 | #322 | Tragic 14.6% |
| Immigrants | Caribbean | 0.0 /100 | #323 | Tragic 14.6% |
Demographics Similar to Immigrants from Lebanon by 3 or more Vehicles in Household
In terms of 3 or more vehicles in household, the demographic groups most similar to Immigrants from Lebanon are Immigrants from Pakistan (19.8%, a difference of 0.050%), Armenian (19.8%, a difference of 0.11%), Immigrants from Guatemala (19.7%, a difference of 0.16%), Hungarian (19.8%, a difference of 0.26%), and Thai (19.8%, a difference of 0.31%).
| Demographics | Rating | Rank | 3 or more Vehicles in Household |
| Yuman | 75.6 /100 | #153 | Good 19.9% |
| Immigrants | Jordan | 75.0 /100 | #154 | Good 19.9% |
| Tlingit-Haida | 73.4 /100 | #155 | Good 19.9% |
| Thais | 71.1 /100 | #156 | Good 19.8% |
| Hungarians | 70.5 /100 | #157 | Good 19.8% |
| Armenians | 68.8 /100 | #158 | Good 19.8% |
| Immigrants | Pakistan | 68.2 /100 | #159 | Good 19.8% |
| Immigrants | Lebanon | 67.6 /100 | #160 | Good 19.8% |
| Immigrants | Guatemala | 65.6 /100 | #161 | Good 19.7% |
| Estonians | 63.2 /100 | #162 | Good 19.7% |
| Chileans | 63.0 /100 | #163 | Good 19.7% |
| Yugoslavians | 62.9 /100 | #164 | Good 19.7% |
| Immigrants | Costa Rica | 61.9 /100 | #165 | Good 19.7% |
| Immigrants | Cameroon | 60.9 /100 | #166 | Good 19.7% |
| Ukrainians | 58.9 /100 | #167 | Average 19.6% |