U.S. Virgin Islander vs Chickasaw 3 or more Vehicles in Household
COMPARE
U.S. Virgin Islander
Chickasaw
3 or more Vehicles in Household
3 or more Vehicles in Household Comparison
U.S. Virgin Islanders
Chickasaw
15.4%
3 OR MORE VEHICLES IN HOUSEHOLD
0.0/ 100
METRIC RATING
316th/ 347
METRIC RANK
22.2%
3 OR MORE VEHICLES IN HOUSEHOLD
99.9/ 100
METRIC RATING
63rd/ 347
METRIC RANK
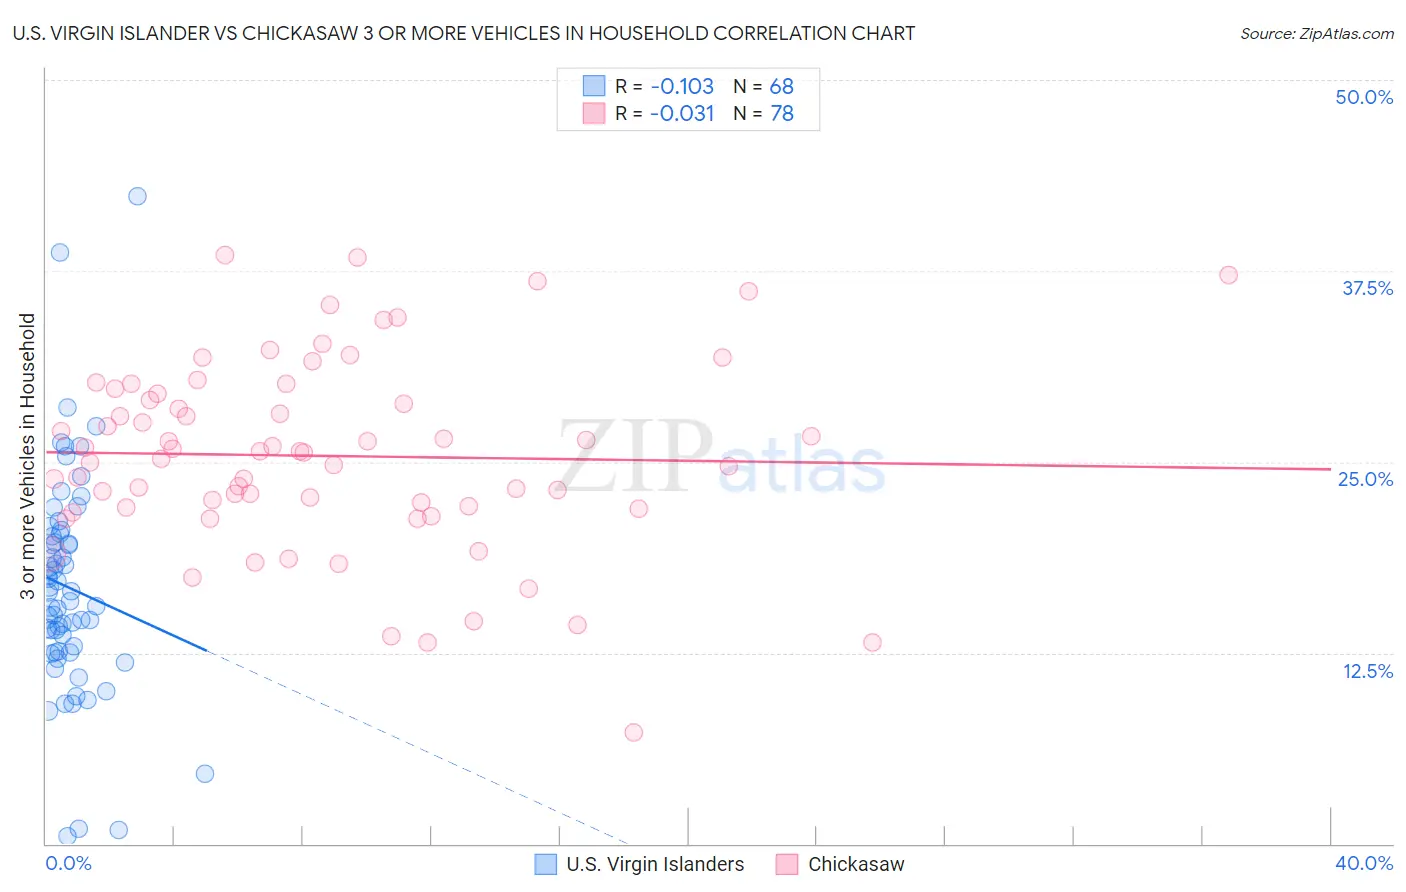
U.S. Virgin Islander vs Chickasaw 3 or more Vehicles in Household Correlation Chart
The statistical analysis conducted on geographies consisting of 87,505,701 people shows a poor negative correlation between the proportion of U.S. Virgin Islanders and percentage of households with 3 or more vehicles available in the United States with a correlation coefficient (R) of -0.103 and weighted average of 15.4%. Similarly, the statistical analysis conducted on geographies consisting of 147,670,529 people shows no correlation between the proportion of Chickasaw and percentage of households with 3 or more vehicles available in the United States with a correlation coefficient (R) of -0.031 and weighted average of 22.2%, a difference of 44.2%.
3 or more Vehicles in Household Correlation Summary
| Measurement | U.S. Virgin Islander | Chickasaw |
| Minimum | 0.49% | 7.3% |
| Maximum | 42.4% | 38.5% |
| Range | 41.9% | 31.2% |
| Mean | 16.8% | 25.4% |
| Median | 16.2% | 25.6% |
| Interquartile 25% (IQ1) | 12.6% | 22.0% |
| Interquartile 75% (IQ3) | 20.2% | 29.5% |
| Interquartile Range (IQR) | 7.6% | 7.5% |
| Standard Deviation (Sample) | 7.3% | 6.2% |
| Standard Deviation (Population) | 7.2% | 6.2% |
Similar Demographics by 3 or more Vehicles in Household
Demographics Similar to U.S. Virgin Islanders by 3 or more Vehicles in Household
In terms of 3 or more vehicles in household, the demographic groups most similar to U.S. Virgin Islanders are Haitian (15.5%, a difference of 0.52%), Immigrants from Belarus (15.5%, a difference of 0.84%), Jamaican (15.2%, a difference of 1.2%), Immigrants from Haiti (15.2%, a difference of 1.4%), and Immigrants from Israel (15.6%, a difference of 1.5%).
| Demographics | Rating | Rank | 3 or more Vehicles in Household |
| Immigrants | Somalia | 0.0 /100 | #309 | Tragic 15.9% |
| Moroccans | 0.0 /100 | #310 | Tragic 15.9% |
| Albanians | 0.0 /100 | #311 | Tragic 15.8% |
| Puerto Ricans | 0.0 /100 | #312 | Tragic 15.6% |
| Immigrants | Israel | 0.0 /100 | #313 | Tragic 15.6% |
| Immigrants | Belarus | 0.0 /100 | #314 | Tragic 15.5% |
| Haitians | 0.0 /100 | #315 | Tragic 15.5% |
| U.S. Virgin Islanders | 0.0 /100 | #316 | Tragic 15.4% |
| Jamaicans | 0.0 /100 | #317 | Tragic 15.2% |
| Immigrants | Haiti | 0.0 /100 | #318 | Tragic 15.2% |
| Cape Verdeans | 0.0 /100 | #319 | Tragic 15.0% |
| Yup'ik | 0.0 /100 | #320 | Tragic 14.8% |
| Immigrants | Jamaica | 0.0 /100 | #321 | Tragic 14.7% |
| Immigrants | West Indies | 0.0 /100 | #322 | Tragic 14.6% |
| Immigrants | Caribbean | 0.0 /100 | #323 | Tragic 14.6% |
Demographics Similar to Chickasaw by 3 or more Vehicles in Household
In terms of 3 or more vehicles in household, the demographic groups most similar to Chickasaw are Fijian (22.2%, a difference of 0.16%), Bhutanese (22.2%, a difference of 0.20%), Immigrants from Taiwan (22.1%, a difference of 0.33%), Finnish (22.3%, a difference of 0.36%), and Navajo (22.3%, a difference of 0.45%).
| Demographics | Rating | Rank | 3 or more Vehicles in Household |
| Hispanics or Latinos | 100.0 /100 | #56 | Exceptional 22.4% |
| Pennsylvania Germans | 100.0 /100 | #57 | Exceptional 22.3% |
| Spaniards | 100.0 /100 | #58 | Exceptional 22.3% |
| Navajo | 100.0 /100 | #59 | Exceptional 22.3% |
| Finns | 99.9 /100 | #60 | Exceptional 22.3% |
| Bhutanese | 99.9 /100 | #61 | Exceptional 22.2% |
| Fijians | 99.9 /100 | #62 | Exceptional 22.2% |
| Chickasaw | 99.9 /100 | #63 | Exceptional 22.2% |
| Immigrants | Taiwan | 99.9 /100 | #64 | Exceptional 22.1% |
| Pima | 99.9 /100 | #65 | Exceptional 22.0% |
| Northern Europeans | 99.9 /100 | #66 | Exceptional 22.0% |
| Alaskan Athabascans | 99.9 /100 | #67 | Exceptional 21.9% |
| British | 99.9 /100 | #68 | Exceptional 21.9% |
| Creek | 99.9 /100 | #69 | Exceptional 21.9% |
| Bangladeshis | 99.8 /100 | #70 | Exceptional 21.9% |