U.S. Virgin Islander vs Immigrants from Italy 3 or more Vehicles in Household
COMPARE
U.S. Virgin Islander
Immigrants from Italy
3 or more Vehicles in Household
3 or more Vehicles in Household Comparison
U.S. Virgin Islanders
Immigrants from Italy
15.4%
3 OR MORE VEHICLES IN HOUSEHOLD
0.0/ 100
METRIC RATING
316th/ 347
METRIC RANK
18.7%
3 OR MORE VEHICLES IN HOUSEHOLD
10.2/ 100
METRIC RATING
217th/ 347
METRIC RANK
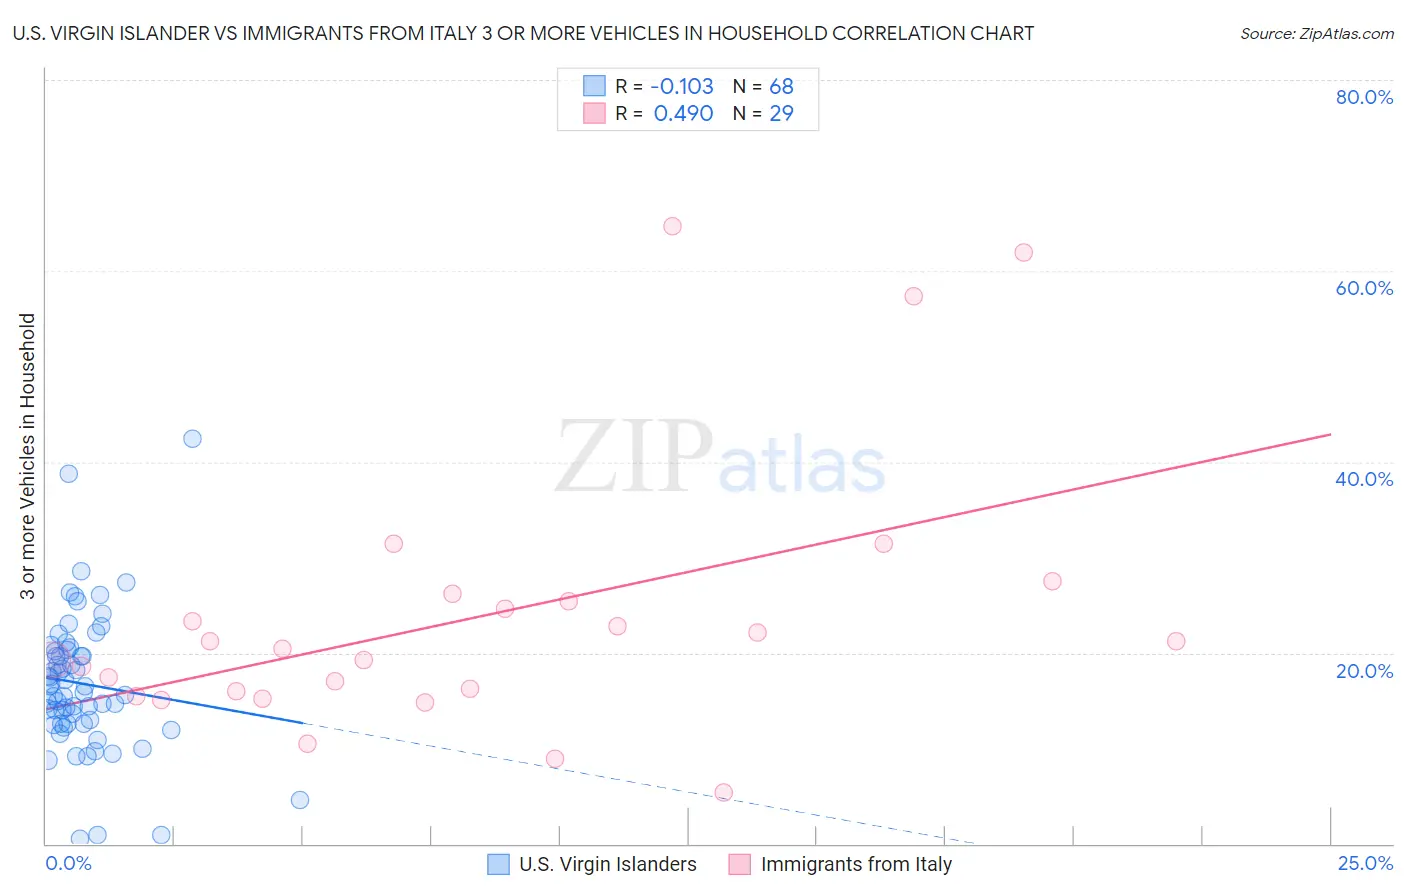
U.S. Virgin Islander vs Immigrants from Italy 3 or more Vehicles in Household Correlation Chart
The statistical analysis conducted on geographies consisting of 87,505,701 people shows a poor negative correlation between the proportion of U.S. Virgin Islanders and percentage of households with 3 or more vehicles available in the United States with a correlation coefficient (R) of -0.103 and weighted average of 15.4%. Similarly, the statistical analysis conducted on geographies consisting of 324,064,061 people shows a moderate positive correlation between the proportion of Immigrants from Italy and percentage of households with 3 or more vehicles available in the United States with a correlation coefficient (R) of 0.490 and weighted average of 18.7%, a difference of 21.5%.
3 or more Vehicles in Household Correlation Summary
| Measurement | U.S. Virgin Islander | Immigrants from Italy |
| Minimum | 0.49% | 5.4% |
| Maximum | 42.4% | 64.7% |
| Range | 41.9% | 59.3% |
| Mean | 16.8% | 23.8% |
| Median | 16.2% | 20.4% |
| Interquartile 25% (IQ1) | 12.6% | 15.7% |
| Interquartile 75% (IQ3) | 20.2% | 25.7% |
| Interquartile Range (IQR) | 7.6% | 10.0% |
| Standard Deviation (Sample) | 7.3% | 14.3% |
| Standard Deviation (Population) | 7.2% | 14.1% |
Similar Demographics by 3 or more Vehicles in Household
Demographics Similar to U.S. Virgin Islanders by 3 or more Vehicles in Household
In terms of 3 or more vehicles in household, the demographic groups most similar to U.S. Virgin Islanders are Haitian (15.5%, a difference of 0.52%), Immigrants from Belarus (15.5%, a difference of 0.84%), Jamaican (15.2%, a difference of 1.2%), Immigrants from Haiti (15.2%, a difference of 1.4%), and Immigrants from Israel (15.6%, a difference of 1.5%).
| Demographics | Rating | Rank | 3 or more Vehicles in Household |
| Immigrants | Somalia | 0.0 /100 | #309 | Tragic 15.9% |
| Moroccans | 0.0 /100 | #310 | Tragic 15.9% |
| Albanians | 0.0 /100 | #311 | Tragic 15.8% |
| Puerto Ricans | 0.0 /100 | #312 | Tragic 15.6% |
| Immigrants | Israel | 0.0 /100 | #313 | Tragic 15.6% |
| Immigrants | Belarus | 0.0 /100 | #314 | Tragic 15.5% |
| Haitians | 0.0 /100 | #315 | Tragic 15.5% |
| U.S. Virgin Islanders | 0.0 /100 | #316 | Tragic 15.4% |
| Jamaicans | 0.0 /100 | #317 | Tragic 15.2% |
| Immigrants | Haiti | 0.0 /100 | #318 | Tragic 15.2% |
| Cape Verdeans | 0.0 /100 | #319 | Tragic 15.0% |
| Yup'ik | 0.0 /100 | #320 | Tragic 14.8% |
| Immigrants | Jamaica | 0.0 /100 | #321 | Tragic 14.7% |
| Immigrants | West Indies | 0.0 /100 | #322 | Tragic 14.6% |
| Immigrants | Caribbean | 0.0 /100 | #323 | Tragic 14.6% |
Demographics Similar to Immigrants from Italy by 3 or more Vehicles in Household
In terms of 3 or more vehicles in household, the demographic groups most similar to Immigrants from Italy are Immigrants from Nigeria (18.7%, a difference of 0.020%), Eastern European (18.7%, a difference of 0.080%), Immigrants from Sierra Leone (18.7%, a difference of 0.13%), Panamanian (18.8%, a difference of 0.28%), and Immigrants from Cuba (18.8%, a difference of 0.28%).
| Demographics | Rating | Rank | 3 or more Vehicles in Household |
| Bulgarians | 13.1 /100 | #210 | Poor 18.8% |
| Immigrants | Kenya | 12.4 /100 | #211 | Poor 18.8% |
| Panamanians | 11.6 /100 | #212 | Poor 18.8% |
| Immigrants | Cuba | 11.6 /100 | #213 | Poor 18.8% |
| Immigrants | Sierra Leone | 10.8 /100 | #214 | Poor 18.7% |
| Eastern Europeans | 10.6 /100 | #215 | Poor 18.7% |
| Immigrants | Nigeria | 10.3 /100 | #216 | Poor 18.7% |
| Immigrants | Italy | 10.2 /100 | #217 | Poor 18.7% |
| Immigrants | Portugal | 8.9 /100 | #218 | Tragic 18.6% |
| Immigrants | Armenia | 8.6 /100 | #219 | Tragic 18.6% |
| Nigerians | 7.9 /100 | #220 | Tragic 18.6% |
| Immigrants | Poland | 7.5 /100 | #221 | Tragic 18.6% |
| Belizeans | 7.3 /100 | #222 | Tragic 18.6% |
| Immigrants | Czechoslovakia | 5.9 /100 | #223 | Tragic 18.5% |
| Immigrants | Argentina | 5.6 /100 | #224 | Tragic 18.5% |