U.S. Virgin Islander vs Filipino 3 or more Vehicles in Household
COMPARE
U.S. Virgin Islander
Filipino
3 or more Vehicles in Household
3 or more Vehicles in Household Comparison
U.S. Virgin Islanders
Filipinos
15.4%
3 OR MORE VEHICLES IN HOUSEHOLD
0.0/ 100
METRIC RATING
316th/ 347
METRIC RANK
20.8%
3 OR MORE VEHICLES IN HOUSEHOLD
97.0/ 100
METRIC RATING
109th/ 347
METRIC RANK
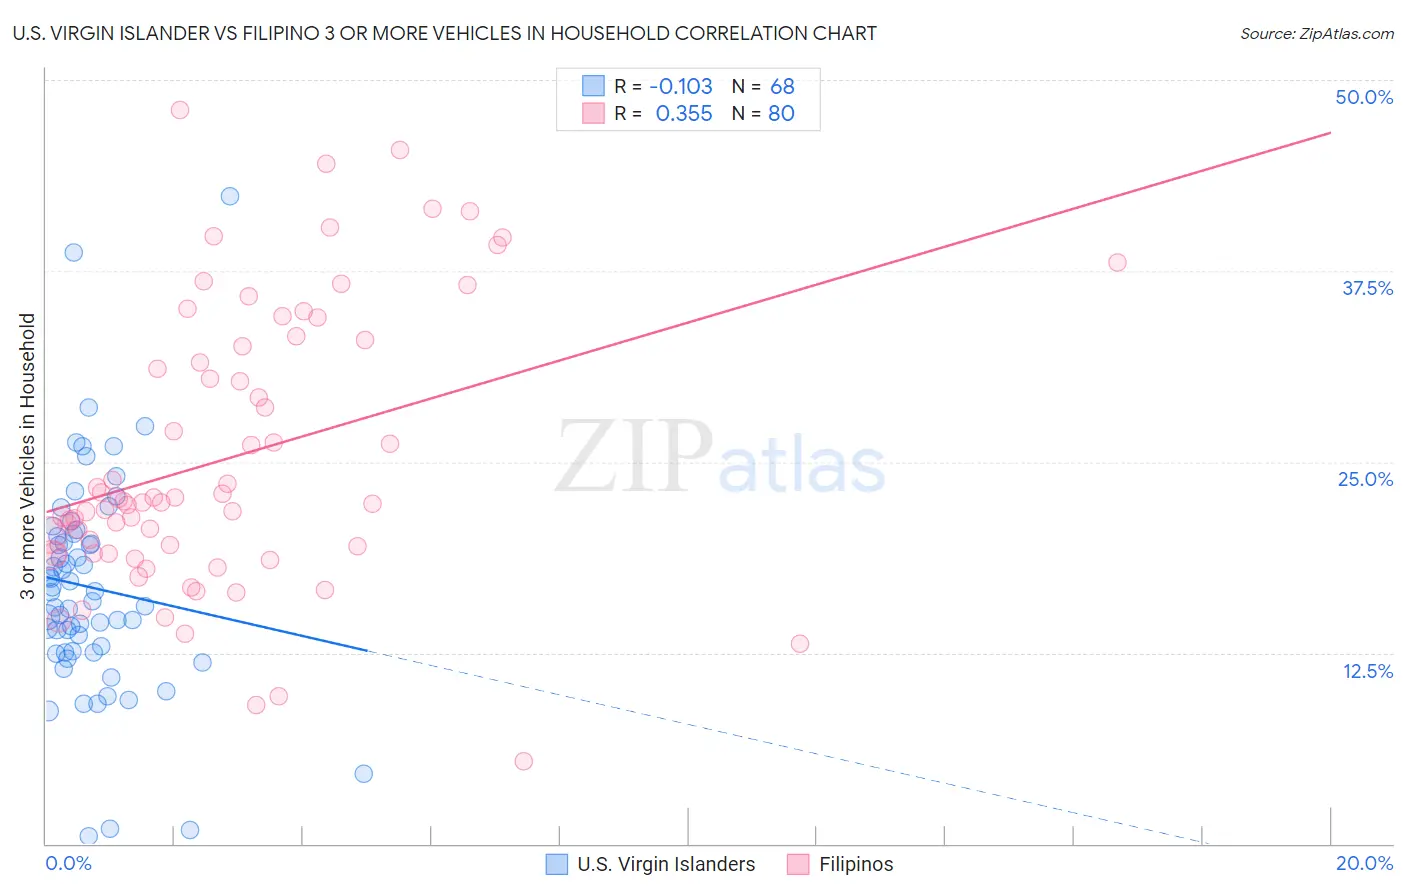
U.S. Virgin Islander vs Filipino 3 or more Vehicles in Household Correlation Chart
The statistical analysis conducted on geographies consisting of 87,505,701 people shows a poor negative correlation between the proportion of U.S. Virgin Islanders and percentage of households with 3 or more vehicles available in the United States with a correlation coefficient (R) of -0.103 and weighted average of 15.4%. Similarly, the statistical analysis conducted on geographies consisting of 254,051,134 people shows a mild positive correlation between the proportion of Filipinos and percentage of households with 3 or more vehicles available in the United States with a correlation coefficient (R) of 0.355 and weighted average of 20.8%, a difference of 35.0%.
3 or more Vehicles in Household Correlation Summary
| Measurement | U.S. Virgin Islander | Filipino |
| Minimum | 0.49% | 5.4% |
| Maximum | 42.4% | 48.0% |
| Range | 41.9% | 42.6% |
| Mean | 16.8% | 25.3% |
| Median | 16.2% | 22.4% |
| Interquartile 25% (IQ1) | 12.6% | 19.0% |
| Interquartile 75% (IQ3) | 20.2% | 32.8% |
| Interquartile Range (IQR) | 7.6% | 13.8% |
| Standard Deviation (Sample) | 7.3% | 9.2% |
| Standard Deviation (Population) | 7.2% | 9.1% |
Similar Demographics by 3 or more Vehicles in Household
Demographics Similar to U.S. Virgin Islanders by 3 or more Vehicles in Household
In terms of 3 or more vehicles in household, the demographic groups most similar to U.S. Virgin Islanders are Haitian (15.5%, a difference of 0.52%), Immigrants from Belarus (15.5%, a difference of 0.84%), Jamaican (15.2%, a difference of 1.2%), Immigrants from Haiti (15.2%, a difference of 1.4%), and Immigrants from Israel (15.6%, a difference of 1.5%).
| Demographics | Rating | Rank | 3 or more Vehicles in Household |
| Immigrants | Somalia | 0.0 /100 | #309 | Tragic 15.9% |
| Moroccans | 0.0 /100 | #310 | Tragic 15.9% |
| Albanians | 0.0 /100 | #311 | Tragic 15.8% |
| Puerto Ricans | 0.0 /100 | #312 | Tragic 15.6% |
| Immigrants | Israel | 0.0 /100 | #313 | Tragic 15.6% |
| Immigrants | Belarus | 0.0 /100 | #314 | Tragic 15.5% |
| Haitians | 0.0 /100 | #315 | Tragic 15.5% |
| U.S. Virgin Islanders | 0.0 /100 | #316 | Tragic 15.4% |
| Jamaicans | 0.0 /100 | #317 | Tragic 15.2% |
| Immigrants | Haiti | 0.0 /100 | #318 | Tragic 15.2% |
| Cape Verdeans | 0.0 /100 | #319 | Tragic 15.0% |
| Yup'ik | 0.0 /100 | #320 | Tragic 14.8% |
| Immigrants | Jamaica | 0.0 /100 | #321 | Tragic 14.7% |
| Immigrants | West Indies | 0.0 /100 | #322 | Tragic 14.6% |
| Immigrants | Caribbean | 0.0 /100 | #323 | Tragic 14.6% |
Demographics Similar to Filipinos by 3 or more Vehicles in Household
In terms of 3 or more vehicles in household, the demographic groups most similar to Filipinos are Immigrants from Scotland (20.8%, a difference of 0.060%), Asian (20.8%, a difference of 0.14%), Immigrants from Micronesia (20.7%, a difference of 0.17%), Immigrants from Germany (20.8%, a difference of 0.21%), and Bolivian (20.8%, a difference of 0.25%).
| Demographics | Rating | Rank | 3 or more Vehicles in Household |
| Seminole | 97.8 /100 | #102 | Exceptional 20.9% |
| Dutch West Indians | 97.8 /100 | #103 | Exceptional 20.9% |
| Luxembourgers | 97.7 /100 | #104 | Exceptional 20.9% |
| Austrians | 97.5 /100 | #105 | Exceptional 20.9% |
| Bolivians | 97.4 /100 | #106 | Exceptional 20.8% |
| Immigrants | Germany | 97.4 /100 | #107 | Exceptional 20.8% |
| Immigrants | Scotland | 97.1 /100 | #108 | Exceptional 20.8% |
| Filipinos | 97.0 /100 | #109 | Exceptional 20.8% |
| Asians | 96.8 /100 | #110 | Exceptional 20.8% |
| Immigrants | Micronesia | 96.7 /100 | #111 | Exceptional 20.7% |
| Nicaraguans | 96.2 /100 | #112 | Exceptional 20.7% |
| Immigrants | England | 96.2 /100 | #113 | Exceptional 20.7% |
| Burmese | 95.8 /100 | #114 | Exceptional 20.6% |
| French Canadians | 95.0 /100 | #115 | Exceptional 20.6% |
| Italians | 94.9 /100 | #116 | Exceptional 20.6% |