Peruvian vs Jordanian 8th Grade
COMPARE
Peruvian
Jordanian
8th Grade
8th Grade Comparison
Peruvians
Jordanians
94.7%
8TH GRADE
0.1/ 100
METRIC RATING
276th/ 347
METRIC RANK
96.1%
8TH GRADE
91.3/ 100
METRIC RATING
136th/ 347
METRIC RANK
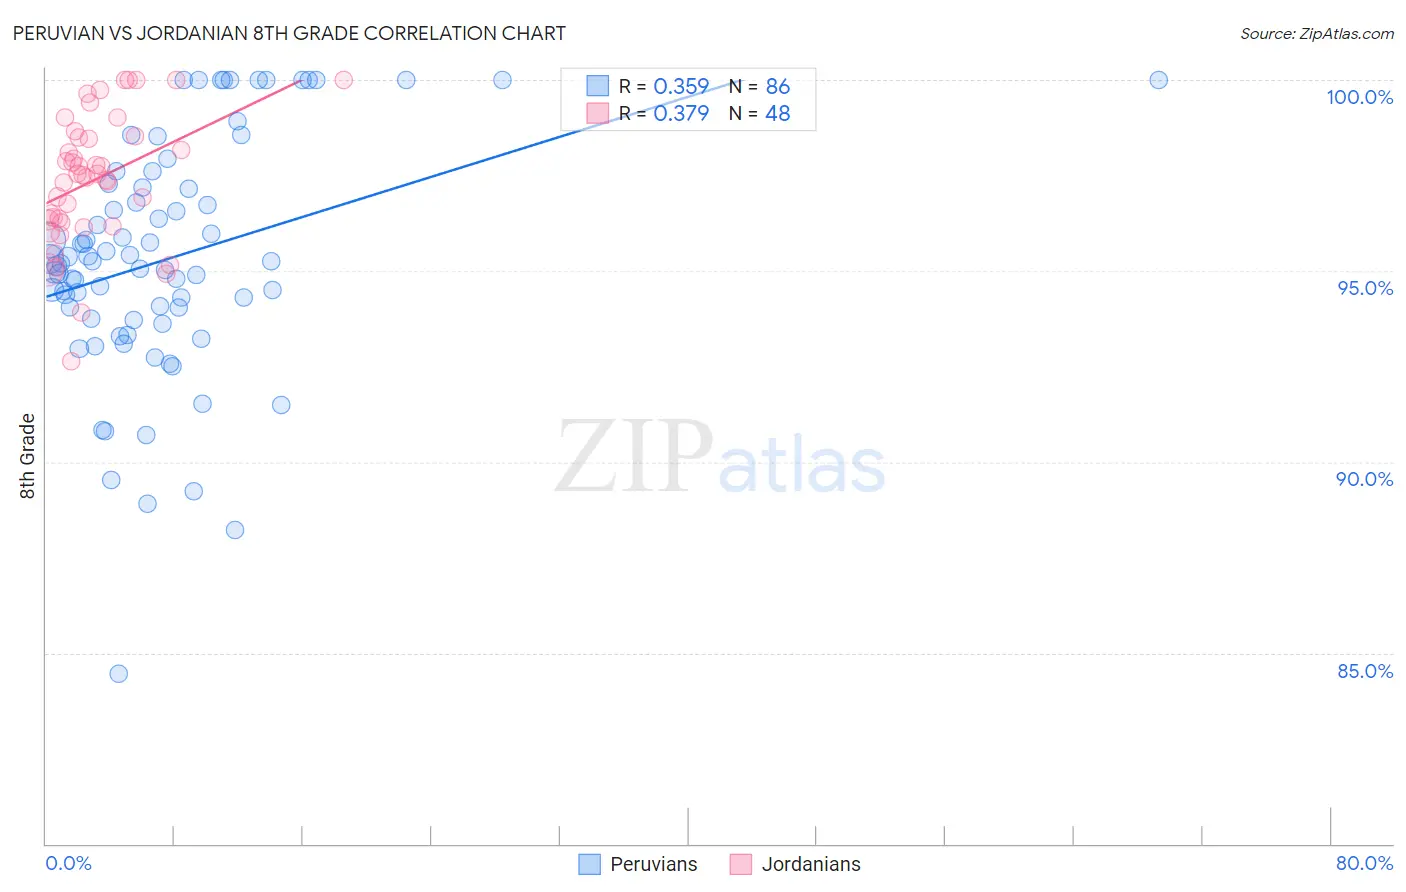
Peruvian vs Jordanian 8th Grade Correlation Chart
The statistical analysis conducted on geographies consisting of 363,251,075 people shows a mild positive correlation between the proportion of Peruvians and percentage of population with at least 8th grade education in the United States with a correlation coefficient (R) of 0.359 and weighted average of 94.7%. Similarly, the statistical analysis conducted on geographies consisting of 166,403,553 people shows a mild positive correlation between the proportion of Jordanians and percentage of population with at least 8th grade education in the United States with a correlation coefficient (R) of 0.379 and weighted average of 96.1%, a difference of 1.5%.
8th Grade Correlation Summary
| Measurement | Peruvian | Jordanian |
| Minimum | 84.4% | 92.6% |
| Maximum | 100.0% | 100.0% |
| Range | 15.6% | 7.4% |
| Mean | 95.3% | 97.4% |
| Median | 95.2% | 97.5% |
| Interquartile 25% (IQ1) | 93.8% | 96.3% |
| Interquartile 75% (IQ3) | 97.2% | 98.5% |
| Interquartile Range (IQR) | 3.4% | 2.2% |
| Standard Deviation (Sample) | 3.1% | 1.7% |
| Standard Deviation (Population) | 3.1% | 1.7% |
Similar Demographics by 8th Grade
Demographics Similar to Peruvians by 8th Grade
In terms of 8th grade, the demographic groups most similar to Peruvians are Immigrants from Colombia (94.7%, a difference of 0.030%), Taiwanese (94.7%, a difference of 0.030%), Trinidadian and Tobagonian (94.7%, a difference of 0.040%), Immigrants from Western Africa (94.8%, a difference of 0.050%), and Immigrants from South America (94.8%, a difference of 0.060%).
| Demographics | Rating | Rank | 8th Grade |
| Immigrants | Thailand | 0.2 /100 | #269 | Tragic 94.8% |
| Immigrants | Uzbekistan | 0.2 /100 | #270 | Tragic 94.8% |
| Immigrants | Afghanistan | 0.2 /100 | #271 | Tragic 94.8% |
| Immigrants | South America | 0.2 /100 | #272 | Tragic 94.8% |
| Immigrants | Western Africa | 0.2 /100 | #273 | Tragic 94.8% |
| Trinidadians and Tobagonians | 0.2 /100 | #274 | Tragic 94.7% |
| Immigrants | Colombia | 0.2 /100 | #275 | Tragic 94.7% |
| Peruvians | 0.1 /100 | #276 | Tragic 94.7% |
| Taiwanese | 0.1 /100 | #277 | Tragic 94.7% |
| Armenians | 0.1 /100 | #278 | Tragic 94.7% |
| Immigrants | Trinidad and Tobago | 0.1 /100 | #279 | Tragic 94.6% |
| Barbadians | 0.1 /100 | #280 | Tragic 94.6% |
| Immigrants | Bolivia | 0.1 /100 | #281 | Tragic 94.6% |
| Immigrants | Eritrea | 0.1 /100 | #282 | Tragic 94.6% |
| Immigrants | St. Vincent and the Grenadines | 0.1 /100 | #283 | Tragic 94.6% |
Demographics Similar to Jordanians by 8th Grade
In terms of 8th grade, the demographic groups most similar to Jordanians are Immigrants from Hungary (96.1%, a difference of 0.0%), Basque (96.1%, a difference of 0.0%), Immigrants from Turkey (96.1%, a difference of 0.010%), Cambodian (96.1%, a difference of 0.010%), and Pueblo (96.1%, a difference of 0.020%).
| Demographics | Rating | Rank | 8th Grade |
| Cheyenne | 93.3 /100 | #129 | Exceptional 96.1% |
| Soviet Union | 92.6 /100 | #130 | Exceptional 96.1% |
| Pueblo | 92.3 /100 | #131 | Exceptional 96.1% |
| Immigrants | Kuwait | 92.2 /100 | #132 | Exceptional 96.1% |
| Immigrants | Turkey | 91.7 /100 | #133 | Exceptional 96.1% |
| Immigrants | Hungary | 91.5 /100 | #134 | Exceptional 96.1% |
| Basques | 91.5 /100 | #135 | Exceptional 96.1% |
| Jordanians | 91.3 /100 | #136 | Exceptional 96.1% |
| Cambodians | 90.6 /100 | #137 | Exceptional 96.1% |
| Burmese | 90.2 /100 | #138 | Exceptional 96.1% |
| Hmong | 89.7 /100 | #139 | Excellent 96.1% |
| Immigrants | South Central Asia | 89.4 /100 | #140 | Excellent 96.1% |
| Immigrants | Greece | 85.9 /100 | #141 | Excellent 96.0% |
| Immigrants | Eastern Europe | 85.4 /100 | #142 | Excellent 96.0% |
| Spanish | 85.1 /100 | #143 | Excellent 96.0% |