Nonimmigrants vs Inupiat 3 or more Vehicles in Household
COMPARE
Nonimmigrants
Inupiat
3 or more Vehicles in Household
3 or more Vehicles in Household Comparison
Nonimmigrants
Inupiat
21.8%
3 OR MORE VEHICLES IN HOUSEHOLD
99.8/ 100
METRIC RATING
76th/ 347
METRIC RANK
16.9%
3 OR MORE VEHICLES IN HOUSEHOLD
0.1/ 100
METRIC RATING
296th/ 347
METRIC RANK
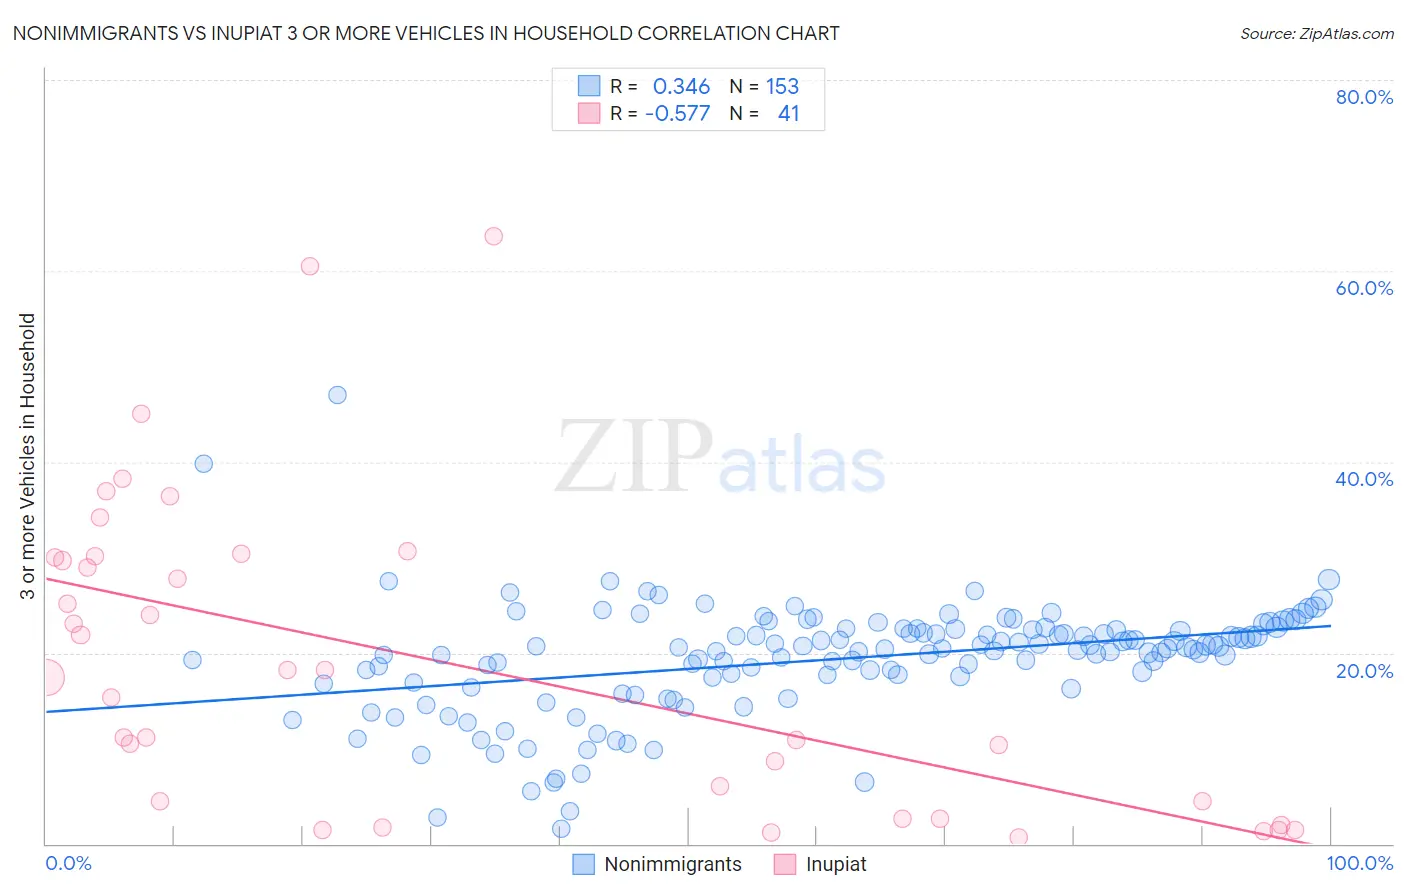
Nonimmigrants vs Inupiat 3 or more Vehicles in Household Correlation Chart
The statistical analysis conducted on geographies consisting of 584,058,560 people shows a mild positive correlation between the proportion of Nonimmigrants and percentage of households with 3 or more vehicles available in the United States with a correlation coefficient (R) of 0.346 and weighted average of 21.8%. Similarly, the statistical analysis conducted on geographies consisting of 96,277,833 people shows a substantial negative correlation between the proportion of Inupiat and percentage of households with 3 or more vehicles available in the United States with a correlation coefficient (R) of -0.577 and weighted average of 16.9%, a difference of 29.2%.
3 or more Vehicles in Household Correlation Summary
| Measurement | Nonimmigrants | Inupiat |
| Minimum | 1.6% | 0.71% |
| Maximum | 47.1% | 63.6% |
| Range | 45.5% | 62.9% |
| Mean | 19.3% | 19.0% |
| Median | 20.4% | 17.4% |
| Interquartile 25% (IQ1) | 17.2% | 3.5% |
| Interquartile 75% (IQ3) | 22.5% | 30.0% |
| Interquartile Range (IQR) | 5.3% | 26.5% |
| Standard Deviation (Sample) | 5.9% | 16.3% |
| Standard Deviation (Population) | 5.9% | 16.1% |
Similar Demographics by 3 or more Vehicles in Household
Demographics Similar to Nonimmigrants by 3 or more Vehicles in Household
In terms of 3 or more vehicles in household, the demographic groups most similar to Nonimmigrants are Japanese (21.8%, a difference of 0.040%), Irish (21.8%, a difference of 0.070%), Immigrants from Oceania (21.8%, a difference of 0.15%), Salvadoran (21.8%, a difference of 0.16%), and Czechoslovakian (21.7%, a difference of 0.20%).
| Demographics | Rating | Rank | 3 or more Vehicles in Household |
| Creek | 99.9 /100 | #69 | Exceptional 21.9% |
| Bangladeshis | 99.8 /100 | #70 | Exceptional 21.9% |
| Potawatomi | 99.8 /100 | #71 | Exceptional 21.9% |
| Portuguese | 99.8 /100 | #72 | Exceptional 21.8% |
| Salvadorans | 99.8 /100 | #73 | Exceptional 21.8% |
| Immigrants | Oceania | 99.8 /100 | #74 | Exceptional 21.8% |
| Japanese | 99.8 /100 | #75 | Exceptional 21.8% |
| Immigrants | Nonimmigrants | 99.8 /100 | #76 | Exceptional 21.8% |
| Irish | 99.8 /100 | #77 | Exceptional 21.8% |
| Czechoslovakians | 99.8 /100 | #78 | Exceptional 21.7% |
| Assyrians/Chaldeans/Syriacs | 99.8 /100 | #79 | Exceptional 21.7% |
| Afghans | 99.7 /100 | #80 | Exceptional 21.7% |
| Celtics | 99.7 /100 | #81 | Exceptional 21.7% |
| Immigrants | El Salvador | 99.6 /100 | #82 | Exceptional 21.5% |
| Chippewa | 99.6 /100 | #83 | Exceptional 21.5% |
Demographics Similar to Inupiat by 3 or more Vehicles in Household
In terms of 3 or more vehicles in household, the demographic groups most similar to Inupiat are Immigrants from Russia (16.9%, a difference of 0.36%), Immigrants from Western Africa (16.9%, a difference of 0.41%), Israeli (16.8%, a difference of 0.47%), Bahamian (16.9%, a difference of 0.52%), and Immigrants from Spain (17.0%, a difference of 0.60%).
| Demographics | Rating | Rank | 3 or more Vehicles in Household |
| Immigrants | Liberia | 0.1 /100 | #289 | Tragic 17.1% |
| Liberians | 0.1 /100 | #290 | Tragic 17.0% |
| Immigrants | Congo | 0.1 /100 | #291 | Tragic 17.0% |
| Immigrants | Spain | 0.1 /100 | #292 | Tragic 17.0% |
| Bahamians | 0.1 /100 | #293 | Tragic 16.9% |
| Immigrants | Western Africa | 0.1 /100 | #294 | Tragic 16.9% |
| Immigrants | Russia | 0.1 /100 | #295 | Tragic 16.9% |
| Inupiat | 0.1 /100 | #296 | Tragic 16.9% |
| Israelis | 0.1 /100 | #297 | Tragic 16.8% |
| Immigrants | Zaire | 0.1 /100 | #298 | Tragic 16.7% |
| Immigrants | South America | 0.1 /100 | #299 | Tragic 16.7% |
| Cypriots | 0.0 /100 | #300 | Tragic 16.6% |
| Paraguayans | 0.0 /100 | #301 | Tragic 16.6% |
| Immigrants | Greece | 0.0 /100 | #302 | Tragic 16.5% |
| Immigrants | Serbia | 0.0 /100 | #303 | Tragic 16.4% |