Nonimmigrants vs Immigrants from Panama 3 or more Vehicles in Household
COMPARE
Nonimmigrants
Immigrants from Panama
3 or more Vehicles in Household
3 or more Vehicles in Household Comparison
Nonimmigrants
Immigrants from Panama
21.8%
3 OR MORE VEHICLES IN HOUSEHOLD
99.8/ 100
METRIC RATING
76th/ 347
METRIC RANK
17.7%
3 OR MORE VEHICLES IN HOUSEHOLD
0.8/ 100
METRIC RATING
265th/ 347
METRIC RANK
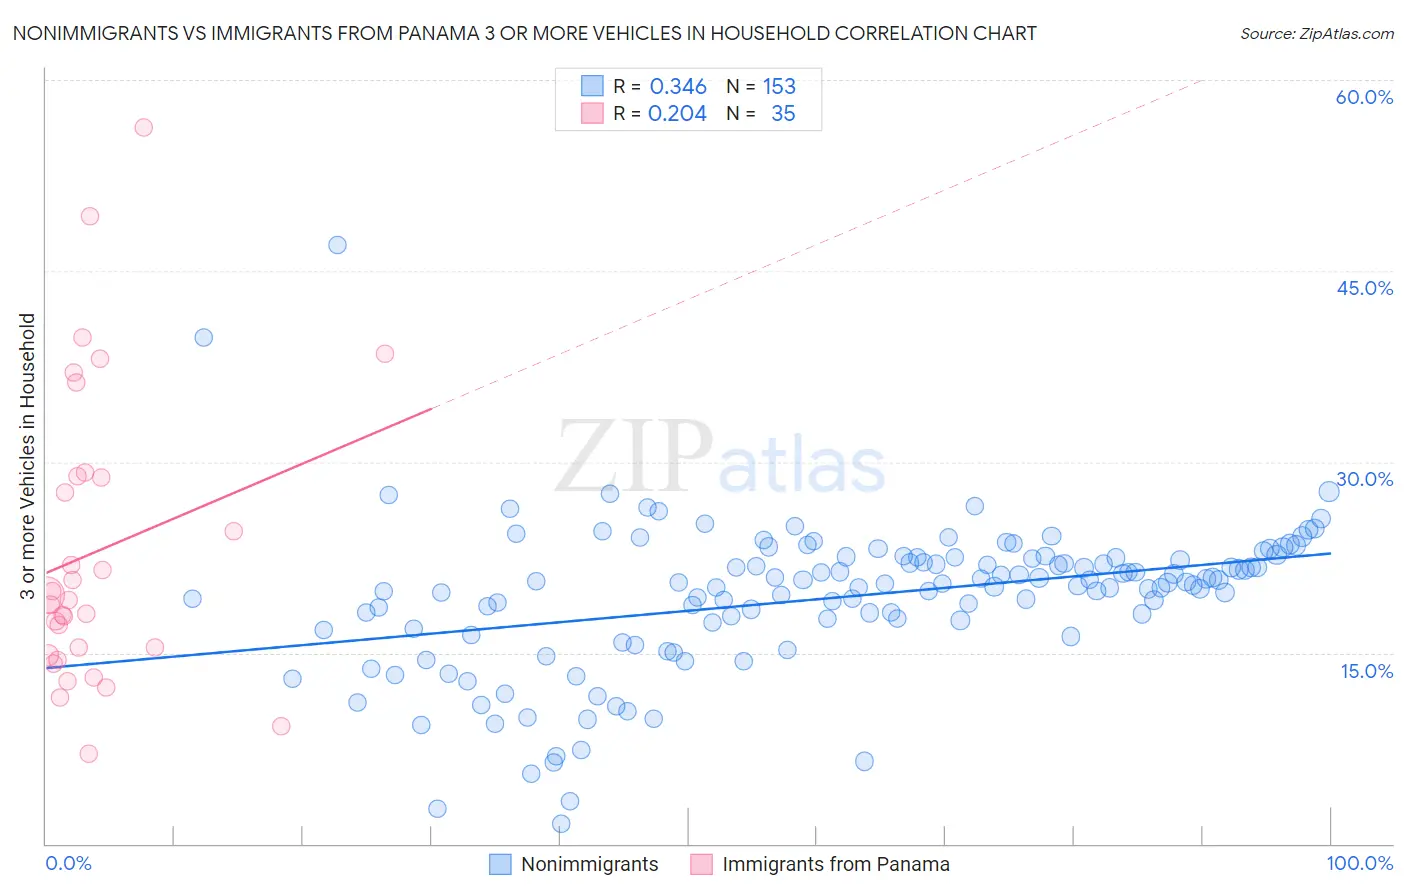
Nonimmigrants vs Immigrants from Panama 3 or more Vehicles in Household Correlation Chart
The statistical analysis conducted on geographies consisting of 584,058,560 people shows a mild positive correlation between the proportion of Nonimmigrants and percentage of households with 3 or more vehicles available in the United States with a correlation coefficient (R) of 0.346 and weighted average of 21.8%. Similarly, the statistical analysis conducted on geographies consisting of 221,149,487 people shows a weak positive correlation between the proportion of Immigrants from Panama and percentage of households with 3 or more vehicles available in the United States with a correlation coefficient (R) of 0.204 and weighted average of 17.7%, a difference of 22.8%.
3 or more Vehicles in Household Correlation Summary
| Measurement | Nonimmigrants | Immigrants from Panama |
| Minimum | 1.6% | 7.1% |
| Maximum | 47.1% | 56.2% |
| Range | 45.5% | 49.1% |
| Mean | 19.3% | 23.0% |
| Median | 20.4% | 19.1% |
| Interquartile 25% (IQ1) | 17.2% | 14.8% |
| Interquartile 75% (IQ3) | 22.5% | 28.9% |
| Interquartile Range (IQR) | 5.3% | 14.1% |
| Standard Deviation (Sample) | 5.9% | 11.5% |
| Standard Deviation (Population) | 5.9% | 11.3% |
Similar Demographics by 3 or more Vehicles in Household
Demographics Similar to Nonimmigrants by 3 or more Vehicles in Household
In terms of 3 or more vehicles in household, the demographic groups most similar to Nonimmigrants are Japanese (21.8%, a difference of 0.040%), Irish (21.8%, a difference of 0.070%), Immigrants from Oceania (21.8%, a difference of 0.15%), Salvadoran (21.8%, a difference of 0.16%), and Czechoslovakian (21.7%, a difference of 0.20%).
| Demographics | Rating | Rank | 3 or more Vehicles in Household |
| Creek | 99.9 /100 | #69 | Exceptional 21.9% |
| Bangladeshis | 99.8 /100 | #70 | Exceptional 21.9% |
| Potawatomi | 99.8 /100 | #71 | Exceptional 21.9% |
| Portuguese | 99.8 /100 | #72 | Exceptional 21.8% |
| Salvadorans | 99.8 /100 | #73 | Exceptional 21.8% |
| Immigrants | Oceania | 99.8 /100 | #74 | Exceptional 21.8% |
| Japanese | 99.8 /100 | #75 | Exceptional 21.8% |
| Immigrants | Nonimmigrants | 99.8 /100 | #76 | Exceptional 21.8% |
| Irish | 99.8 /100 | #77 | Exceptional 21.8% |
| Czechoslovakians | 99.8 /100 | #78 | Exceptional 21.7% |
| Assyrians/Chaldeans/Syriacs | 99.8 /100 | #79 | Exceptional 21.7% |
| Afghans | 99.7 /100 | #80 | Exceptional 21.7% |
| Celtics | 99.7 /100 | #81 | Exceptional 21.7% |
| Immigrants | El Salvador | 99.6 /100 | #82 | Exceptional 21.5% |
| Chippewa | 99.6 /100 | #83 | Exceptional 21.5% |
Demographics Similar to Immigrants from Panama by 3 or more Vehicles in Household
In terms of 3 or more vehicles in household, the demographic groups most similar to Immigrants from Panama are Macedonian (17.7%, a difference of 0.020%), Immigrants from Venezuela (17.7%, a difference of 0.080%), Immigrants from Bulgaria (17.7%, a difference of 0.090%), Cambodian (17.8%, a difference of 0.14%), and Bermudan (17.8%, a difference of 0.16%).
| Demographics | Rating | Rank | 3 or more Vehicles in Household |
| Sudanese | 1.1 /100 | #258 | Tragic 17.8% |
| Uruguayans | 1.0 /100 | #259 | Tragic 17.8% |
| Ugandans | 0.9 /100 | #260 | Tragic 17.8% |
| Immigrants | Northern Africa | 0.9 /100 | #261 | Tragic 17.8% |
| Colombians | 0.9 /100 | #262 | Tragic 17.8% |
| Bermudans | 0.9 /100 | #263 | Tragic 17.8% |
| Cambodians | 0.9 /100 | #264 | Tragic 17.8% |
| Immigrants | Panama | 0.8 /100 | #265 | Tragic 17.7% |
| Macedonians | 0.8 /100 | #266 | Tragic 17.7% |
| Immigrants | Venezuela | 0.8 /100 | #267 | Tragic 17.7% |
| Immigrants | Bulgaria | 0.8 /100 | #268 | Tragic 17.7% |
| Immigrants | France | 0.6 /100 | #269 | Tragic 17.6% |
| Immigrants | Nepal | 0.6 /100 | #270 | Tragic 17.6% |
| South Americans | 0.6 /100 | #271 | Tragic 17.6% |
| Immigrants | Africa | 0.5 /100 | #272 | Tragic 17.6% |