Nonimmigrants vs Potawatomi 3 or more Vehicles in Household
COMPARE
Nonimmigrants
Potawatomi
3 or more Vehicles in Household
3 or more Vehicles in Household Comparison
Nonimmigrants
Potawatomi
21.8%
3 OR MORE VEHICLES IN HOUSEHOLD
99.8/ 100
METRIC RATING
76th/ 347
METRIC RANK
21.9%
3 OR MORE VEHICLES IN HOUSEHOLD
99.8/ 100
METRIC RATING
71st/ 347
METRIC RANK
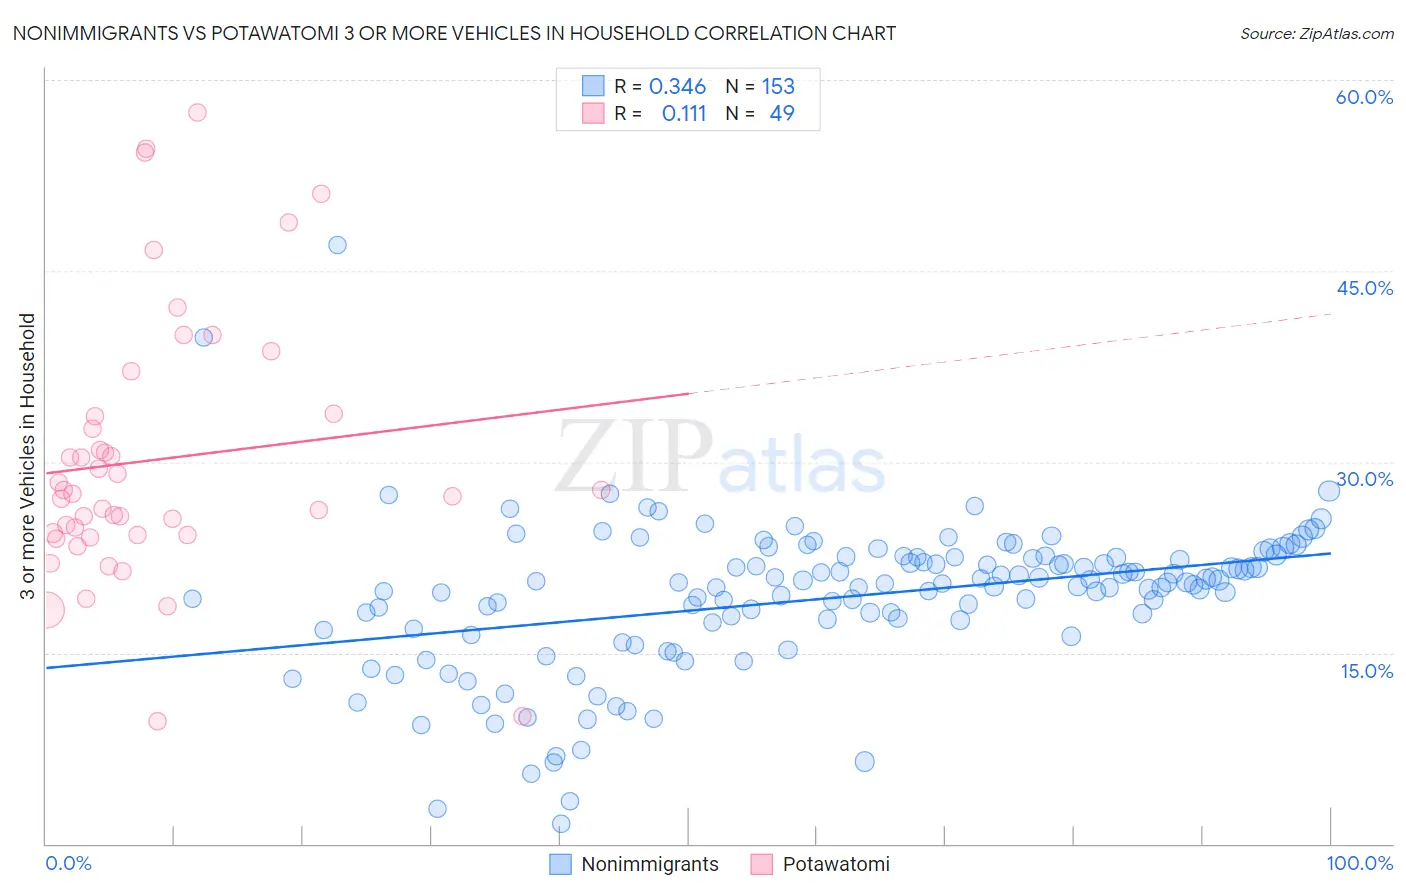
Nonimmigrants vs Potawatomi 3 or more Vehicles in Household Correlation Chart
The statistical analysis conducted on geographies consisting of 584,058,560 people shows a mild positive correlation between the proportion of Nonimmigrants and percentage of households with 3 or more vehicles available in the United States with a correlation coefficient (R) of 0.346 and weighted average of 21.8%. Similarly, the statistical analysis conducted on geographies consisting of 117,753,482 people shows a poor positive correlation between the proportion of Potawatomi and percentage of households with 3 or more vehicles available in the United States with a correlation coefficient (R) of 0.111 and weighted average of 21.9%, a difference of 0.43%.
3 or more Vehicles in Household Correlation Summary
| Measurement | Nonimmigrants | Potawatomi |
| Minimum | 1.6% | 9.7% |
| Maximum | 47.1% | 57.4% |
| Range | 45.5% | 47.8% |
| Mean | 19.3% | 30.2% |
| Median | 20.4% | 27.5% |
| Interquartile 25% (IQ1) | 17.2% | 24.2% |
| Interquartile 75% (IQ3) | 22.5% | 33.7% |
| Interquartile Range (IQR) | 5.3% | 9.4% |
| Standard Deviation (Sample) | 5.9% | 10.5% |
| Standard Deviation (Population) | 5.9% | 10.4% |
Demographics Similar to Nonimmigrants and Potawatomi by 3 or more Vehicles in Household
In terms of 3 or more vehicles in household, the demographic groups most similar to Nonimmigrants are Japanese (21.8%, a difference of 0.040%), Irish (21.8%, a difference of 0.070%), Immigrants from Oceania (21.8%, a difference of 0.15%), Salvadoran (21.8%, a difference of 0.16%), and Czechoslovakian (21.7%, a difference of 0.20%). Similarly, the demographic groups most similar to Potawatomi are Bangladeshi (21.9%, a difference of 0.010%), Portuguese (21.8%, a difference of 0.18%), Creek (21.9%, a difference of 0.20%), British (21.9%, a difference of 0.23%), and Salvadoran (21.8%, a difference of 0.27%).
| Demographics | Rating | Rank | 3 or more Vehicles in Household |
| Chickasaw | 99.9 /100 | #63 | Exceptional 22.2% |
| Immigrants | Taiwan | 99.9 /100 | #64 | Exceptional 22.1% |
| Pima | 99.9 /100 | #65 | Exceptional 22.0% |
| Northern Europeans | 99.9 /100 | #66 | Exceptional 22.0% |
| Alaskan Athabascans | 99.9 /100 | #67 | Exceptional 21.9% |
| British | 99.9 /100 | #68 | Exceptional 21.9% |
| Creek | 99.9 /100 | #69 | Exceptional 21.9% |
| Bangladeshis | 99.8 /100 | #70 | Exceptional 21.9% |
| Potawatomi | 99.8 /100 | #71 | Exceptional 21.9% |
| Portuguese | 99.8 /100 | #72 | Exceptional 21.8% |
| Salvadorans | 99.8 /100 | #73 | Exceptional 21.8% |
| Immigrants | Oceania | 99.8 /100 | #74 | Exceptional 21.8% |
| Japanese | 99.8 /100 | #75 | Exceptional 21.8% |
| Immigrants | Nonimmigrants | 99.8 /100 | #76 | Exceptional 21.8% |
| Irish | 99.8 /100 | #77 | Exceptional 21.8% |
| Czechoslovakians | 99.8 /100 | #78 | Exceptional 21.7% |
| Assyrians/Chaldeans/Syriacs | 99.8 /100 | #79 | Exceptional 21.7% |
| Afghans | 99.7 /100 | #80 | Exceptional 21.7% |
| Celtics | 99.7 /100 | #81 | Exceptional 21.7% |
| Immigrants | El Salvador | 99.6 /100 | #82 | Exceptional 21.5% |
| Chippewa | 99.6 /100 | #83 | Exceptional 21.5% |