Apache vs Immigrants from Middle Africa 3 or more Vehicles in Household
COMPARE
Apache
Immigrants from Middle Africa
3 or more Vehicles in Household
3 or more Vehicles in Household Comparison
Apache
Immigrants from Middle Africa
21.2%
3 OR MORE VEHICLES IN HOUSEHOLD
98.9/ 100
METRIC RATING
92nd/ 347
METRIC RANK
18.2%
3 OR MORE VEHICLES IN HOUSEHOLD
3.1/ 100
METRIC RATING
239th/ 347
METRIC RANK
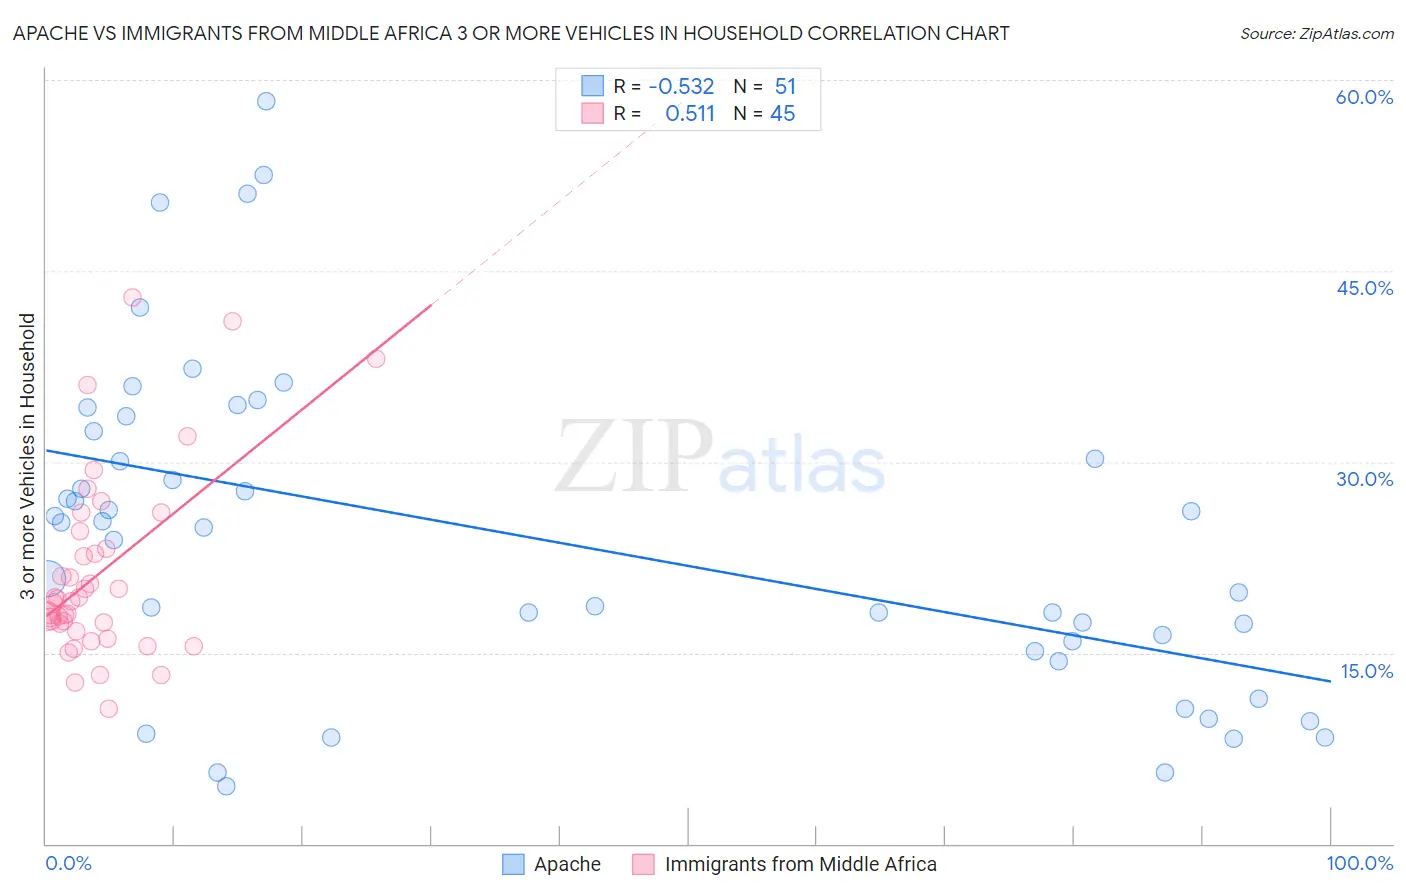
Apache vs Immigrants from Middle Africa 3 or more Vehicles in Household Correlation Chart
The statistical analysis conducted on geographies consisting of 231,026,513 people shows a substantial negative correlation between the proportion of Apache and percentage of households with 3 or more vehicles available in the United States with a correlation coefficient (R) of -0.532 and weighted average of 21.2%. Similarly, the statistical analysis conducted on geographies consisting of 202,639,411 people shows a substantial positive correlation between the proportion of Immigrants from Middle Africa and percentage of households with 3 or more vehicles available in the United States with a correlation coefficient (R) of 0.511 and weighted average of 18.2%, a difference of 16.0%.
3 or more Vehicles in Household Correlation Summary
| Measurement | Apache | Immigrants from Middle Africa |
| Minimum | 4.5% | 10.6% |
| Maximum | 58.3% | 42.9% |
| Range | 53.9% | 32.3% |
| Mean | 24.1% | 21.2% |
| Median | 24.8% | 19.1% |
| Interquartile 25% (IQ1) | 15.1% | 17.0% |
| Interquartile 75% (IQ3) | 32.4% | 23.8% |
| Interquartile Range (IQR) | 17.3% | 6.8% |
| Standard Deviation (Sample) | 12.8% | 7.3% |
| Standard Deviation (Population) | 12.7% | 7.2% |
Similar Demographics by 3 or more Vehicles in Household
Demographics Similar to Apache by 3 or more Vehicles in Household
In terms of 3 or more vehicles in household, the demographic groups most similar to Apache are Belgian (21.2%, a difference of 0.080%), Immigrants from Indonesia (21.1%, a difference of 0.20%), Immigrants from Afghanistan (21.2%, a difference of 0.41%), Immigrants from Cambodia (21.1%, a difference of 0.43%), and Pakistani (21.0%, a difference of 0.57%).
| Demographics | Rating | Rank | 3 or more Vehicles in Household |
| Laotians | 99.6 /100 | #85 | Exceptional 21.5% |
| Delaware | 99.6 /100 | #86 | Exceptional 21.5% |
| Immigrants | Azores | 99.5 /100 | #87 | Exceptional 21.5% |
| French | 99.4 /100 | #88 | Exceptional 21.4% |
| Marshallese | 99.2 /100 | #89 | Exceptional 21.3% |
| Immigrants | Afghanistan | 99.1 /100 | #90 | Exceptional 21.2% |
| Belgians | 98.9 /100 | #91 | Exceptional 21.2% |
| Apache | 98.9 /100 | #92 | Exceptional 21.2% |
| Immigrants | Indonesia | 98.8 /100 | #93 | Exceptional 21.1% |
| Immigrants | Cambodia | 98.6 /100 | #94 | Exceptional 21.1% |
| Pakistanis | 98.5 /100 | #95 | Exceptional 21.0% |
| Cree | 98.4 /100 | #96 | Exceptional 21.0% |
| Canadians | 98.3 /100 | #97 | Exceptional 21.0% |
| Hmong | 98.2 /100 | #98 | Exceptional 21.0% |
| Alaska Natives | 98.2 /100 | #99 | Exceptional 21.0% |
Demographics Similar to Immigrants from Middle Africa by 3 or more Vehicles in Household
In terms of 3 or more vehicles in household, the demographic groups most similar to Immigrants from Middle Africa are Immigrants from Honduras (18.2%, a difference of 0.010%), Immigrants from China (18.2%, a difference of 0.13%), Indonesian (18.3%, a difference of 0.24%), Immigrants from Malaysia (18.3%, a difference of 0.28%), and African (18.2%, a difference of 0.32%).
| Demographics | Rating | Rank | 3 or more Vehicles in Household |
| Immigrants | Uganda | 4.6 /100 | #232 | Tragic 18.4% |
| Hondurans | 4.6 /100 | #233 | Tragic 18.4% |
| Immigrants | North Macedonia | 4.4 /100 | #234 | Tragic 18.4% |
| Sierra Leoneans | 3.9 /100 | #235 | Tragic 18.3% |
| Immigrants | Malaysia | 3.6 /100 | #236 | Tragic 18.3% |
| Indonesians | 3.5 /100 | #237 | Tragic 18.3% |
| Immigrants | Honduras | 3.1 /100 | #238 | Tragic 18.2% |
| Immigrants | Middle Africa | 3.1 /100 | #239 | Tragic 18.2% |
| Immigrants | China | 2.9 /100 | #240 | Tragic 18.2% |
| Africans | 2.7 /100 | #241 | Tragic 18.2% |
| Hopi | 2.5 /100 | #242 | Tragic 18.2% |
| Immigrants | Europe | 2.4 /100 | #243 | Tragic 18.1% |
| Mongolians | 2.3 /100 | #244 | Tragic 18.1% |
| Immigrants | Belize | 2.1 /100 | #245 | Tragic 18.1% |
| Immigrants | Australia | 2.0 /100 | #246 | Tragic 18.1% |