Immigrants from Scotland vs Immigrants from Middle Africa 3 or more Vehicles in Household
COMPARE
Immigrants from Scotland
Immigrants from Middle Africa
3 or more Vehicles in Household
3 or more Vehicles in Household Comparison
Immigrants from Scotland
Immigrants from Middle Africa
20.8%
3 OR MORE VEHICLES IN HOUSEHOLD
97.1/ 100
METRIC RATING
108th/ 347
METRIC RANK
18.2%
3 OR MORE VEHICLES IN HOUSEHOLD
3.1/ 100
METRIC RATING
239th/ 347
METRIC RANK
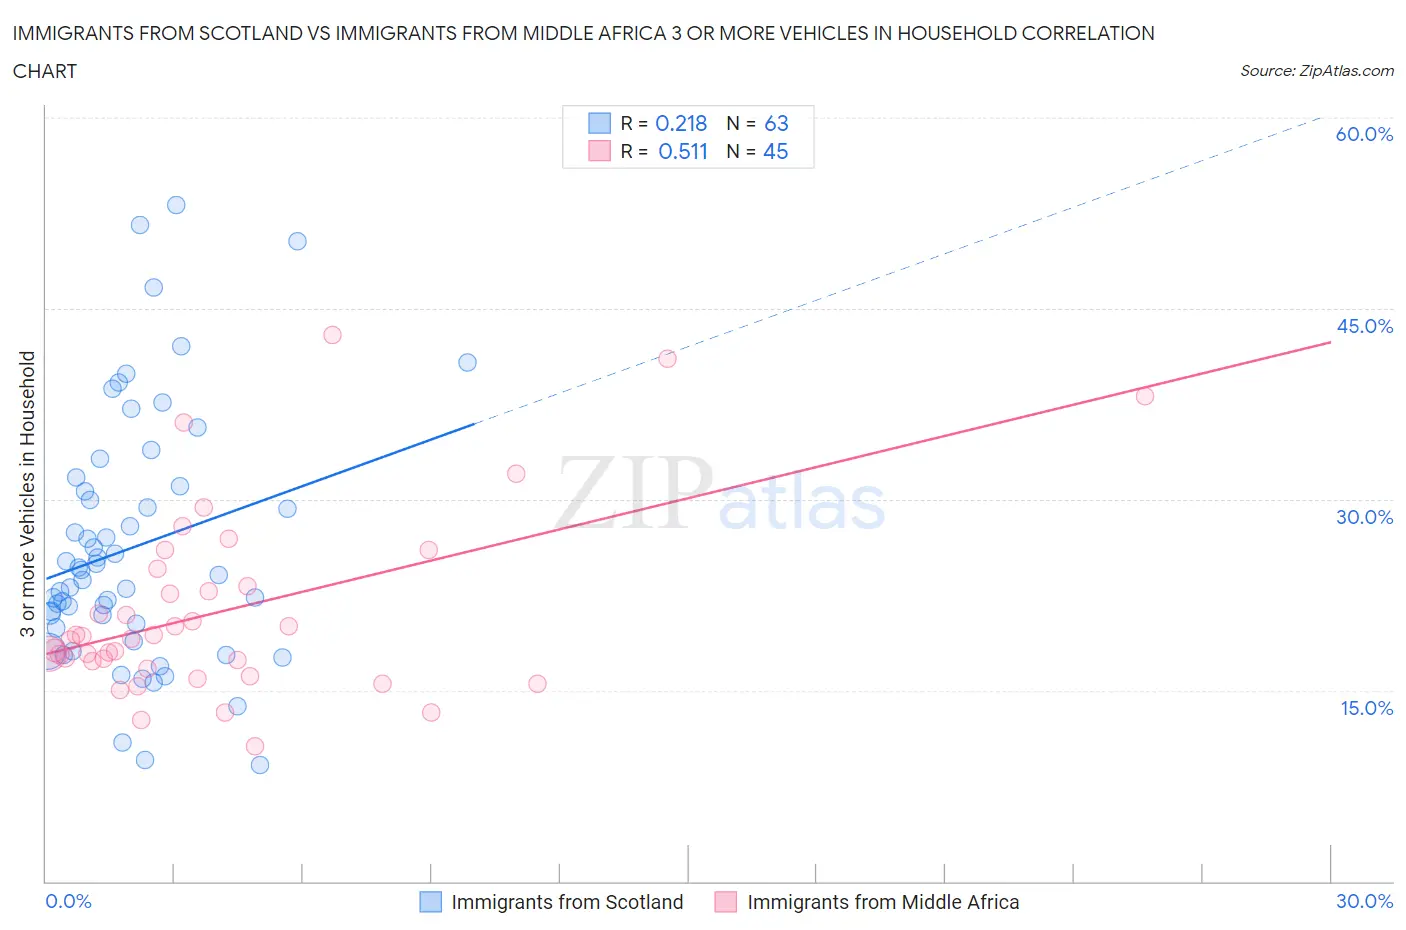
Immigrants from Scotland vs Immigrants from Middle Africa 3 or more Vehicles in Household Correlation Chart
The statistical analysis conducted on geographies consisting of 196,362,918 people shows a weak positive correlation between the proportion of Immigrants from Scotland and percentage of households with 3 or more vehicles available in the United States with a correlation coefficient (R) of 0.218 and weighted average of 20.8%. Similarly, the statistical analysis conducted on geographies consisting of 202,639,411 people shows a substantial positive correlation between the proportion of Immigrants from Middle Africa and percentage of households with 3 or more vehicles available in the United States with a correlation coefficient (R) of 0.511 and weighted average of 18.2%, a difference of 14.1%.
3 or more Vehicles in Household Correlation Summary
| Measurement | Immigrants from Scotland | Immigrants from Middle Africa |
| Minimum | 9.1% | 10.6% |
| Maximum | 53.1% | 42.9% |
| Range | 44.0% | 32.3% |
| Mean | 26.2% | 21.2% |
| Median | 24.0% | 19.1% |
| Interquartile 25% (IQ1) | 19.9% | 17.0% |
| Interquartile 75% (IQ3) | 31.0% | 23.8% |
| Interquartile Range (IQR) | 11.1% | 6.8% |
| Standard Deviation (Sample) | 9.9% | 7.3% |
| Standard Deviation (Population) | 9.8% | 7.2% |
Similar Demographics by 3 or more Vehicles in Household
Demographics Similar to Immigrants from Scotland by 3 or more Vehicles in Household
In terms of 3 or more vehicles in household, the demographic groups most similar to Immigrants from Scotland are Filipino (20.8%, a difference of 0.060%), Immigrants from Germany (20.8%, a difference of 0.15%), Bolivian (20.8%, a difference of 0.19%), Asian (20.8%, a difference of 0.20%), and Immigrants from Micronesia (20.7%, a difference of 0.23%).
| Demographics | Rating | Rank | 3 or more Vehicles in Household |
| Blackfeet | 97.9 /100 | #101 | Exceptional 20.9% |
| Seminole | 97.8 /100 | #102 | Exceptional 20.9% |
| Dutch West Indians | 97.8 /100 | #103 | Exceptional 20.9% |
| Luxembourgers | 97.7 /100 | #104 | Exceptional 20.9% |
| Austrians | 97.5 /100 | #105 | Exceptional 20.9% |
| Bolivians | 97.4 /100 | #106 | Exceptional 20.8% |
| Immigrants | Germany | 97.4 /100 | #107 | Exceptional 20.8% |
| Immigrants | Scotland | 97.1 /100 | #108 | Exceptional 20.8% |
| Filipinos | 97.0 /100 | #109 | Exceptional 20.8% |
| Asians | 96.8 /100 | #110 | Exceptional 20.8% |
| Immigrants | Micronesia | 96.7 /100 | #111 | Exceptional 20.7% |
| Nicaraguans | 96.2 /100 | #112 | Exceptional 20.7% |
| Immigrants | England | 96.2 /100 | #113 | Exceptional 20.7% |
| Burmese | 95.8 /100 | #114 | Exceptional 20.6% |
| French Canadians | 95.0 /100 | #115 | Exceptional 20.6% |
Demographics Similar to Immigrants from Middle Africa by 3 or more Vehicles in Household
In terms of 3 or more vehicles in household, the demographic groups most similar to Immigrants from Middle Africa are Immigrants from Honduras (18.2%, a difference of 0.010%), Immigrants from China (18.2%, a difference of 0.13%), Indonesian (18.3%, a difference of 0.24%), Immigrants from Malaysia (18.3%, a difference of 0.28%), and African (18.2%, a difference of 0.32%).
| Demographics | Rating | Rank | 3 or more Vehicles in Household |
| Immigrants | Uganda | 4.6 /100 | #232 | Tragic 18.4% |
| Hondurans | 4.6 /100 | #233 | Tragic 18.4% |
| Immigrants | North Macedonia | 4.4 /100 | #234 | Tragic 18.4% |
| Sierra Leoneans | 3.9 /100 | #235 | Tragic 18.3% |
| Immigrants | Malaysia | 3.6 /100 | #236 | Tragic 18.3% |
| Indonesians | 3.5 /100 | #237 | Tragic 18.3% |
| Immigrants | Honduras | 3.1 /100 | #238 | Tragic 18.2% |
| Immigrants | Middle Africa | 3.1 /100 | #239 | Tragic 18.2% |
| Immigrants | China | 2.9 /100 | #240 | Tragic 18.2% |
| Africans | 2.7 /100 | #241 | Tragic 18.2% |
| Hopi | 2.5 /100 | #242 | Tragic 18.2% |
| Immigrants | Europe | 2.4 /100 | #243 | Tragic 18.1% |
| Mongolians | 2.3 /100 | #244 | Tragic 18.1% |
| Immigrants | Belize | 2.1 /100 | #245 | Tragic 18.1% |
| Immigrants | Australia | 2.0 /100 | #246 | Tragic 18.1% |