Japanese vs Immigrants from Middle Africa Median Household Income
COMPARE
Japanese
Immigrants from Middle Africa
Median Household Income
Median Household Income Comparison
Japanese
Immigrants from Middle Africa
$83,395
MEDIAN HOUSEHOLD INCOME
25.1/ 100
METRIC RATING
198th/ 347
METRIC RANK
$77,559
MEDIAN HOUSEHOLD INCOME
0.8/ 100
METRIC RATING
255th/ 347
METRIC RANK
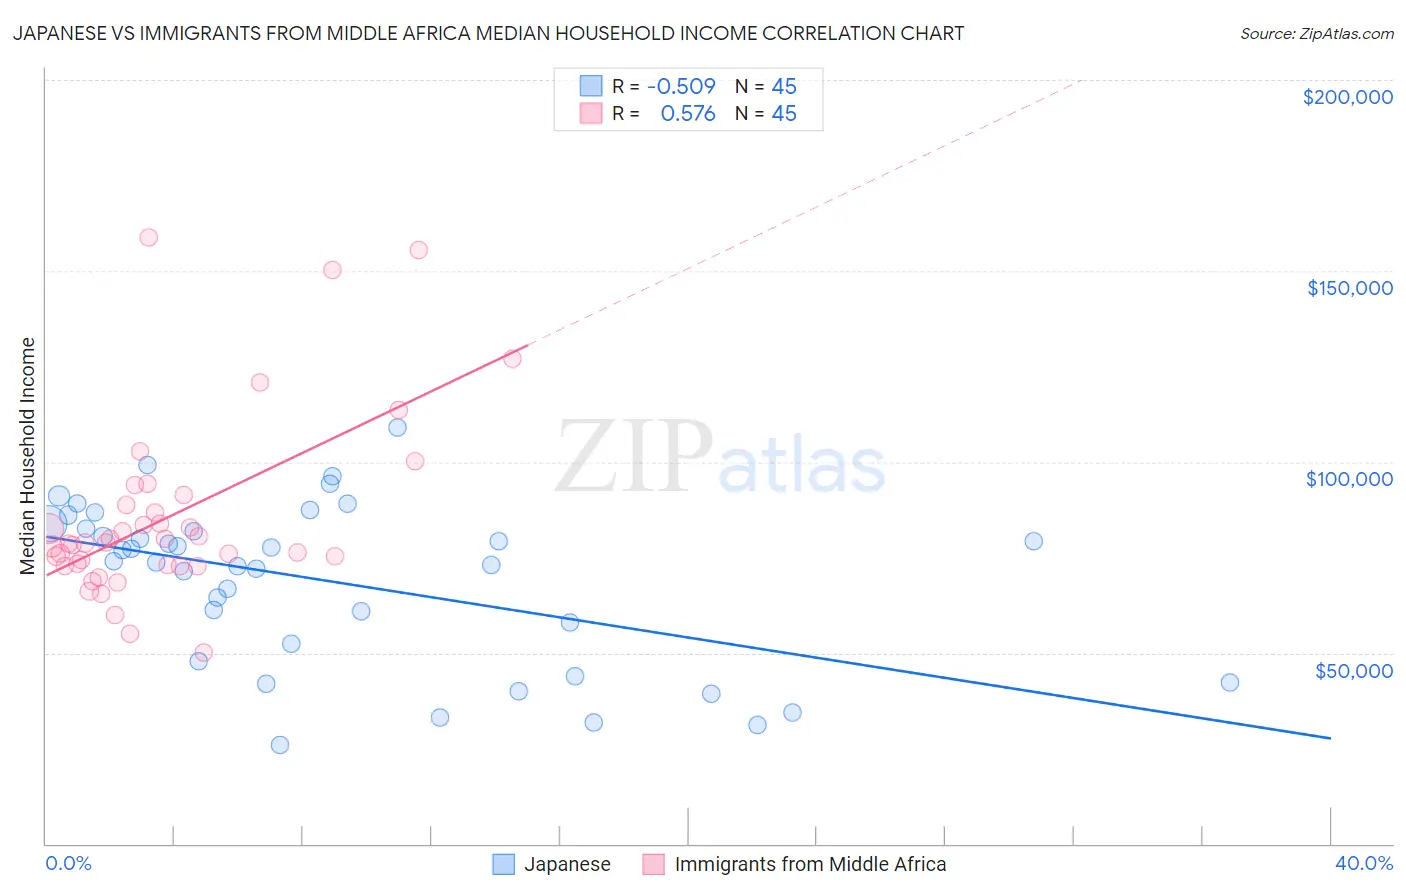
Japanese vs Immigrants from Middle Africa Median Household Income Correlation Chart
The statistical analysis conducted on geographies consisting of 249,040,762 people shows a substantial negative correlation between the proportion of Japanese and median household income in the United States with a correlation coefficient (R) of -0.509 and weighted average of $83,395. Similarly, the statistical analysis conducted on geographies consisting of 202,637,900 people shows a substantial positive correlation between the proportion of Immigrants from Middle Africa and median household income in the United States with a correlation coefficient (R) of 0.576 and weighted average of $77,559, a difference of 7.5%.
Median Household Income Correlation Summary
| Measurement | Japanese | Immigrants from Middle Africa |
| Minimum | $25,982 | $50,020 |
| Maximum | $108,958 | $158,604 |
| Range | $82,976 | $108,584 |
| Mean | $68,760 | $85,598 |
| Median | $73,852 | $78,726 |
| Interquartile 25% (IQ1) | $50,038 | $72,847 |
| Interquartile 75% (IQ3) | $83,119 | $90,002 |
| Interquartile Range (IQR) | $33,081 | $17,155 |
| Standard Deviation (Sample) | $21,079 | $23,894 |
| Standard Deviation (Population) | $20,843 | $23,627 |
Similar Demographics by Median Household Income
Demographics Similar to Japanese by Median Household Income
In terms of median household income, the demographic groups most similar to Japanese are German ($83,358, a difference of 0.040%), Aleut ($83,446, a difference of 0.060%), Tsimshian ($83,346, a difference of 0.060%), Spanish ($83,343, a difference of 0.060%), and Immigrants from Thailand ($83,327, a difference of 0.080%).
| Demographics | Rating | Rank | Median Household Income |
| Iraqis | 29.6 /100 | #191 | Fair $83,753 |
| Welsh | 28.0 /100 | #192 | Fair $83,628 |
| Finns | 27.7 /100 | #193 | Fair $83,607 |
| Ghanaians | 27.4 /100 | #194 | Fair $83,582 |
| Immigrants | Armenia | 27.0 /100 | #195 | Fair $83,555 |
| French | 26.0 /100 | #196 | Fair $83,468 |
| Aleuts | 25.7 /100 | #197 | Fair $83,446 |
| Japanese | 25.1 /100 | #198 | Fair $83,395 |
| Germans | 24.6 /100 | #199 | Fair $83,358 |
| Tsimshian | 24.5 /100 | #200 | Fair $83,346 |
| Spanish | 24.4 /100 | #201 | Fair $83,343 |
| Immigrants | Thailand | 24.3 /100 | #202 | Fair $83,327 |
| Immigrants | Cambodia | 24.0 /100 | #203 | Fair $83,304 |
| Immigrants | Africa | 23.8 /100 | #204 | Fair $83,289 |
| Celtics | 22.7 /100 | #205 | Fair $83,193 |
Demographics Similar to Immigrants from Middle Africa by Median Household Income
In terms of median household income, the demographic groups most similar to Immigrants from Middle Africa are Subsaharan African ($77,631, a difference of 0.090%), Immigrants from St. Vincent and the Grenadines ($77,690, a difference of 0.17%), Immigrants from West Indies ($77,956, a difference of 0.51%), Belizean ($77,028, a difference of 0.69%), and Mexican American Indian ($78,166, a difference of 0.78%).
| Demographics | Rating | Rank | Median Household Income |
| Sudanese | 1.5 /100 | #248 | Tragic $78,529 |
| West Indians | 1.4 /100 | #249 | Tragic $78,455 |
| Immigrants | Laos | 1.3 /100 | #250 | Tragic $78,327 |
| Mexican American Indians | 1.2 /100 | #251 | Tragic $78,166 |
| Immigrants | West Indies | 1.0 /100 | #252 | Tragic $77,956 |
| Immigrants | St. Vincent and the Grenadines | 0.9 /100 | #253 | Tragic $77,690 |
| Sub-Saharan Africans | 0.8 /100 | #254 | Tragic $77,631 |
| Immigrants | Middle Africa | 0.8 /100 | #255 | Tragic $77,559 |
| Belizeans | 0.6 /100 | #256 | Tragic $77,028 |
| Immigrants | Senegal | 0.5 /100 | #257 | Tragic $76,915 |
| Immigrants | Nicaragua | 0.5 /100 | #258 | Tragic $76,784 |
| Spanish American Indians | 0.4 /100 | #259 | Tragic $76,670 |
| Jamaicans | 0.4 /100 | #260 | Tragic $76,583 |
| Immigrants | Grenada | 0.4 /100 | #261 | Tragic $76,517 |
| French American Indians | 0.4 /100 | #262 | Tragic $76,387 |