Immigrants from Scotland vs Zimbabwean 3 or more Vehicles in Household
COMPARE
Immigrants from Scotland
Zimbabwean
3 or more Vehicles in Household
3 or more Vehicles in Household Comparison
Immigrants from Scotland
Zimbabweans
20.8%
3 OR MORE VEHICLES IN HOUSEHOLD
97.1/ 100
METRIC RATING
108th/ 347
METRIC RANK
20.3%
3 OR MORE VEHICLES IN HOUSEHOLD
88.7/ 100
METRIC RATING
129th/ 347
METRIC RANK
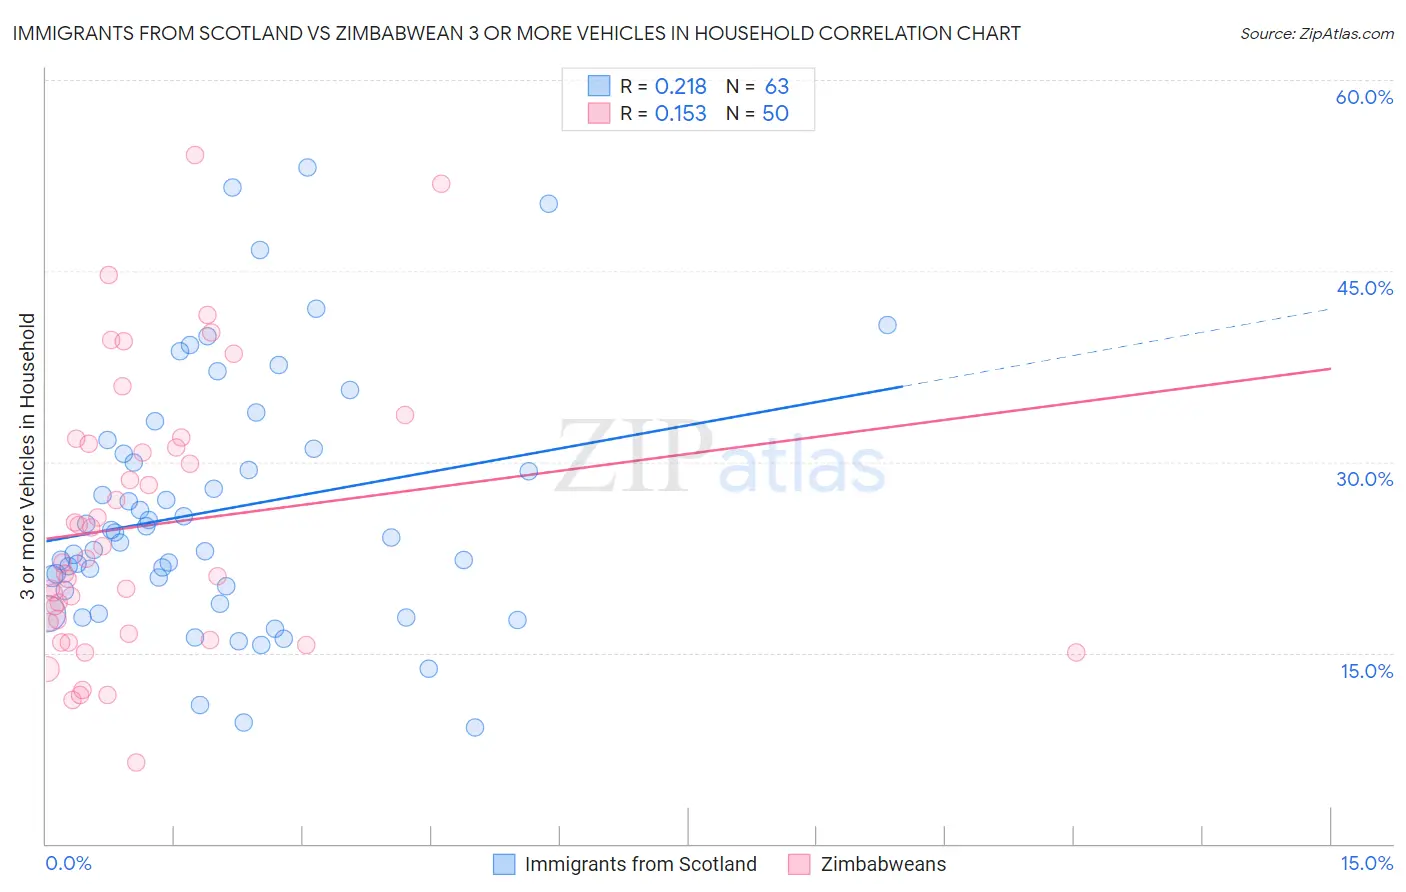
Immigrants from Scotland vs Zimbabwean 3 or more Vehicles in Household Correlation Chart
The statistical analysis conducted on geographies consisting of 196,362,918 people shows a weak positive correlation between the proportion of Immigrants from Scotland and percentage of households with 3 or more vehicles available in the United States with a correlation coefficient (R) of 0.218 and weighted average of 20.8%. Similarly, the statistical analysis conducted on geographies consisting of 69,187,806 people shows a poor positive correlation between the proportion of Zimbabweans and percentage of households with 3 or more vehicles available in the United States with a correlation coefficient (R) of 0.153 and weighted average of 20.3%, a difference of 2.7%.
3 or more Vehicles in Household Correlation Summary
| Measurement | Immigrants from Scotland | Zimbabwean |
| Minimum | 9.1% | 6.4% |
| Maximum | 53.1% | 54.1% |
| Range | 44.0% | 47.7% |
| Mean | 26.2% | 25.0% |
| Median | 24.0% | 22.2% |
| Interquartile 25% (IQ1) | 19.9% | 16.5% |
| Interquartile 75% (IQ3) | 31.0% | 31.5% |
| Interquartile Range (IQR) | 11.1% | 14.9% |
| Standard Deviation (Sample) | 9.9% | 10.8% |
| Standard Deviation (Population) | 9.8% | 10.6% |
Similar Demographics by 3 or more Vehicles in Household
Demographics Similar to Immigrants from Scotland by 3 or more Vehicles in Household
In terms of 3 or more vehicles in household, the demographic groups most similar to Immigrants from Scotland are Filipino (20.8%, a difference of 0.060%), Immigrants from Germany (20.8%, a difference of 0.15%), Bolivian (20.8%, a difference of 0.19%), Asian (20.8%, a difference of 0.20%), and Immigrants from Micronesia (20.7%, a difference of 0.23%).
| Demographics | Rating | Rank | 3 or more Vehicles in Household |
| Blackfeet | 97.9 /100 | #101 | Exceptional 20.9% |
| Seminole | 97.8 /100 | #102 | Exceptional 20.9% |
| Dutch West Indians | 97.8 /100 | #103 | Exceptional 20.9% |
| Luxembourgers | 97.7 /100 | #104 | Exceptional 20.9% |
| Austrians | 97.5 /100 | #105 | Exceptional 20.9% |
| Bolivians | 97.4 /100 | #106 | Exceptional 20.8% |
| Immigrants | Germany | 97.4 /100 | #107 | Exceptional 20.8% |
| Immigrants | Scotland | 97.1 /100 | #108 | Exceptional 20.8% |
| Filipinos | 97.0 /100 | #109 | Exceptional 20.8% |
| Asians | 96.8 /100 | #110 | Exceptional 20.8% |
| Immigrants | Micronesia | 96.7 /100 | #111 | Exceptional 20.7% |
| Nicaraguans | 96.2 /100 | #112 | Exceptional 20.7% |
| Immigrants | England | 96.2 /100 | #113 | Exceptional 20.7% |
| Burmese | 95.8 /100 | #114 | Exceptional 20.6% |
| French Canadians | 95.0 /100 | #115 | Exceptional 20.6% |
Demographics Similar to Zimbabweans by 3 or more Vehicles in Household
In terms of 3 or more vehicles in household, the demographic groups most similar to Zimbabweans are Greek (20.3%, a difference of 0.030%), Immigrants from Asia (20.2%, a difference of 0.10%), Immigrants from Canada (20.2%, a difference of 0.15%), Immigrants from North America (20.2%, a difference of 0.15%), and Polish (20.2%, a difference of 0.24%).
| Demographics | Rating | Rank | 3 or more Vehicles in Household |
| German Russians | 93.7 /100 | #122 | Exceptional 20.5% |
| Immigrants | Korea | 93.7 /100 | #123 | Exceptional 20.5% |
| Central Americans | 93.1 /100 | #124 | Exceptional 20.5% |
| Immigrants | Netherlands | 92.9 /100 | #125 | Exceptional 20.4% |
| Slavs | 92.1 /100 | #126 | Exceptional 20.4% |
| Immigrants | Bolivia | 92.0 /100 | #127 | Exceptional 20.4% |
| New Zealanders | 91.3 /100 | #128 | Exceptional 20.4% |
| Zimbabweans | 88.7 /100 | #129 | Excellent 20.3% |
| Greeks | 88.6 /100 | #130 | Excellent 20.3% |
| Immigrants | Asia | 88.1 /100 | #131 | Excellent 20.2% |
| Immigrants | Canada | 87.8 /100 | #132 | Excellent 20.2% |
| Immigrants | North America | 87.8 /100 | #133 | Excellent 20.2% |
| Poles | 87.3 /100 | #134 | Excellent 20.2% |
| Immigrants | India | 87.2 /100 | #135 | Excellent 20.2% |
| Immigrants | Nicaragua | 87.1 /100 | #136 | Excellent 20.2% |