Immigrants from Scotland vs Immigrants from Zaire 3 or more Vehicles in Household
COMPARE
Immigrants from Scotland
Immigrants from Zaire
3 or more Vehicles in Household
3 or more Vehicles in Household Comparison
Immigrants from Scotland
Immigrants from Zaire
20.8%
3 OR MORE VEHICLES IN HOUSEHOLD
97.1/ 100
METRIC RATING
108th/ 347
METRIC RANK
16.7%
3 OR MORE VEHICLES IN HOUSEHOLD
0.1/ 100
METRIC RATING
298th/ 347
METRIC RANK
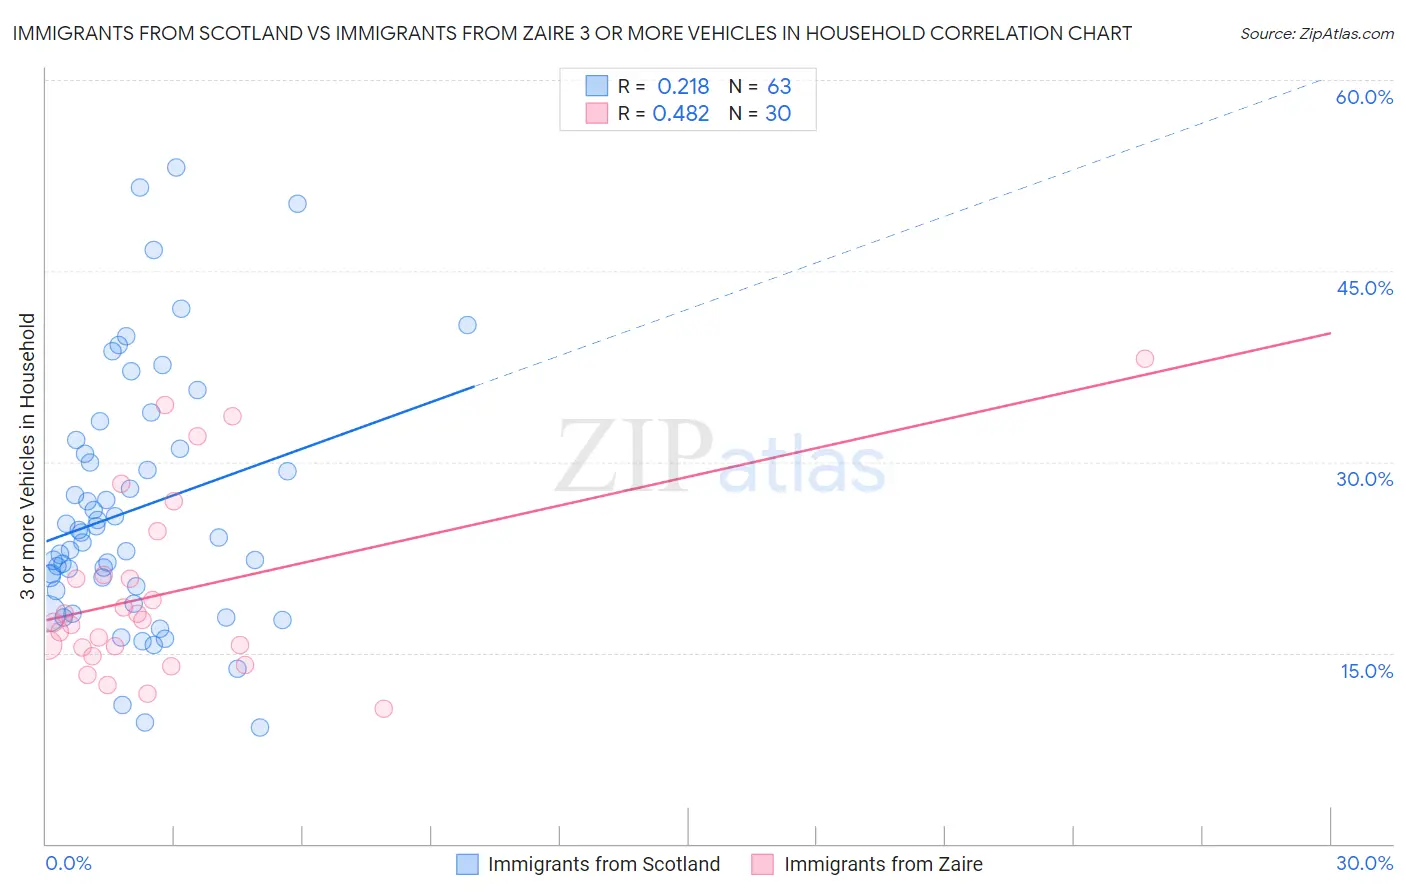
Immigrants from Scotland vs Immigrants from Zaire 3 or more Vehicles in Household Correlation Chart
The statistical analysis conducted on geographies consisting of 196,362,918 people shows a weak positive correlation between the proportion of Immigrants from Scotland and percentage of households with 3 or more vehicles available in the United States with a correlation coefficient (R) of 0.218 and weighted average of 20.8%. Similarly, the statistical analysis conducted on geographies consisting of 107,239,583 people shows a moderate positive correlation between the proportion of Immigrants from Zaire and percentage of households with 3 or more vehicles available in the United States with a correlation coefficient (R) of 0.482 and weighted average of 16.7%, a difference of 24.4%.
3 or more Vehicles in Household Correlation Summary
| Measurement | Immigrants from Scotland | Immigrants from Zaire |
| Minimum | 9.1% | 10.6% |
| Maximum | 53.1% | 38.1% |
| Range | 44.0% | 27.5% |
| Mean | 26.2% | 19.8% |
| Median | 24.0% | 17.5% |
| Interquartile 25% (IQ1) | 19.9% | 15.4% |
| Interquartile 75% (IQ3) | 31.0% | 21.1% |
| Interquartile Range (IQR) | 11.1% | 5.7% |
| Standard Deviation (Sample) | 9.9% | 7.2% |
| Standard Deviation (Population) | 9.8% | 7.1% |
Similar Demographics by 3 or more Vehicles in Household
Demographics Similar to Immigrants from Scotland by 3 or more Vehicles in Household
In terms of 3 or more vehicles in household, the demographic groups most similar to Immigrants from Scotland are Filipino (20.8%, a difference of 0.060%), Immigrants from Germany (20.8%, a difference of 0.15%), Bolivian (20.8%, a difference of 0.19%), Asian (20.8%, a difference of 0.20%), and Immigrants from Micronesia (20.7%, a difference of 0.23%).
| Demographics | Rating | Rank | 3 or more Vehicles in Household |
| Blackfeet | 97.9 /100 | #101 | Exceptional 20.9% |
| Seminole | 97.8 /100 | #102 | Exceptional 20.9% |
| Dutch West Indians | 97.8 /100 | #103 | Exceptional 20.9% |
| Luxembourgers | 97.7 /100 | #104 | Exceptional 20.9% |
| Austrians | 97.5 /100 | #105 | Exceptional 20.9% |
| Bolivians | 97.4 /100 | #106 | Exceptional 20.8% |
| Immigrants | Germany | 97.4 /100 | #107 | Exceptional 20.8% |
| Immigrants | Scotland | 97.1 /100 | #108 | Exceptional 20.8% |
| Filipinos | 97.0 /100 | #109 | Exceptional 20.8% |
| Asians | 96.8 /100 | #110 | Exceptional 20.8% |
| Immigrants | Micronesia | 96.7 /100 | #111 | Exceptional 20.7% |
| Nicaraguans | 96.2 /100 | #112 | Exceptional 20.7% |
| Immigrants | England | 96.2 /100 | #113 | Exceptional 20.7% |
| Burmese | 95.8 /100 | #114 | Exceptional 20.6% |
| French Canadians | 95.0 /100 | #115 | Exceptional 20.6% |
Demographics Similar to Immigrants from Zaire by 3 or more Vehicles in Household
In terms of 3 or more vehicles in household, the demographic groups most similar to Immigrants from Zaire are Immigrants from South America (16.7%, a difference of 0.060%), Israeli (16.8%, a difference of 0.37%), Cypriot (16.6%, a difference of 0.54%), Inupiat (16.9%, a difference of 0.84%), and Paraguayan (16.6%, a difference of 0.95%).
| Demographics | Rating | Rank | 3 or more Vehicles in Household |
| Immigrants | Congo | 0.1 /100 | #291 | Tragic 17.0% |
| Immigrants | Spain | 0.1 /100 | #292 | Tragic 17.0% |
| Bahamians | 0.1 /100 | #293 | Tragic 16.9% |
| Immigrants | Western Africa | 0.1 /100 | #294 | Tragic 16.9% |
| Immigrants | Russia | 0.1 /100 | #295 | Tragic 16.9% |
| Inupiat | 0.1 /100 | #296 | Tragic 16.9% |
| Israelis | 0.1 /100 | #297 | Tragic 16.8% |
| Immigrants | Zaire | 0.1 /100 | #298 | Tragic 16.7% |
| Immigrants | South America | 0.1 /100 | #299 | Tragic 16.7% |
| Cypriots | 0.0 /100 | #300 | Tragic 16.6% |
| Paraguayans | 0.0 /100 | #301 | Tragic 16.6% |
| Immigrants | Greece | 0.0 /100 | #302 | Tragic 16.5% |
| Immigrants | Serbia | 0.0 /100 | #303 | Tragic 16.4% |
| Ghanaians | 0.0 /100 | #304 | Tragic 16.4% |
| Immigrants | Morocco | 0.0 /100 | #305 | Tragic 16.3% |