Sierra Leonean vs Zimbabwean 3 or more Vehicles in Household
COMPARE
Sierra Leonean
Zimbabwean
3 or more Vehicles in Household
3 or more Vehicles in Household Comparison
Sierra Leoneans
Zimbabweans
18.3%
3 OR MORE VEHICLES IN HOUSEHOLD
3.9/ 100
METRIC RATING
235th/ 347
METRIC RANK
20.3%
3 OR MORE VEHICLES IN HOUSEHOLD
88.7/ 100
METRIC RATING
129th/ 347
METRIC RANK
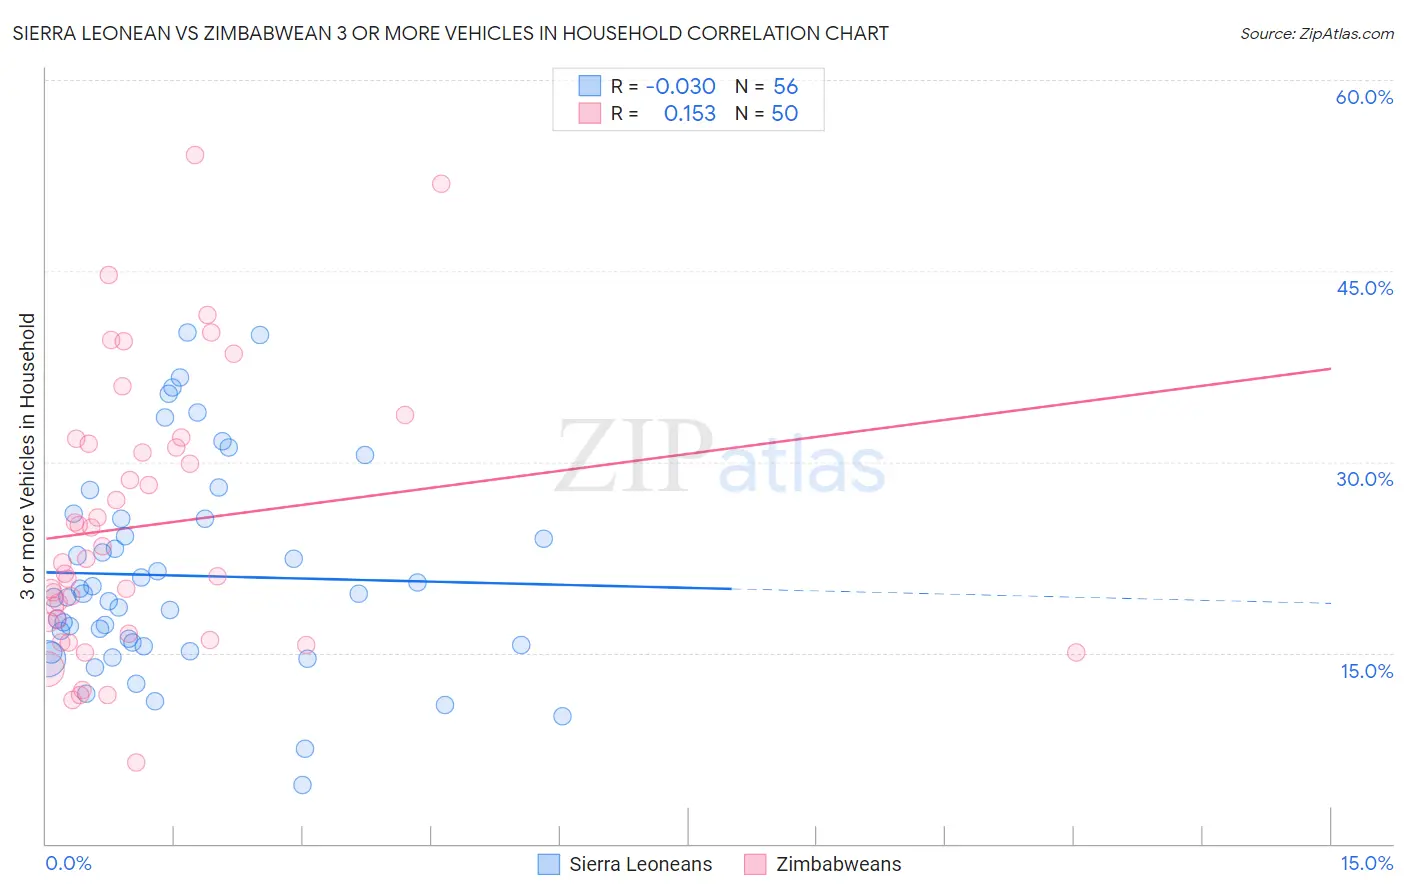
Sierra Leonean vs Zimbabwean 3 or more Vehicles in Household Correlation Chart
The statistical analysis conducted on geographies consisting of 83,340,667 people shows no correlation between the proportion of Sierra Leoneans and percentage of households with 3 or more vehicles available in the United States with a correlation coefficient (R) of -0.030 and weighted average of 18.3%. Similarly, the statistical analysis conducted on geographies consisting of 69,187,806 people shows a poor positive correlation between the proportion of Zimbabweans and percentage of households with 3 or more vehicles available in the United States with a correlation coefficient (R) of 0.153 and weighted average of 20.3%, a difference of 10.6%.
3 or more Vehicles in Household Correlation Summary
| Measurement | Sierra Leonean | Zimbabwean |
| Minimum | 4.7% | 6.4% |
| Maximum | 40.1% | 54.1% |
| Range | 35.5% | 47.7% |
| Mean | 21.1% | 25.0% |
| Median | 19.5% | 22.2% |
| Interquartile 25% (IQ1) | 15.6% | 16.5% |
| Interquartile 75% (IQ3) | 25.5% | 31.5% |
| Interquartile Range (IQR) | 10.0% | 14.9% |
| Standard Deviation (Sample) | 8.1% | 10.8% |
| Standard Deviation (Population) | 8.0% | 10.6% |
Similar Demographics by 3 or more Vehicles in Household
Demographics Similar to Sierra Leoneans by 3 or more Vehicles in Household
In terms of 3 or more vehicles in household, the demographic groups most similar to Sierra Leoneans are Immigrants from Malaysia (18.3%, a difference of 0.18%), Indonesian (18.3%, a difference of 0.23%), Immigrants from North Macedonia (18.4%, a difference of 0.28%), Honduran (18.4%, a difference of 0.34%), and Immigrants from Uganda (18.4%, a difference of 0.36%).
| Demographics | Rating | Rank | 3 or more Vehicles in Household |
| Turks | 5.4 /100 | #228 | Tragic 18.4% |
| Immigrants | Switzerland | 5.0 /100 | #229 | Tragic 18.4% |
| Immigrants | Western Asia | 4.8 /100 | #230 | Tragic 18.4% |
| Immigrants | Belgium | 4.8 /100 | #231 | Tragic 18.4% |
| Immigrants | Uganda | 4.6 /100 | #232 | Tragic 18.4% |
| Hondurans | 4.6 /100 | #233 | Tragic 18.4% |
| Immigrants | North Macedonia | 4.4 /100 | #234 | Tragic 18.4% |
| Sierra Leoneans | 3.9 /100 | #235 | Tragic 18.3% |
| Immigrants | Malaysia | 3.6 /100 | #236 | Tragic 18.3% |
| Indonesians | 3.5 /100 | #237 | Tragic 18.3% |
| Immigrants | Honduras | 3.1 /100 | #238 | Tragic 18.2% |
| Immigrants | Middle Africa | 3.1 /100 | #239 | Tragic 18.2% |
| Immigrants | China | 2.9 /100 | #240 | Tragic 18.2% |
| Africans | 2.7 /100 | #241 | Tragic 18.2% |
| Hopi | 2.5 /100 | #242 | Tragic 18.2% |
Demographics Similar to Zimbabweans by 3 or more Vehicles in Household
In terms of 3 or more vehicles in household, the demographic groups most similar to Zimbabweans are Greek (20.3%, a difference of 0.030%), Immigrants from Asia (20.2%, a difference of 0.10%), Immigrants from Canada (20.2%, a difference of 0.15%), Immigrants from North America (20.2%, a difference of 0.15%), and Polish (20.2%, a difference of 0.24%).
| Demographics | Rating | Rank | 3 or more Vehicles in Household |
| German Russians | 93.7 /100 | #122 | Exceptional 20.5% |
| Immigrants | Korea | 93.7 /100 | #123 | Exceptional 20.5% |
| Central Americans | 93.1 /100 | #124 | Exceptional 20.5% |
| Immigrants | Netherlands | 92.9 /100 | #125 | Exceptional 20.4% |
| Slavs | 92.1 /100 | #126 | Exceptional 20.4% |
| Immigrants | Bolivia | 92.0 /100 | #127 | Exceptional 20.4% |
| New Zealanders | 91.3 /100 | #128 | Exceptional 20.4% |
| Zimbabweans | 88.7 /100 | #129 | Excellent 20.3% |
| Greeks | 88.6 /100 | #130 | Excellent 20.3% |
| Immigrants | Asia | 88.1 /100 | #131 | Excellent 20.2% |
| Immigrants | Canada | 87.8 /100 | #132 | Excellent 20.2% |
| Immigrants | North America | 87.8 /100 | #133 | Excellent 20.2% |
| Poles | 87.3 /100 | #134 | Excellent 20.2% |
| Immigrants | India | 87.2 /100 | #135 | Excellent 20.2% |
| Immigrants | Nicaragua | 87.1 /100 | #136 | Excellent 20.2% |