Immigrants from Scotland vs Venezuelan 3 or more Vehicles in Household
COMPARE
Immigrants from Scotland
Venezuelan
3 or more Vehicles in Household
3 or more Vehicles in Household Comparison
Immigrants from Scotland
Venezuelans
20.8%
3 OR MORE VEHICLES IN HOUSEHOLD
97.1/ 100
METRIC RATING
108th/ 347
METRIC RANK
18.0%
3 OR MORE VEHICLES IN HOUSEHOLD
1.7/ 100
METRIC RATING
250th/ 347
METRIC RANK
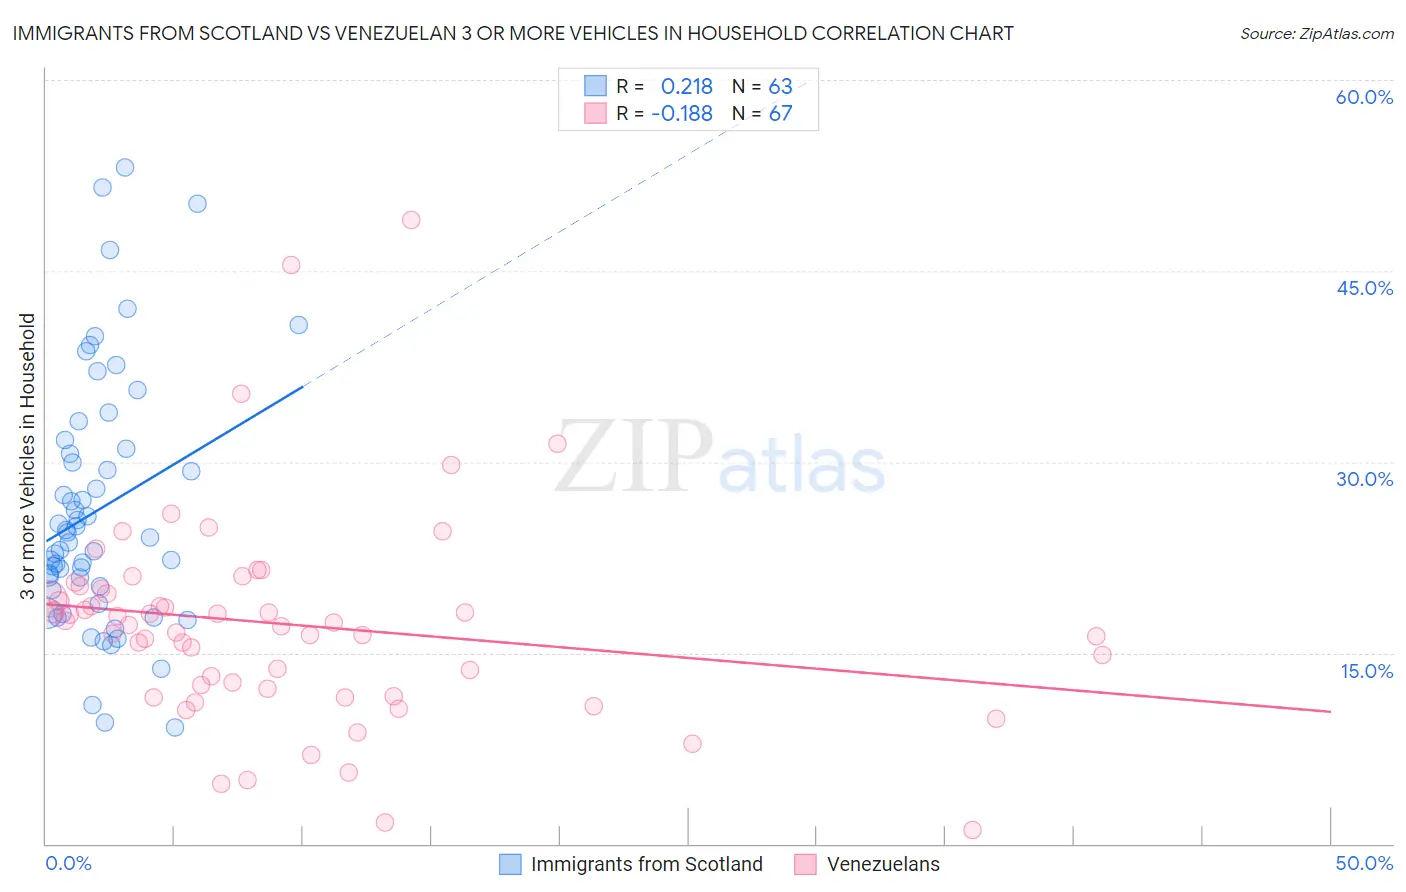
Immigrants from Scotland vs Venezuelan 3 or more Vehicles in Household Correlation Chart
The statistical analysis conducted on geographies consisting of 196,362,918 people shows a weak positive correlation between the proportion of Immigrants from Scotland and percentage of households with 3 or more vehicles available in the United States with a correlation coefficient (R) of 0.218 and weighted average of 20.8%. Similarly, the statistical analysis conducted on geographies consisting of 306,053,229 people shows a poor negative correlation between the proportion of Venezuelans and percentage of households with 3 or more vehicles available in the United States with a correlation coefficient (R) of -0.188 and weighted average of 18.0%, a difference of 15.5%.
3 or more Vehicles in Household Correlation Summary
| Measurement | Immigrants from Scotland | Venezuelan |
| Minimum | 9.1% | 1.1% |
| Maximum | 53.1% | 49.0% |
| Range | 44.0% | 47.9% |
| Mean | 26.2% | 17.2% |
| Median | 24.0% | 17.1% |
| Interquartile 25% (IQ1) | 19.9% | 12.2% |
| Interquartile 75% (IQ3) | 31.0% | 20.0% |
| Interquartile Range (IQR) | 11.1% | 7.8% |
| Standard Deviation (Sample) | 9.9% | 8.3% |
| Standard Deviation (Population) | 9.8% | 8.2% |
Similar Demographics by 3 or more Vehicles in Household
Demographics Similar to Immigrants from Scotland by 3 or more Vehicles in Household
In terms of 3 or more vehicles in household, the demographic groups most similar to Immigrants from Scotland are Filipino (20.8%, a difference of 0.060%), Immigrants from Germany (20.8%, a difference of 0.15%), Bolivian (20.8%, a difference of 0.19%), Asian (20.8%, a difference of 0.20%), and Immigrants from Micronesia (20.7%, a difference of 0.23%).
| Demographics | Rating | Rank | 3 or more Vehicles in Household |
| Blackfeet | 97.9 /100 | #101 | Exceptional 20.9% |
| Seminole | 97.8 /100 | #102 | Exceptional 20.9% |
| Dutch West Indians | 97.8 /100 | #103 | Exceptional 20.9% |
| Luxembourgers | 97.7 /100 | #104 | Exceptional 20.9% |
| Austrians | 97.5 /100 | #105 | Exceptional 20.9% |
| Bolivians | 97.4 /100 | #106 | Exceptional 20.8% |
| Immigrants | Germany | 97.4 /100 | #107 | Exceptional 20.8% |
| Immigrants | Scotland | 97.1 /100 | #108 | Exceptional 20.8% |
| Filipinos | 97.0 /100 | #109 | Exceptional 20.8% |
| Asians | 96.8 /100 | #110 | Exceptional 20.8% |
| Immigrants | Micronesia | 96.7 /100 | #111 | Exceptional 20.7% |
| Nicaraguans | 96.2 /100 | #112 | Exceptional 20.7% |
| Immigrants | England | 96.2 /100 | #113 | Exceptional 20.7% |
| Burmese | 95.8 /100 | #114 | Exceptional 20.6% |
| French Canadians | 95.0 /100 | #115 | Exceptional 20.6% |
Demographics Similar to Venezuelans by 3 or more Vehicles in Household
In terms of 3 or more vehicles in household, the demographic groups most similar to Venezuelans are Immigrants from Saudi Arabia (18.0%, a difference of 0.020%), Immigrants from Eastern Africa (18.0%, a difference of 0.080%), Alsatian (18.0%, a difference of 0.20%), Carpatho Rusyn (18.0%, a difference of 0.21%), and Immigrants from Australia (18.1%, a difference of 0.37%).
| Demographics | Rating | Rank | 3 or more Vehicles in Household |
| Immigrants | Europe | 2.4 /100 | #243 | Tragic 18.1% |
| Mongolians | 2.3 /100 | #244 | Tragic 18.1% |
| Immigrants | Belize | 2.1 /100 | #245 | Tragic 18.1% |
| Immigrants | Australia | 2.0 /100 | #246 | Tragic 18.1% |
| Carpatho Rusyns | 1.9 /100 | #247 | Tragic 18.0% |
| Immigrants | Eastern Africa | 1.8 /100 | #248 | Tragic 18.0% |
| Immigrants | Saudi Arabia | 1.7 /100 | #249 | Tragic 18.0% |
| Venezuelans | 1.7 /100 | #250 | Tragic 18.0% |
| Alsatians | 1.5 /100 | #251 | Tragic 18.0% |
| Immigrants | Southern Europe | 1.4 /100 | #252 | Tragic 17.9% |
| Immigrants | Ethiopia | 1.3 /100 | #253 | Tragic 17.9% |
| Ethiopians | 1.2 /100 | #254 | Tragic 17.9% |
| Immigrants | Turkey | 1.2 /100 | #255 | Tragic 17.9% |
| Sub-Saharan Africans | 1.1 /100 | #256 | Tragic 17.9% |
| Immigrants | Eritrea | 1.1 /100 | #257 | Tragic 17.8% |